 Open Access Article
Creative Commons Attribution 3.0 Unported Licence
Significant structural change in human c-Myc promoter G-quadruplex upon peptide binding in potassium†
Nikita Kundu‡
a,
Taniya Sharma‡a,
Sarvpreet Kaur‡a,
Mamta Singhb,
Vinit Kumarb,
Uttam Sharmac,
Aklank Jainc,
Jadala Shankaraswamyd,
Daisuke Miyoshi e and
Sarika Saxena
 *a
*a
aAmity Institute of Biotechnology, Amity University Uttar Pradesh, Structural Biology Lab, Sector-125, Expressway Highway, Noida 201313, India. E-mail: ssaxena1@amity.edu; sarikaigib@yahoo.co.in; Tel: +91-120-4735600
bAmity Institute of Molecular Medicine and Stem Cell Research, Amity University Uttar Pradesh, Noida 201313, India
cDepartment of Animal Sciences, Central University of Punjab, Bathinda, India
dDepartment of Fruit Science, College of Horticulture, Mojerla, Sri Konda Laxman Telangana State Horticultural University, 509382, Telangana, India
eFaculty of Frontiers of Innovative Research in Science and Technology (FIRST), Konan University, 7-1-20 Minatojima-minamimachi, Chuo-ku, Kobe, Hyogo 650-0047, Japan
First published on 8th March 2022
Abstract
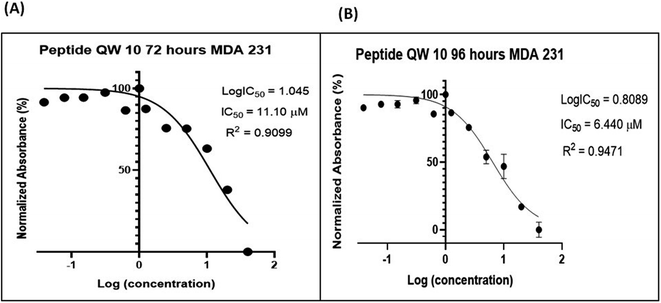
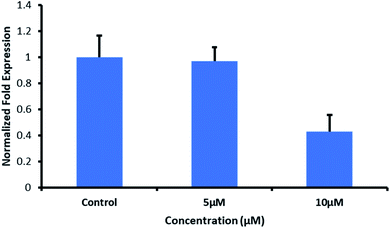
We selected the G-quadruplex motif located in the nuclease-hypersensitive elements (NHE) III1 region of the c-Myc promoter and for the first time performed its interaction studies with a designed peptide (QW10). Our CD results showed that the peptide bound to the c-Myc G-quadruplex and induced a significant blue shift in the positive peak of 20 nm in KCl alone or with 40wt% PEG200 or 20wt% PEG8000 in comparison to NaCl. Our Native Gel results confirmed that peptide binding destabilized the duplex and stabilized the unimolecular G-quadruplex and not binding to i-motif. UV thermal results confirmed destabilization of bimolecular structure and stabilization of unimolecular G-quadruplex. QW10 showed preferential binding towards c-MYC promoter G4 with binding constant (Kb) values of the order of 0.05 ± 0.2 μM, 0.12 ± 0.1 μM and 0.05 ± 0.3 μM for complexes in K+ alone or 40wt% PEG 200 or 20wt% PEG 8000 respectively. QW10 showed preferential cytotoxicity with IC50 values of 11.10 μM and 6.44 μM after 72 and 96 hours' incubation on Human Breast Carcinoma MDA-MB 231 cells and was found to be non-toxic with Human Embryonic Kidney (HEK-1) cells. Interestingly, we observed reduction of c-Myc gene expression by 2.5 fold due to QW10 binding and stabilizing c-MYC G4. Our study for the first time provides an expanded overview of significant structural change in human c-Myc promoter G-quadruplex upon peptide binding in potassium.
1 Introduction
G-quadruplexes are one of the higher-order DNA structures which have been identified for their functional importance in the regions of the genome like human telomeres and oncogene promoters. In the human genome, about 376![[thin space (1/6-em)]](https://www.rsc.org/images/entities/char_2009.gif) 000 putative motifs are present, which tend to form a G-quadruplex structure.1,2 Depending upon their location, G-quadruplex motifs act as gene regulators via regulating various essential biological processes like telomeric maintenance and control the transcription and translation of various protooncogene oncogene's promoter (c-Myc, c-kit, k-ras, and bcl-2) regions.3–10 c-Myc is an important regulator for the processes of normal cellular growth regulation and differentiation, and its dysregulation is one of the hallmarks of many cancers. The abnormal over-expression of c-Myc has been reported in human cancers such as breast, colon, and cervix carcinomas, as well as small-cell lung cancer, glioblastomas, osteosarcomas, and myeloid leukemia.11 The promoter region located 142–115 bp upstream from the P1 promoter of the c-Myc gene is composed of seven (NHEs), of which, NHE III1 controls 80–90% transcription of c-Myc gene and is responsible for mediating multiple pathways important in tumor cell survival. The (NHE) III1 region of the c-Myc promoter can fold up into the G-quadruplex structure,12,13 and compounds that stabilize the G-quadruplex can repress c-Myc gene expression.13–16 This could be due to the polymerase pausing at the site of G4 formation or resulted in altered protein expression and also can activate DNA damage responses, thereby potentiating their anticancer effects. Therefore, small molecule that binds and stabilizes G4 DNAs leading to be considered as an alternative and a promising strategy to effectively inhibit the growth of cancer cells and overcome the problems of drug resistance.17 Over the past decades, several derivatives of quindolines have shown effective to stabilize the c-Myc G-quadruplex and down-regulate the expression of c-Myc in cancer cells.19,20 In recent years, a number of metal complexes like ruthenium(II) have been reported to effectively bind to, induce and stabilize c-Myc G-quadruplex DNA.21,22 Zhang et al. have been synthesized and characterized the complex [Ru(phen)2(p-tFMPIP)](ClO4)2 {p-tFMPIP = 2-(4-(trifluoromethyphenyl)-1H-imidazo[4,5f][1,10]phenanthroline)} to stabilize the c-Myc G-quadruplex DNA and showed the growth inhibition in MDA-MB-231 cells through apoptosis pathway.18 Li et al. reported a series of aryl alkyne modified complex [Ru(phen)2(p-tFMPIP)](ClO4)2 {p-tFMPIP = 2-(4-(trifluoromethyphenyl)-1H-imidazo[4,5f][1,10]phenanthroline)} as a groove binder of c-Myc G-quadruplex DNA which can also act as a potential luminescent switch-on probe through selectively recognizing and promoting self-assembly of c-Myc G-quadruplex DNA.21 Wu et al. demonstrated that a series of arene ruthenium(II) complexes [(η6-C6H6)Ru(p-XPIP)Cl]Cl (X = H; F; Cl; Br; and I) {PIP = 2-phenylimidazole[4,5f][1,10]phenanthroline)} which were binding and stabilizing c-Myc G-quadruplex DNA and exhibit excellent inhibitory activity against MDA-MB-231 breast cancer cells.23 Recently, bioactive compound L755507 was reported as novel inhibitor blocks c-Myc–MAX heterodimerization and induces apoptosis in cancer cells.24 Despite the progress in the discovery of new G-quadruplex-interactive ligands, important questions remain regarding the ligand-binding specificity in the c-Myc G-quadruplex. To date, no small molecule inhibitors that directly target the c-Myc interaction have progressed to clinical trials except few report.25 This is due to less target selectivity, rapid metabolism and low potency.
000 putative motifs are present, which tend to form a G-quadruplex structure.1,2 Depending upon their location, G-quadruplex motifs act as gene regulators via regulating various essential biological processes like telomeric maintenance and control the transcription and translation of various protooncogene oncogene's promoter (c-Myc, c-kit, k-ras, and bcl-2) regions.3–10 c-Myc is an important regulator for the processes of normal cellular growth regulation and differentiation, and its dysregulation is one of the hallmarks of many cancers. The abnormal over-expression of c-Myc has been reported in human cancers such as breast, colon, and cervix carcinomas, as well as small-cell lung cancer, glioblastomas, osteosarcomas, and myeloid leukemia.11 The promoter region located 142–115 bp upstream from the P1 promoter of the c-Myc gene is composed of seven (NHEs), of which, NHE III1 controls 80–90% transcription of c-Myc gene and is responsible for mediating multiple pathways important in tumor cell survival. The (NHE) III1 region of the c-Myc promoter can fold up into the G-quadruplex structure,12,13 and compounds that stabilize the G-quadruplex can repress c-Myc gene expression.13–16 This could be due to the polymerase pausing at the site of G4 formation or resulted in altered protein expression and also can activate DNA damage responses, thereby potentiating their anticancer effects. Therefore, small molecule that binds and stabilizes G4 DNAs leading to be considered as an alternative and a promising strategy to effectively inhibit the growth of cancer cells and overcome the problems of drug resistance.17 Over the past decades, several derivatives of quindolines have shown effective to stabilize the c-Myc G-quadruplex and down-regulate the expression of c-Myc in cancer cells.19,20 In recent years, a number of metal complexes like ruthenium(II) have been reported to effectively bind to, induce and stabilize c-Myc G-quadruplex DNA.21,22 Zhang et al. have been synthesized and characterized the complex [Ru(phen)2(p-tFMPIP)](ClO4)2 {p-tFMPIP = 2-(4-(trifluoromethyphenyl)-1H-imidazo[4,5f][1,10]phenanthroline)} to stabilize the c-Myc G-quadruplex DNA and showed the growth inhibition in MDA-MB-231 cells through apoptosis pathway.18 Li et al. reported a series of aryl alkyne modified complex [Ru(phen)2(p-tFMPIP)](ClO4)2 {p-tFMPIP = 2-(4-(trifluoromethyphenyl)-1H-imidazo[4,5f][1,10]phenanthroline)} as a groove binder of c-Myc G-quadruplex DNA which can also act as a potential luminescent switch-on probe through selectively recognizing and promoting self-assembly of c-Myc G-quadruplex DNA.21 Wu et al. demonstrated that a series of arene ruthenium(II) complexes [(η6-C6H6)Ru(p-XPIP)Cl]Cl (X = H; F; Cl; Br; and I) {PIP = 2-phenylimidazole[4,5f][1,10]phenanthroline)} which were binding and stabilizing c-Myc G-quadruplex DNA and exhibit excellent inhibitory activity against MDA-MB-231 breast cancer cells.23 Recently, bioactive compound L755507 was reported as novel inhibitor blocks c-Myc–MAX heterodimerization and induces apoptosis in cancer cells.24 Despite the progress in the discovery of new G-quadruplex-interactive ligands, important questions remain regarding the ligand-binding specificity in the c-Myc G-quadruplex. To date, no small molecule inhibitors that directly target the c-Myc interaction have progressed to clinical trials except few report.25 This is due to less target selectivity, rapid metabolism and low potency.
We addressed this issue by using a designed peptide, QW10 (QQWQQQQWQQ), which may be possible to bind and stabilize c-Myc promoter G4 with high selectivity in cation specific manner. In the peptide, glutamine (Q) residues possibly may bind to the hydrogen bonding donor and acceptor sites with guanine bases followed by the intercalation of tryptophan residues. Based on the molecular design, it is possible to consider that binding modes of QW10 as hydrogen bonding and stacking interaction. In this study, we have used 22-mer studied c-Myc promoter G-quadruplex sequence and performed its interaction with designed peptide QW10. Biophysical studies such as circular dichroism, fluorescence spectroscopy, UV-thermal melting and biochemical studies Native Gel Electrophoresis were employed to investigate the binding mode of QW10 with c-Myc promoter G-quadruplex structure. Our results clearly showed that the peptide binds with c-Myc promoter G4 in cation specific manner and showed structural distinctiveness, binding with Hoogsteen bonded G-quadruplex, destabilizing the Watson–Crick hydrogen bonded DNA duplex and not binding with i-motif structure. This unique design of peptide makes the peptide structure specific and cation selective G4 targeting ligand which may open the new ways for selecting the peptide as a unique drug molecule in future for cancer patients. Furthermore, in vitro studies were also employed to understand the cytotoxic effects of QW10 and its subcellular localization showing its potential to down-regulate c-Myc expression in human breast carcinoma cells and found to be non-toxic to human embryonic kidney cells. Hence, the present binding studies for the first time reveal important hints on the relationship between the structure and the selective binding of the peptide as next-generation G-4 targeting natural ligands for potential therapeutic treatment of cancer.
2 Materials and methods
2.1 DNA and peptide
PAGE purified grade DNA oligonucleotide and HPLC purified peptide [QQWQQQQWQQ] was purchased from Helix Biosciences. The concentration of the peptide was determined by measuring the absorbance of Trp at the C-terminal at 280 nm at 25 °C. Single-strand concentrations of DNA oligonucleotides were determined by measuring the absorbance at 260 nm at a high temperature using a Shimadzu 1800 Spectrophotometer (Shimadzu, Tokyo, Japan) connected to a thermoprogrammer. Single-strand extinction coefficients were calculated from mononucleotide and dinucleotide data using the nearest-neighbour approximation.26,272.2 Circular dichroism spectroscopy
CD spectra were carried out on JASCO-715 spectropolarimeter using a quartz cuvette of 1 cm path length. All the spectra were recorded in the range of 200–350 nm wavelengths at a scanning rate of 100 nm min−1. Before measurement, the samples were heated to 95 °C in water bath and slowly cooled till water attains room temperature and incubated at 4 °C overnight to avoid any non-equilibrium structures. Average scans of the DNA samples were subtracted from the buffer scan and data was normalized as a function of DNA strand concentration and path length of the cuvette.2.3 Thermal melting analysis
UV absorbance of different samples were recorded with a Shimadzu 1800 spectrophotometer (Shimadzu, Tokyo, Japan) equipped with a temperature controller. Melting curves of DNA structures were obtained by measuring the UV absorbance at 260 nm or 295 nm in buffer pH 7.0 containing 0.5 mM EDTA, 100 mM NaCl, or 100 mM KCl, with and without 40 wt% PEG 400 or 20 wt% PEG 8000 in the presence or absence of QW10 peptide at DNA![[thin space (1/6-em)]](https://www.rsc.org/images/entities/char_2009.gif) :
:![[thin space (1/6-em)]](https://www.rsc.org/images/entities/char_2009.gif) peptide ratio (1
peptide ratio (1![[thin space (1/6-em)]](https://www.rsc.org/images/entities/char_2009.gif) :
:![[thin space (1/6-em)]](https://www.rsc.org/images/entities/char_2009.gif) 0), (1
0), (1![[thin space (1/6-em)]](https://www.rsc.org/images/entities/char_2009.gif) :
:![[thin space (1/6-em)]](https://www.rsc.org/images/entities/char_2009.gif) 1), (1
1), (1![[thin space (1/6-em)]](https://www.rsc.org/images/entities/char_2009.gif) :
:![[thin space (1/6-em)]](https://www.rsc.org/images/entities/char_2009.gif) 2), (1
2), (1![[thin space (1/6-em)]](https://www.rsc.org/images/entities/char_2009.gif) :
:![[thin space (1/6-em)]](https://www.rsc.org/images/entities/char_2009.gif) 5) and (1
5) and (1![[thin space (1/6-em)]](https://www.rsc.org/images/entities/char_2009.gif) :
:![[thin space (1/6-em)]](https://www.rsc.org/images/entities/char_2009.gif) 10). The Tm values for 4 μM DNA structures were obtained from the UV melting curves as described previously (ref). The heating rates were 0.5 °C min−1. Before measurement, the samples were heated to 95 °C in water bath and slowly cooled till water attains room temperature and incubated at 4 °C overnight to avoid any non-equilibrium structures. Experiment has been repeated in triplicates to reproduce the data.
10). The Tm values for 4 μM DNA structures were obtained from the UV melting curves as described previously (ref). The heating rates were 0.5 °C min−1. Before measurement, the samples were heated to 95 °C in water bath and slowly cooled till water attains room temperature and incubated at 4 °C overnight to avoid any non-equilibrium structures. Experiment has been repeated in triplicates to reproduce the data.
2.4 Native gel electrophoresis
For doing native gel experiment, 15% (w/v) polyacrylamide gel was used. Here in PAGE experiment, samples were prepared in 30 mM sodium cacodylate buffer (pH 7.4) containing 0.5 mM EDTA, 100 mM NaCl or 100 mM KCl, with and without 40 wt% PEG 200. The samples were heated to 95 °C in water bath and slowly cooled till water attains room temperature and incubated at 4 °C overnight. The running buffer TBE (pH 7.4) also contains the same concentration of salt and EDTA in gel as contained in oligonucleotide sample. Experiment was performed in cold room at constant 50 V. A 1![[thin space (1/6-em)]](https://www.rsc.org/images/entities/char_2009.gif) :
:![[thin space (1/6-em)]](https://www.rsc.org/images/entities/char_2009.gif) 1 mixture of glycerol and orange-G was used for tracking the movement of DNA oligonucleotides in the gel. Finally, gel was stained using silver staining and imaged using Gel-Doc (Biorad, Gurgaon, Haryana, India).
1 mixture of glycerol and orange-G was used for tracking the movement of DNA oligonucleotides in the gel. Finally, gel was stained using silver staining and imaged using Gel-Doc (Biorad, Gurgaon, Haryana, India).
2.5 Fluorescence measurements
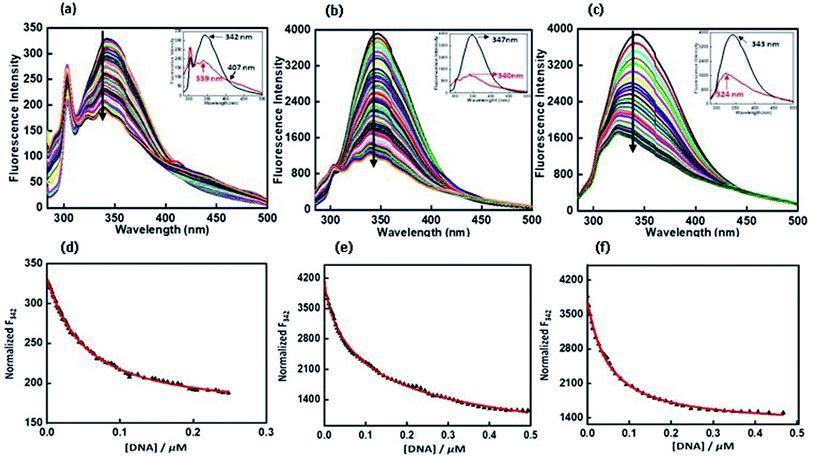
Fluorescence experiments were performed by utilizing a JASCO FP 8300 spectrofluorometer (JASCO, Tokyo, Japan). Experiments were carried out at 25 °C in 1 cm path-length quartz cuvette. Peptide 4 μM was taken in 30 mM buffer of pH 7.0 containing 100 mM NaCl or 100 mM KCl, 0.5 mM EDTA with and without 40 wt% PEG 200 titrated with equimolar concentration of c-Myc G-quadruplex. The temperature of the cell holder was regulated by a JASCO ETC-273T temperature controller. Samples were prepared by same procedure. Excitation and emission slit width were 5 nm each and the samples were excited at 275 nm and the emission was recorded in a range of 300 nm to 500 nm. Experiment has been repeated in triplicates to reproduce the data. The fluorescence intensity of QW10 was plotted at 342 nm, 347 nm and 343 nm against DNA concentration in the presence of K+ alone or with 40 wt% PEG 200 or 20 wt% PEG 8000.2.6 In vitro cytotoxic assay of peptide QW10
2.7 Gene expression of QW10 peptide using RT-PCR
We applied this qPCR to analyse the response of MDA-MB-231 cells towards QW10 peptides. QW10 peptide (100 μM) was dissolved in double distilled water to prepare its aqueous solution. MDA-MB-231 cells were grown at an exponential growth phase and subjected to QW10 treatment at two different concentrations (5 μM and 10 μM) for 24 hours. Non-treated cells were maintained at the same conditions to compare the gene expression profile. For RNA isolation, the sample content was removed and the cells were washed with phosphate buffer saline (PBS, Gibco) followed by triazole washing. We have added chloroform and centrifuged at 12![[thin space (1/6-em)]](https://www.rsc.org/images/entities/char_2009.gif) 000 rcf at 4 °C for 15 min. The supernatant was aliquoted and added isopropanol and centrifuged at 12
000 rcf at 4 °C for 15 min. The supernatant was aliquoted and added isopropanol and centrifuged at 12![[thin space (1/6-em)]](https://www.rsc.org/images/entities/char_2009.gif) 000 rcf at 4 °C for 15 min. Supernatant was discarded, 70% ethanol was added and centrifuged at 7500 rcf at 4 °C for 5 min. Ethanol was removed and nuclease-free water was added to resuspend the RNA. The RNA concentration was quantified with Nanodrop (Multiskan) and RNA integrity was evaluated through 1.3% agarose gel electrophoresis. For cDNA isolation, for each sample, a master mix (5× buffer, 10 μM dNTPs, RNase inhibitor, revert aid, and random primers) was prepared. To prepare cDNA, each PCR well contains 1000 ng RNA, master mix, and nuclease-free water. A short spin was used followed by a PCR run for 1 hour 10 minutes.
000 rcf at 4 °C for 15 min. Supernatant was discarded, 70% ethanol was added and centrifuged at 7500 rcf at 4 °C for 5 min. Ethanol was removed and nuclease-free water was added to resuspend the RNA. The RNA concentration was quantified with Nanodrop (Multiskan) and RNA integrity was evaluated through 1.3% agarose gel electrophoresis. For cDNA isolation, for each sample, a master mix (5× buffer, 10 μM dNTPs, RNase inhibitor, revert aid, and random primers) was prepared. To prepare cDNA, each PCR well contains 1000 ng RNA, master mix, and nuclease-free water. A short spin was used followed by a PCR run for 1 hour 10 minutes.
qPCR was performed with applied biosystems step one plus real-time PCR system using a final volume reaction of 10 μL containing forward and reverse primer, 1× SYBR Green master mix, and cDNA. The following thermal profile was applied: 1 cycle at 95 °C for 10 min, 40 cycles at 95 °C for 10 s, 64 °C for 30 s and 72 °C for 15 s. Melting curve analysis was performed at ramping from 60 °C to 90 °C and rising by 0.5 °C every 2 s. Gene expression variations were analyzed in terms of fold induction concerning the untreated control cells by 2−ΔΔCT method. All experiments were conducted in triplicates.
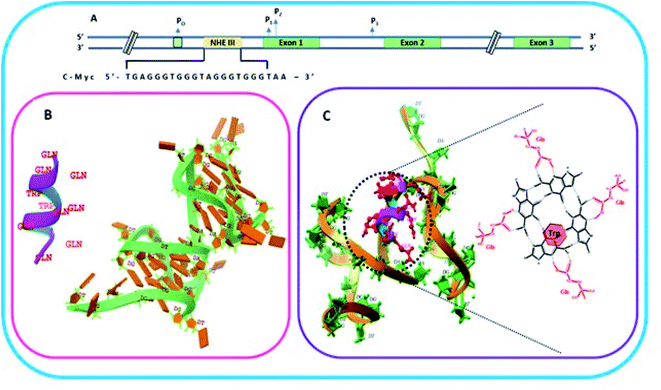 | ||
| Fig. 1 Schematic representation of c-Myc gene promoter structure. (A) Sequence that forms G quadruplex in the Nuclease Hypersensitivity Element III (NHE III1) located upstream of the Pl promoter. (B) Helical structure and molecular model of the peptide QW10 and c-MYC G4 (PDB I.D.: 6A1_41). (C) Molecular clocking of QW10 versus 6AU4 with representation of binding of glutamine with G base in G-quartet plane followed hy the interaction of tryptophan. | ||
![[thin space (1/6-em)]](https://www.rsc.org/images/entities/char_2009.gif) :
:![[thin space (1/6-em)]](https://www.rsc.org/images/entities/char_2009.gif) 0, 1
0, 1![[thin space (1/6-em)]](https://www.rsc.org/images/entities/char_2009.gif) :
:![[thin space (1/6-em)]](https://www.rsc.org/images/entities/char_2009.gif) 1, 1
1, 1![[thin space (1/6-em)]](https://www.rsc.org/images/entities/char_2009.gif) :
:![[thin space (1/6-em)]](https://www.rsc.org/images/entities/char_2009.gif) 2, 1
2, 1![[thin space (1/6-em)]](https://www.rsc.org/images/entities/char_2009.gif) :
:![[thin space (1/6-em)]](https://www.rsc.org/images/entities/char_2009.gif) 5 and 1
5 and 1![[thin space (1/6-em)]](https://www.rsc.org/images/entities/char_2009.gif) :
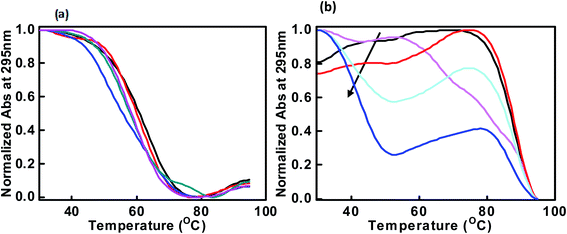
:![[thin space (1/6-em)]](https://www.rsc.org/images/entities/char_2009.gif) 10) respectively (Fig. 3a). The melting temperature (Tm) was evaluated by a curve fitting procedure as described previously.27 The melting curves with a single transition were obtained in all conditions. The Tm of the c-Myc promoter G4 was decreased initially from 63.1 °C, 61.1 °C, 51.1 °C, with the DNA peptide ratio of (1
10) respectively (Fig. 3a). The melting temperature (Tm) was evaluated by a curve fitting procedure as described previously.27 The melting curves with a single transition were obtained in all conditions. The Tm of the c-Myc promoter G4 was decreased initially from 63.1 °C, 61.1 °C, 51.1 °C, with the DNA peptide ratio of (1![[thin space (1/6-em)]](https://www.rsc.org/images/entities/char_2009.gif) :
:![[thin space (1/6-em)]](https://www.rsc.org/images/entities/char_2009.gif) 0, 1
0, 1![[thin space (1/6-em)]](https://www.rsc.org/images/entities/char_2009.gif) :
:![[thin space (1/6-em)]](https://www.rsc.org/images/entities/char_2009.gif) 1, 1
1, 1![[thin space (1/6-em)]](https://www.rsc.org/images/entities/char_2009.gif) :
:![[thin space (1/6-em)]](https://www.rsc.org/images/entities/char_2009.gif) 2) and increased further to 57.1 °C, 58.1 °C at (1
2) and increased further to 57.1 °C, 58.1 °C at (1![[thin space (1/6-em)]](https://www.rsc.org/images/entities/char_2009.gif) :
:![[thin space (1/6-em)]](https://www.rsc.org/images/entities/char_2009.gif) 5 and 1
5 and 1![[thin space (1/6-em)]](https://www.rsc.org/images/entities/char_2009.gif) :
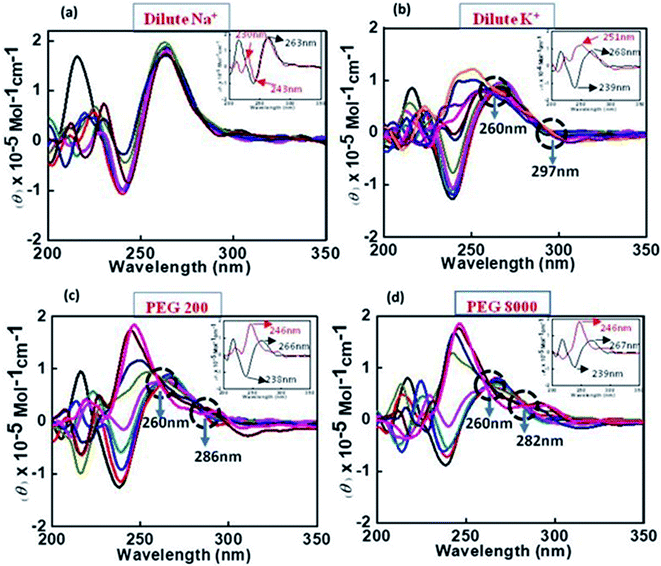
:![[thin space (1/6-em)]](https://www.rsc.org/images/entities/char_2009.gif) 10) respectively. These results indicated that peptide did not bind significantly with c-Myc promoter G4 structure in the presence of Na+. These results are consistent with our CD results showing the signatures of parallel G-quadruplex in control with slight decrease in CD intensity on increasing the peptide concentration in the presence of Na+ as shown above (Fig. 2a).
10) respectively. These results indicated that peptide did not bind significantly with c-Myc promoter G4 structure in the presence of Na+. These results are consistent with our CD results showing the signatures of parallel G-quadruplex in control with slight decrease in CD intensity on increasing the peptide concentration in the presence of Na+ as shown above (Fig. 2a).
On the contrary, we obtained a well resolved biphasic melting curve in the buffer containing KCl in the absence and presence of QW10. We proposed that the lower transition (Tm1) at 48.0 °C is due to the melting of biomolecular structure while the upper transition (Tm2) at 88.1 °C is due to the melting of unimolecular G-quadruplex structure. Next, melting profiles were recorded with DNA: peptide ratio as (1![[thin space (1/6-em)]](https://www.rsc.org/images/entities/char_2009.gif) :
:![[thin space (1/6-em)]](https://www.rsc.org/images/entities/char_2009.gif) 1, 1
1, 1![[thin space (1/6-em)]](https://www.rsc.org/images/entities/char_2009.gif) :
:![[thin space (1/6-em)]](https://www.rsc.org/images/entities/char_2009.gif) 2, 1
2, 1![[thin space (1/6-em)]](https://www.rsc.org/images/entities/char_2009.gif) :
:![[thin space (1/6-em)]](https://www.rsc.org/images/entities/char_2009.gif) 5, 1
5, 1![[thin space (1/6-em)]](https://www.rsc.org/images/entities/char_2009.gif) :
:![[thin space (1/6-em)]](https://www.rsc.org/images/entities/char_2009.gif) 10 and 1
10 and 1![[thin space (1/6-em)]](https://www.rsc.org/images/entities/char_2009.gif) :
:![[thin space (1/6-em)]](https://www.rsc.org/images/entities/char_2009.gif) 20). The Tm of lower transition (Tm1) decreased gradually from 48.1 °C, 48.0 °C, 42.0 °C, 39.1 °C and 37.1 °C while the Tm of upper transition (Tm2) was increased from 87.1 °C, 81.1 °C, 88.1 °C, 88.7 °C and 90.1 °C respectively (Fig. 3b). Therefore, the decrease in Tm1 value is due to the melting of unimolecular G-quadruplex structure which is distinct from G-quadruplex–peptide complex and increase in Tm of upper transition is due to G-quadruplex–peptide complex. This might be possible that peptide binding unwinded the G-quadruplex initially and again reformed the G-quadruplex–peptide complex with new topology. This possibility will be further explored by native gel electrophoresis data in the following section. Next, we have recorded the thermal melting profile of c-Myc promoter G4 in the presence of K+ and cell mimicking molecular crowding conditions. The Tm of the control with DNA
20). The Tm of lower transition (Tm1) decreased gradually from 48.1 °C, 48.0 °C, 42.0 °C, 39.1 °C and 37.1 °C while the Tm of upper transition (Tm2) was increased from 87.1 °C, 81.1 °C, 88.1 °C, 88.7 °C and 90.1 °C respectively (Fig. 3b). Therefore, the decrease in Tm1 value is due to the melting of unimolecular G-quadruplex structure which is distinct from G-quadruplex–peptide complex and increase in Tm of upper transition is due to G-quadruplex–peptide complex. This might be possible that peptide binding unwinded the G-quadruplex initially and again reformed the G-quadruplex–peptide complex with new topology. This possibility will be further explored by native gel electrophoresis data in the following section. Next, we have recorded the thermal melting profile of c-Myc promoter G4 in the presence of K+ and cell mimicking molecular crowding conditions. The Tm of the control with DNA![[thin space (1/6-em)]](https://www.rsc.org/images/entities/char_2009.gif) :
:![[thin space (1/6-em)]](https://www.rsc.org/images/entities/char_2009.gif) peptide ratio as (1
peptide ratio as (1![[thin space (1/6-em)]](https://www.rsc.org/images/entities/char_2009.gif) :
:![[thin space (1/6-em)]](https://www.rsc.org/images/entities/char_2009.gif) 0) was 91.6 °C and 91.8 °C in the presence of 100 mM K+ and 40 wt% PEG 200 or 20 wt% PEG 8000 (Fig. S1a and b†) respectively. There was relatively 3 °C and 1 °C change with (DNA
0) was 91.6 °C and 91.8 °C in the presence of 100 mM K+ and 40 wt% PEG 200 or 20 wt% PEG 8000 (Fig. S1a and b†) respectively. There was relatively 3 °C and 1 °C change with (DNA![[thin space (1/6-em)]](https://www.rsc.org/images/entities/char_2009.gif) :
:![[thin space (1/6-em)]](https://www.rsc.org/images/entities/char_2009.gif) peptide ratio of 1
peptide ratio of 1![[thin space (1/6-em)]](https://www.rsc.org/images/entities/char_2009.gif) :
:![[thin space (1/6-em)]](https://www.rsc.org/images/entities/char_2009.gif) 1) under both molecular crowding conditions. Interestingly, c-Myc promoter G4 was completely adopted new conformation on further increasing the QW10 concentration and it was not possible to evaluate the Tm values (Fig. S1a and b†). These Tm results were in good agreement with those obtained by CD measurements (Fig. 2c and d).
1) under both molecular crowding conditions. Interestingly, c-Myc promoter G4 was completely adopted new conformation on further increasing the QW10 concentration and it was not possible to evaluate the Tm values (Fig. S1a and b†). These Tm results were in good agreement with those obtained by CD measurements (Fig. 2c and d).
![[thin space (1/6-em)]](https://www.rsc.org/images/entities/char_2009.gif) :
:![[thin space (1/6-em)]](https://www.rsc.org/images/entities/char_2009.gif) QW10 were in the ratio of (1
QW10 were in the ratio of (1![[thin space (1/6-em)]](https://www.rsc.org/images/entities/char_2009.gif) :
:![[thin space (1/6-em)]](https://www.rsc.org/images/entities/char_2009.gif) 1) (lane 3), (1
1) (lane 3), (1![[thin space (1/6-em)]](https://www.rsc.org/images/entities/char_2009.gif) :
:![[thin space (1/6-em)]](https://www.rsc.org/images/entities/char_2009.gif) 2) (lane 4), (1
2) (lane 4), (1![[thin space (1/6-em)]](https://www.rsc.org/images/entities/char_2009.gif) :
:![[thin space (1/6-em)]](https://www.rsc.org/images/entities/char_2009.gif) 5) (lane 5), and (1
5) (lane 5), and (1![[thin space (1/6-em)]](https://www.rsc.org/images/entities/char_2009.gif) :
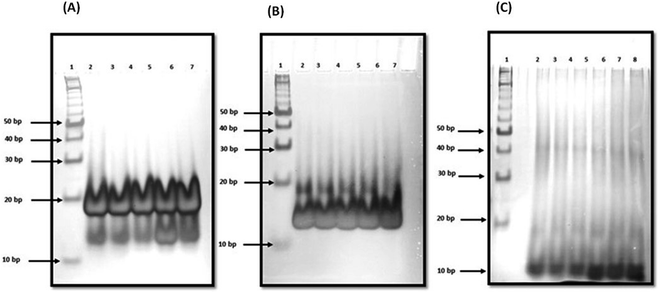
:![[thin space (1/6-em)]](https://www.rsc.org/images/entities/char_2009.gif) 10) (lane 6) respectively. We observed two bands between 10 to 20 bp on comparing with 10 bp band in all four lanes (lane 3 to lane 6). There was no change in band intensity of upper band while band intensity of lower band increased in lane 5 and lane 6 on increasing the peptide concentration. These gel results suggested that peptide is binding with unimolecular structure in the presence of Na+. Next, we have checked the structural state of c-Myc promoter G4 in the presence of K+ with and without QW10. The lane 2 of Fig. 4b displayed again the two bands which migrated equivalent to 10 or 20 base pairs. Here, the major band corresponded to unimolecular G-quadruplex structure and minor band to bimolecular structure. On increasing the peptide concentration, there was continuous decrease in band intensity of minor upper band in lane 3 to lane 5 and this band completely disappeared in lane 6. In addition, the band intensity of the lower band increased again which showed the preference of peptide binding to unimolecular structure. These results are consistent with our CD results obtained on titrating the c-Myc G4 with an increasing concentration of QW10. Presence of major blue shift of 20 nm in positive peak and isodichoric point at 260 nm confirmed the binding of peptide with parallel G 4 structure (Fig. 2b). We have also checked the structural state of c-Myc promoter G4 in the presence of K+ and 40 wt% PEG 200 with and without QW10 (Fig. 4c). Three bands were observed, out of which two bands migrated equivalent to 10 to 20 bp while the third band migrated equivalent to 40 bp. The parallel topology was shown to be favoured in solutions containing molecular crowding conditions. On increasing the peptide concentration from lane 3 to lane 6, there was no change in band intensity of upper band while the band intensity of middle and lower band increased. This observation leads to the possibility of the preference of peptide binding with bimolecular and unimolecular topology under molecular crowding conditions. We have also performed one control experiment to see the changes in W.C bonded DNA duplex and C-tetraplex (i-motif) upon QW10 binding in 100 mM KCl, (pH 7.0 and pH 5.7) respectively (Fig. S2†). Duplex was prepared by mixing human telomere G-rich and C-rich strand in (1
10) (lane 6) respectively. We observed two bands between 10 to 20 bp on comparing with 10 bp band in all four lanes (lane 3 to lane 6). There was no change in band intensity of upper band while band intensity of lower band increased in lane 5 and lane 6 on increasing the peptide concentration. These gel results suggested that peptide is binding with unimolecular structure in the presence of Na+. Next, we have checked the structural state of c-Myc promoter G4 in the presence of K+ with and without QW10. The lane 2 of Fig. 4b displayed again the two bands which migrated equivalent to 10 or 20 base pairs. Here, the major band corresponded to unimolecular G-quadruplex structure and minor band to bimolecular structure. On increasing the peptide concentration, there was continuous decrease in band intensity of minor upper band in lane 3 to lane 5 and this band completely disappeared in lane 6. In addition, the band intensity of the lower band increased again which showed the preference of peptide binding to unimolecular structure. These results are consistent with our CD results obtained on titrating the c-Myc G4 with an increasing concentration of QW10. Presence of major blue shift of 20 nm in positive peak and isodichoric point at 260 nm confirmed the binding of peptide with parallel G 4 structure (Fig. 2b). We have also checked the structural state of c-Myc promoter G4 in the presence of K+ and 40 wt% PEG 200 with and without QW10 (Fig. 4c). Three bands were observed, out of which two bands migrated equivalent to 10 to 20 bp while the third band migrated equivalent to 40 bp. The parallel topology was shown to be favoured in solutions containing molecular crowding conditions. On increasing the peptide concentration from lane 3 to lane 6, there was no change in band intensity of upper band while the band intensity of middle and lower band increased. This observation leads to the possibility of the preference of peptide binding with bimolecular and unimolecular topology under molecular crowding conditions. We have also performed one control experiment to see the changes in W.C bonded DNA duplex and C-tetraplex (i-motif) upon QW10 binding in 100 mM KCl, (pH 7.0 and pH 5.7) respectively (Fig. S2†). Duplex was prepared by mixing human telomere G-rich and C-rich strand in (1![[thin space (1/6-em)]](https://www.rsc.org/images/entities/char_2009.gif) :
:![[thin space (1/6-em)]](https://www.rsc.org/images/entities/char_2009.gif) 1) ratio at (pH 7.0) (lane 2) and C-tetraplex was prepared by taking human telomeric C-rich strand at pH (5.7) (lane 4) alone or with QW10 in DNA
1) ratio at (pH 7.0) (lane 2) and C-tetraplex was prepared by taking human telomeric C-rich strand at pH (5.7) (lane 4) alone or with QW10 in DNA![[thin space (1/6-em)]](https://www.rsc.org/images/entities/char_2009.gif) :
:![[thin space (1/6-em)]](https://www.rsc.org/images/entities/char_2009.gif) peptide (1
peptide (1![[thin space (1/6-em)]](https://www.rsc.org/images/entities/char_2009.gif) :
:![[thin space (1/6-em)]](https://www.rsc.org/images/entities/char_2009.gif) 10) ratio (lane 3 and lane 5) respectively. We observed one band migrated between 20 and 30 bp (lane 2) corresponded to the formation of DNA duplex. Interestingly, after addition of peptide in 1
10) ratio (lane 3 and lane 5) respectively. We observed one band migrated between 20 and 30 bp (lane 2) corresponded to the formation of DNA duplex. Interestingly, after addition of peptide in 1![[thin space (1/6-em)]](https://www.rsc.org/images/entities/char_2009.gif) :
:![[thin space (1/6-em)]](https://www.rsc.org/images/entities/char_2009.gif) 10 ratio, we observed two bands, upper band between 20 and 30 bp and lower band at 10 bp which clearly indicated that W.C duplex was destabilized upon peptide binding. We observed single band migrated between 10 bp and 20 bp in lane 4 (pyrimidine rich DNA) and lane 5 pyrimidine rich DNA
10 ratio, we observed two bands, upper band between 20 and 30 bp and lower band at 10 bp which clearly indicated that W.C duplex was destabilized upon peptide binding. We observed single band migrated between 10 bp and 20 bp in lane 4 (pyrimidine rich DNA) and lane 5 pyrimidine rich DNA![[thin space (1/6-em)]](https://www.rsc.org/images/entities/char_2009.gif) :
:![[thin space (1/6-em)]](https://www.rsc.org/images/entities/char_2009.gif) peptide (1
peptide (1![[thin space (1/6-em)]](https://www.rsc.org/images/entities/char_2009.gif) :
:![[thin space (1/6-em)]](https://www.rsc.org/images/entities/char_2009.gif) 10) ratio. These results indicated that human telomeric c-rich strand folded into bimolecular i-motif structure and there was no change in mobility upon peptide addition which confirmed that peptide is not binding to C-tetraplex.
10) ratio. These results indicated that human telomeric c-rich strand folded into bimolecular i-motif structure and there was no change in mobility upon peptide addition which confirmed that peptide is not binding to C-tetraplex.
To check the effect of QW10 peptide on Watson–Crick base-pairing as well as on i-motif structure, we have also prepared the Watson–Crick base paired duplex (5′-GGGTTAGGGTTAGGGTTAGGGTTA-3′) purine strand and (5′-TAACCCTAACCCTAACCCTAACCC-3′) by mixing purine and pyrimidine rich strand in 1![[thin space (1/6-em)]](https://www.rsc.org/images/entities/char_2009.gif) :
:![[thin space (1/6-em)]](https://www.rsc.org/images/entities/char_2009.gif) 1 ratio at neutral pH (Fig. S3a†) and i-motif structure using pyrimidine rich single strand (5′-TAACCCTAACCCTAACCCTAACCC-3′) at acidic pH (5.7). We have also recorded its fluorescence with and without peptide (Fig. S3c†). There was decrease in fluorescence intensity with Kb value as 1.30 ± 0.7 μM (Fig. S3b†) and 17.74 ± 0.8 μM (Fig. S3d†) respectively. So, overall fluorescence results indicated the preference of peptide binding with Hoogsteen bonded G-quadruplex structure rather than Watson–Crick hydrogen bonded and i-motif structure.
1 ratio at neutral pH (Fig. S3a†) and i-motif structure using pyrimidine rich single strand (5′-TAACCCTAACCCTAACCCTAACCC-3′) at acidic pH (5.7). We have also recorded its fluorescence with and without peptide (Fig. S3c†). There was decrease in fluorescence intensity with Kb value as 1.30 ± 0.7 μM (Fig. S3b†) and 17.74 ± 0.8 μM (Fig. S3d†) respectively. So, overall fluorescence results indicated the preference of peptide binding with Hoogsteen bonded G-quadruplex structure rather than Watson–Crick hydrogen bonded and i-motif structure.
3 Conclusion
We report the interaction of designed peptide as the basis of a novel class of c-Myc G4 binder that exhibits highly specific potential for stabilizing the potassium form of c-Myc G4 over the analogous sodium form. The proposed mechanisms for the binding of the QW10 peptide to c-Myc G4 was the hydrogen bonding with the G-base of G-quadruplex and the side chain of the glutamine followed by the intercalation of tryptophan in G-quartet plane. We observed the significant changes in CD spectra on titrating the c-Myc G4 with QW10 peptide with 20 nm blue shift along with two distinct isodichoric points. These CD changes in molar ellipticity clearly indicate that peptide is binding to the c-Myc G4. Changes in molar ellipticity were observed in the presence of both monovalent ions used during studies in sodium or potassium formed G-quadruplex indicating that the binding of peptide is conformation specific. As the structure of c-Myc G4 is different in K+ and Na+, therefore, peptide recognizes and binds to these structures differently. We observed destabilization of dimeric structure and stabilization to unimolecular G-quadruplex structure on peptide binding in the presence of K+ in comparison to Na+. This is further confirmed by the presence of higher molecular weight G-quadruplex–peptide complexes observed in Native PAGE data. Fluorescence data also supported the binding of QW10 peptide with c-Myc G4 with Kb values 0.05 ± 0.2 μM, 0.12 ± 0.1 μM and 0.05 ± 0.3 μM in the presence of K+ alone or with 40 wt% PEG 200 or 20 wt% PEG 8000. as discussed above. The cellular cytotoxicity results of QW10 peptide against breast cancer cell lines was also evaluated and IC50 values were 11.10 μM and 6.44 μM after 72 and 96 hours respectively. Further, we found that the binding of QW10 with c-Myc promoter G4 could down-regulate the transcription of oncogene c-Myc by 2.5 fold in human breast cancer cell lines. Based on CD, UV-thermal melting, native PAGE and fluorescence and cellular studies, we conclude that the peptide has potential application in the exploration of anticancer drugs for the recognition of c-Myc G4 and offers a new approach for anti-cancer therapy by G-quadruplex mediated inhibition of c-Myc expression. Work to investigate the exact structure of new topology of c-Myc promoter G4peptide complex and its thermodynamics is under progress in our laboratory.Funding
We thank “Department of Biotechnology (DBT)”, Govt of India for research funding to this project (SAN No. 102/IFD/SAN/864/2018-2019).Conflicts of interest
The authors declare no competing financial interest.Acknowledgements
The timely help from Prof. Shrikant Kukreti and Dr Anju Singh of Nucleic Acid Research Laboratory, Delhi University is greatly acknowledged.References
- J. L. Huppert and S. Balasubramanian, Prevalence of quadruplexes in the human genome, Nucleic Acids Res., 2005, 33, 2908–2916 CrossRef CAS PubMed.
- A. K. Todd, M. Johnston and S. Neidle, Highly prevalent putative quadruplex sequence motifs in human DNA., Nucleic Acids Res., 2005, 24, 2901–2907 CrossRef PubMed.
- J. A. Siddiqui, C. L. Grand, D. J. Bearss and L. H. Hurley, Direct evidence for a G-quadruplex in a promoter region and its targeting with a small molecule to repress c-MYC transcription, Proc. Natl. Acad. Sci. U. S. A., 2002, 99, 11593–11598 CrossRef PubMed.
- H. Fernando, A. P. Reszka, J. Huppert, S. Ladame, S. Rankin and A. R. Venkitaraman, et al., A Conserved Quadruplex Motif Located in a Transcription Activation Site of the Human c-kit Oncogene, Biochemistry, 2006, 45, 7854–7860 CrossRef CAS PubMed.
- S. Rankin, A. P. Reszka, J. Huppert, M. Zloh, G. N. Parkinson and A. K. Todd, et al., Putative DNA Quadruplex Formation within the Human c-kit Oncogene, J. Am. Chem. Soc., 2005, 127, 10584–10589 CrossRef CAS PubMed.
- T. S. Dexheimer, D. Sun and L. H. Hurley, Deconvoluting the Structural and Drug-Recognition Complexity of the G-Quadruplex-Forming Region Upstream of the bcl-2 P1 Promoter, J. Am. Chem. Soc., 2006, 128, 5404–5415 CrossRef CAS PubMed.
- P. Agrawal, C. Lin, R. I. Mathad, M. Carver and D. Yang, The Major G-Quadruplex Formed in the Human BCL-2 Proximal Promoter Adopts a Parallel Structure with a 13-nt Loop in K+ Solution, J. Am. Chem. Soc., 2014, 136, 1750–1753 CrossRef CAS PubMed.
- D. Sun, K. Guo, J. J. Rusche and L. H. Hurley, Facilitation of a structural transition in the polypurine/polypyrimidine tract within the proximal promoter region of the human VEGF gene by the presence of potassium and G-quadruplex-interactive agents, Nucleic Acids Res., 2005, 33, 6070–6080 CrossRef CAS PubMed.
- D. R. Armond, S. Wood, D. Sun, L. H. Hurley and S. W. Ebbinghaus, Evidence for the Presence of a Guanine Quadruplex Forming Region within a Polypurine Tract of the Hypoxia Inducible Factor 1α Promoter, Biochemistry, 2005, 44, 16341–16350 CrossRef PubMed.
- S. K. Madden, D. A. Aline, G. Mara, P. F. David and M. M. Jody, Taking the Myc out of cancer: toward therapeutic strategies to directly inhibit c-Myc, Mol. Cancer, 2021, 20, 1–3 CrossRef PubMed.
- A. Local, H. Zhang, K. D. Benbatoul, P. Folger, X. Sheng, C. Y. Tsai, S. B. Howell and W. G. Rice, APTO-253 stabilizes G-quadruplex DNA, inhibits MYC expression, and induces DNA damage in acute myeloid leukemia cells, Mol. Cancer Ther., 2018, 17, 1177–1186 CrossRef CAS PubMed.
- K. B. Marcu, S. A. Bossone and A. J. Patel, c-Myc function and regulation, Annu. Rev. Biochem., 1992, 61, 809–860 CrossRef CAS PubMed.
- J. A. Siddiqui, C. L. Grand, D. J. Bearss and L. H. Hurley, Direct evidence for a G-quadruplex in a promoter region and its targeting with a small molecule to repress c-MYC transcription, Proc. Natl. Acad. Sci. U. S. A., 2002, 99, 11593–11598 CrossRef PubMed.
- G. Ghosal and K. Muniyappa, Hoogsteen base-pairing revisited: resolving a role in normal biological processes and human diseases, Biochem. Biophys. Res. Commun., 2006, 343, 1–7 CrossRef CAS PubMed.
- D. Yang and K. Okamoto, Structural insights into G-quadruplexes: towards new anticancer drugs, Fut. Med. Chem., 2010, 2, 619–646 CrossRef CAS PubMed.
- S. Asamitsu, S. Obata, Z. Yu, T. Bando and H. Sugiyama, Recent progress of targeted G-quadruplex-preferred ligands toward cancer therapy, Molecules, 2019, 24, 429–432 CrossRef PubMed.
- D. Yang and L. Hurley, Structure of the biologically relevant G-quadruplex in the c-MYC promoter, Nucleosides Nucleotides, Nucleic Acids Res., 2006, 25, 951–968 CrossRef CAS PubMed.
- Y. Chen and D. Yang, Sequence, stability, and structure of G-quadruplexes and their interactions with drugs, Curr. Protoc. Nucleic Acid Chem., 2012, 5, 1–17 Search PubMed.
- T. M. Ou, Y. J. Lu, C. Zhang, Z. S. Huang, X. D. Wang, J. H. Tan, Y. Chen, D. L. Ma, K. Y. Wong and J. C. Tang, et al., Stabilization of G-Quadruplex DNA and Down-Regulation of Oncogene c – Myc by Quindoline Derivatives, J. Med. Chem., 2007, 50, 1465–1474 CrossRef CAS PubMed.
- T. M. Ou, J. Lin, Y. J. Lu, J. Q. Hou, J. H. Tan, S. H. Chen, Z. Li, Y. P. Li, D. Li and L. Q. Gu, et al., Inhibition of Cell Proliferation by Quindoline Derivative (SYUIQ-05) through Its Preferential Interaction with c – Myc Promoter G-Quadruplex, J. Med. Chem., 2011, 54, 5671–5679 CrossRef CAS PubMed.
- J. Dickerhoff, D. Jixun and Y. Danzhou, Structural recognition of the MYC promoter G-quadruplex by a quinoline derivative: insights into molecular targeting of parallel G-quadruplexes, Nucleic Acids Res., 2021, 49, 5905–5915 CrossRef CAS PubMed.
- L. Li, H. M. Liu, X. K. Liu, S. Y. Liao, Y. T. Lan, Q. Wu, X. C. Wang, S. Y. Wang and W. J. Zhang, Induction of c-Myc G-Quadruplex DNA and Cytotoxicity of a Calix Arene-Containing Binuclear Ruthenium(Li) Complex, RSC Adv., 2017, 64, 23727–23734 RSC.
- Q. Wu, K. D. Zheng, S. Y. Liao, Y. Ding, Y. Q. Li and W. J. Mei, Microwave-Assisted Synthesis of Arene Ru(II) Complexes Induce Tumor Cell Apoptosis Through Selectively Binding and Stabilizing bcl-2 G-Quadruplex DNA, Organometallics, 2016, 35, 317–326 CrossRef CAS.
- A. Singh, A. Kumar, P. Kumar, P. Nayak, T. Bhardwaj, R. Giri and N. Garg, A novel inhibitor L755507 efficiently blocks c-Myc–MAX heterodimerization and induces apoptosis in cancer cells, J. Biol. Chem., 2021, 297, 100903–100914 CrossRef CAS PubMed.
- R. Jonathan and L. Whitfield, The long journey to bring a Myc inhibitor to the clinic, J. Cell Biol., 2021, 220, 3090–3098 Search PubMed.
- D. Miyoshi, H. Karimata and N. Sugimoto, Hydration Regulates Thermodynamics of G-Quadruplex Formation under Molecular Crowding Conditions, J. Am. Chem. Soc., 2006, 128, 7957–7963 CrossRef CAS PubMed.
- N. Sugimoto, S. Nakano, S. Kotah, A. Matsumura, H. Nakamuta, T. Ohmichi, M. Yoneyama and M. Sasaki, Thermodynamic parameters to predict stability of RNA/DNA hybrid duplexes, Biochemistry, 1995, 34, 11211–11216 CrossRef CAS PubMed.
- S. Nakano, T. Kanzaki and N. Sugimoto, Influences of ribonucleotide on a duplex conformation and its thermal stability: study with the chimeric RNA-DNA strands, J. Am. Chem. Soc., 2004, 126, 1088–1095 CrossRef CAS PubMed.
- M. Trajkovski, T. Endoh, H. T. Karimata, T. Ohyama, S. Tanaka, J. Plavec and N. Sugimoto, Pursuing origins of (poly)ethylene glycol-induced G-quadruplex structural modulations, Nucleic Acids Res., 2018, 8, 4301–4315 CrossRef PubMed.
- M. L. Bochman, K. Paeschke and V. A. Zakian, DNA secondary structures: stability and function of G-quadruplex structures, Nat. Rev. Genet., 2012, 13, 770–780 CrossRef CAS PubMed.
- S. Tyagi, S. Saxena, N. Kundu, T. Sharma, A. Chakraborty, S. Kaur, D. Miyoshi and J. Shankaraswamy, Selective recognition of human telomeric G-quadruplex with designed peptide via hydrogen bonding followed by base stacking interactions, RSC Adv., 2019, 69, 40255–40262 RSC.
- T. Simonsson and M. Henriksson, c-Myc Suppression in Burkitt's Lymphoma Cells, Biochem. Biophys. Res. Commun., 2002, 290, 11–15 CrossRef CAS PubMed.
Footnotes |
| † Electronic supplementary information (ESI) available. See DOI: 10.1039/d2ra00535b |
| ‡ Nikita Kundu, Taniya Sharma, and Sarvpreet Kaur share equal contribution. |
| This journal is © The Royal Society of Chemistry 2022 |

