
 Open Access Article
 This Open Access Article is licensed under a Creative Commons Attribution-Non Commercial 3.0 Unported Licence
Investigation of optical and electrical properties of the semiconducting α-KZnPO4 compound
N. Chakchouk ,
Kh. Ben Brahim,
M. Ben Gzaiel and
A. Oueslati
,
Kh. Ben Brahim,
M. Ben Gzaiel and
A. Oueslati
U, niversity of Sfax, Laboratory of Spectroscopic Characterization and Optics of Materials, Faculty of Sciences, B. P. 1171, 3000, Sfax, Tunisia. E-mail: narimenchakchouk@yahoo.fr
First published on 1st March 2022
Abstract
We used the solid state method to synthesize the α-KZnPO4 compound. The X-ray diffraction pattern revealed that the sample represents a single hexagonal phase with a P63 space group. The chemical composition of the compound was examined by energy dispersive spectroscopy. The optical absorption measurement confirmed the semiconductor nature of the compound with a band gap around 4.52 eV. Furthermore, the electrical properties of the material were analyzed by means of the impedance spectroscopy, in a frequency range from 100 Hz to 1 MHz and a temperature range from 583 K to 673 K. The dependency of s(T) on temperature showed that the overlapping large polaron tunneling model is the mechanism responsible for AC conduction in the compound. A correlation between the crystal structure and the ionic conductivity was established and discussed. Finally, the temperature variation of M′′ peak showed a thermally activated relaxation process and a temperature-dependent stretching exponent β parameter.
1. Introduction
In the last few years, numerous research studies have emphasized phosphate-based materials, not only by understanding their characteristics but also by studying their different technological applications.1–3 A particular interest has been devoted to the orthophosphate materials with formula ABPO4 (A = Na, Li, Ag, K… and B = Zn, Fe, Ni, Co,…) thanks to their interesting properties, as well as their excellent thermal stability, hydrolytic stability and charge stabilization.4,5 Among them, we can mention the optical and ferroelectric properties.6,7 Moreover, researchers have put the light on the specific characteristic of the orthophosphate that comprehended a monovalent cation thanks to their significant ionic conductivity and potential value as solid electrolytes for rechargeable “alkaline batteries”.8–10 In addition the crystal structure diversity is a principal feature for this family of compounds that are controlled by the stereo-chemical behaviors of the A and B cations. Among the different structures, we are interested in the tridymite type materials that possess a strong correlation between structural, physical and electrochemical properties.11In this research paper, we are interested in the study of the KZnPO4. This compound undergoes two phase transitions at 691 °C and 783 °C where two allotropic forms can be distinguished which are the β-KZnPO4 (medium-temperature) and γ-KZnPO4 (high-temperature).12 The α-KZnPO4 compound has previously been reported to crystallize the hexagonal space group P63.12,13 The β-KZnPO4 structure is in the orthorhombic system with space group Pna21. As for the γ-KZnPO4 structure, it maintains the orthorhombic system only changing its space group to Pnma. The different structures of the compound display the properties of the stuffed tridymite family and have a tetrahedral skeleton. The α–β transition occurs by tetrahedral reversal while the β–γ transition is a displace phenomenon with a ferroelectric character. The topology of the α-KZnPO4 compound is in the UUUDDD-ring form (point up “U”, point down “D”) where these rings are formed by the PO4 and ZnO4 tetrahedra in an alternative way. These rings are occupied by the K+ cations.14–16
To our knowledge, no conductivity and vibrational behavior studies have been carried out for the studied compound. As a continuation to the previous structural study that have been reported and to further understand the physical properties of this compound, we have studied the structural, morphological and electrical properties. A correlation between the crystal structure and ionic conductivity has been established and discussed. In addition, the optical measurements by UV-vis absorption were performed.
2. Experimental methods
2.1 Synthesis procedure
The polycrystalline sample of α-KZnPO4 was prepared via the conventional solid-state reaction method by mixing high purity precursors of K2CO3 (99.9% purity), ZnO (99.9% purity) and (NH4)2HPO4 (99.9% purity) in the desired proportion according to the following reaction:| K2CO3 + 2ZnO + 2(NH4)2HPO4 → 2KZnPO4 + CO2 + 4NH3 + 3H2O | (1) |
In this context, the starting reagents were mixed and intimately ground in an agate mortar for 30 min to ensure the best homogeneity and reactivity. After that, the homogenized powder, was firstly calcined in an electric furnace at a temperature of 573 K for 8 h, in order to exhaust CO2, NH3, and H2O. Further, the calcined powder was grounded again for 8 h, and then pressed into cylindrical pellets, having a diameter of 7.78 mm, using a 2.94 × 10⁸ Pa uniaxial pressure to promote the reaction. Finally, the white pellets were sintered at 873 K for 20 h and then cooled slowly at a rate of 5 K min−1 at room temperature. It is noticed all stages occurring sequentially as the sintering temperature increases: a formation of isthmuses between grains, a compaction of grains, and finally, their growth.
2.2 Characterization techniques
The crystal phase and purity of the α-KZnPO4 compound were characterized by X-ray powder diffraction (XRD) using a Panalytical X'Pert Prompd diffractometer equipped with copper radiation CuKα (λ = 1.54060 Å) recorded at room temperature. The intensity data were recorded by continuous scan in 2θ/θ mode from 10° to 85° with a step Δ(2θ) = 0.017°. XRD was analyzed by the Rietveld method using the “FullProf’’ software.The chemical analysis of the sample shaped into pellets was carried out by EVO LS10 (Zeiss) scanning electron microscopy connected with the energy dispersive system: INCA (Oxford Instruments).
The optical spectrum of the investigated compound was carried out at room temperature using a UV-3101PC scanning spectrophotometer (Integrated Sphere) in the wavelength range 200–800 nm with a resolution of 0.5 nm.
Furthermore, the electrical measurements were performed on a sintered pellet having a typical dimension of 7.78 mm in diameter and 1.20 mm in thickness. The opposite sides of this pellet were coated with a conducting silver paint to ensure a high electrical contact. The transport properties of the sample were examined by AC impedance spectroscopy using an 1260 Solartron Impedance Analyzer under vacuum operating over a frequency range of 100 Hz to 1 MHz and at a temperature range of 583 K to 673 K with an AC voltage of 1 V.
3. Results and discussions
3.1 XRD analysis
To analyze the purity of the synthesized compound and obtain the crystalline parameters, an XRPD pattern collected at room temperature was carried out. The refinement of the pattern was performed by the Le Bail method using the fullProf program. The cell parameters and the P63 space group reported in the bibliographic date were used as a starting point.13Fig. 1 exposes the observed and calculated diffractograms for α-KZnPO4 as well as the corresponding discrepancies. All Bragg peaks were successfully indexed and satisfactorily modeled, thus proving the high purity of the sample. The quality factor which shows the good agreement between the experimental (red points) and calculated (black solid line) profiles is χ2 = 3.24. The profile parameters are a = 18.157(2) Å, b = 18.157(2) Å, c = 8.508(2) Å and V = 2429.552(4) Å3; Z = 24, are in good agreement with the results reported by Andratschke and et al.13 The absence of secondary phase and peaks of impurities confirms that we have produced a pure and good quality compound.
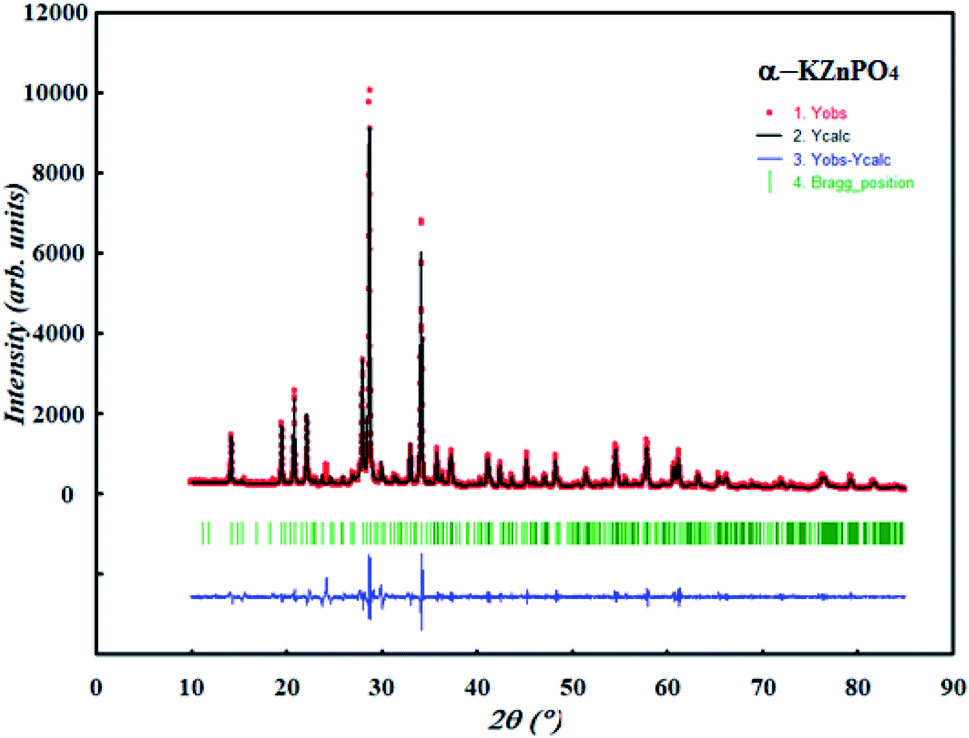 | ||
| Fig. 1 X-ray diffraction (XRD) of α-KZnPO4 at room temperature: experimental data in red, calculated data in black, difference between them in blue line is shown at the lowest of the diagram and the Bragg positions in green are marked by vertical bar. | ||
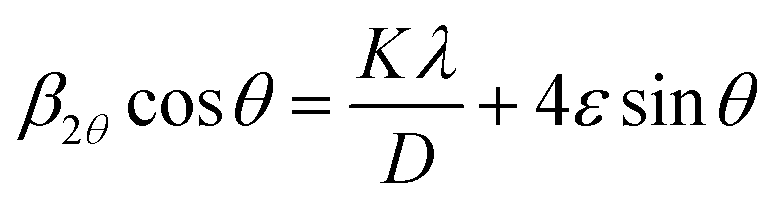
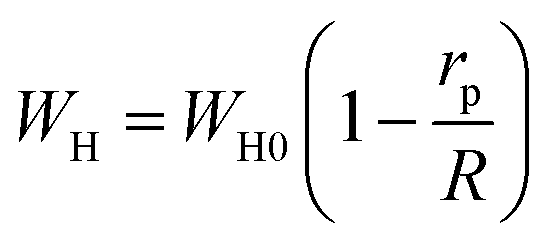
The average crystallite size D of the α-KZnPO4 was calculated by the X-ray peak broadening method using the Williamson–Hall technique (W–H) according to the following equation:17
 | (2) |
A linear plot of β![[thin space (1/6-em)]](https://www.rsc.org/images/entities/char_2009.gif) cosθ against 4sinθ is displayed in Fig. 2. The slope of the linearly adjusted data yields the strain was found 9.69 × 10⁻⁴ and the value of interception denotes the crystallite size which is predestined 81 nm.
cosθ against 4sinθ is displayed in Fig. 2. The slope of the linearly adjusted data yields the strain was found 9.69 × 10⁻⁴ and the value of interception denotes the crystallite size which is predestined 81 nm.
 | ||
| Fig. 2 Williamson–Hall plot of the α-KZnPO4 compound. | ||
The dislocation density (δ) gives an idea about the number of defects in the studied sample. It is calculated by using the equation:18
 | (3) |
The dislocation density values is 1.52 × 10⁻⁴ nm−2.
3.2 EDX analysis
The chemical compositions of α-KZnPO4 compound were verified by using the energy dispersive spectroscopy. The spectrum shown in Fig. 3 confirms the presence of all the constituent elements of α-KZnPO4, namely, Oxygen (O), Phosphate (P), Zinc (Zn), and Potassium (K), indicating that there was no loss of elements during the sintering step. The proportions of the constituents obtained as atomic percentages are registered in Table 1. The EDX data indicate that the preparation has good stoichiometries property and a purity chemical composition. The EDX and XRPD results confirm the success of synthesis of α-KZnPO4 specimen without any impurity.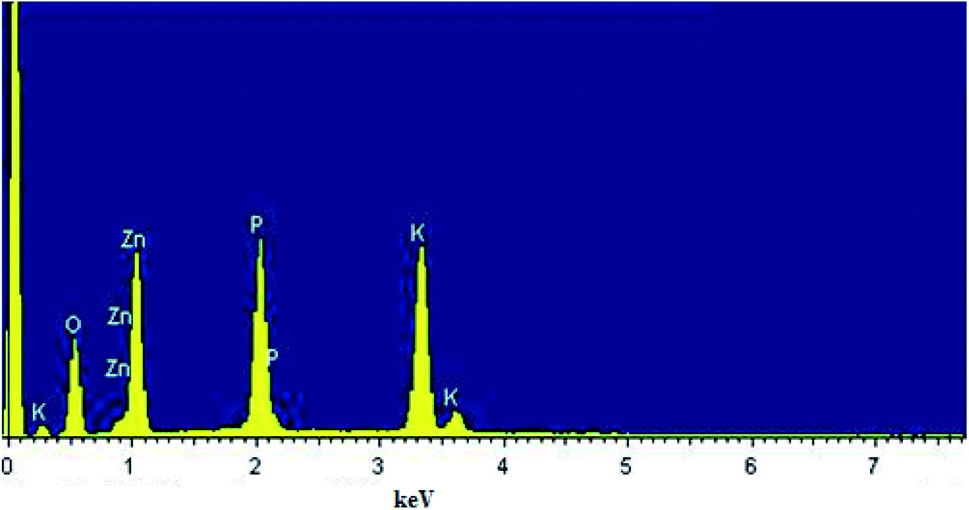 | ||
| Fig. 3 EDS profile of the ceramic compound α-KZnPO4. | ||
| Chemical element | %Weight | %Atomic |
|---|---|---|
| O | 33.97 | 58.95 |
| K | 18.49 | 13.13 |
| P | 16.38 | 14.69 |
| Zn | 31.16 | 13.24 |
3.3 UV/vis spectroscopy
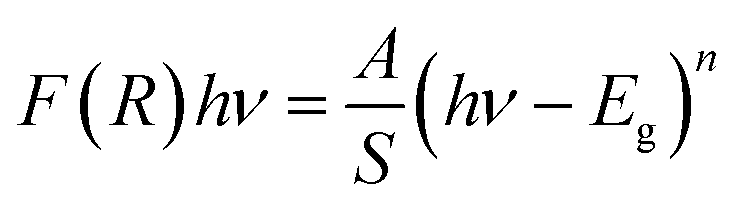
To explore the semiconducting properties of α-KZnPO4, a solid-state UV-vis spectroscopy analysis was performed. Fig. 4 reveals the experimental UV-vis absorption spectrum collected in the 200–800 nm wavelength range, at room temperature. Three bands appearing at 415, 456 nm and at 578 nm correspond to the transitions of the tetrahedron [PO4]3−. These bands can be relative to the electronic transitions 1T1 → 1A1, 3T2 → 1A1 and 3T1 → 1A1, respectively.19 They are accompanied by the transfer of charges from the oxygen atoms to the central phosphate atom within the [PO4]3− groups (orbit (2p) of the oxygen ion to the orbit (3d0) of the phosphate ion). Another band observed at 280 nm corresponds to the electronic transitions of the valence band represented by the orbit (3d10) of the zinc ion to the conduction band represented by the orbit (3d0) of the phosphate ion, assigned by 1A1g →3T1u. Thus, two bands at 550 nm and at 625 nm correspond to the zinc ion transitions.20 The band gap energy of α-KZnPO4 is determined by combining both the Kubelka–Munk function and the Tauc equation, by the following relation:21,22
 | (4) |
 | ||
| Fig. 4 UV-vis absorption of α-KZnPO4 compound. Insert: the Tauc plot. | ||
The inset of Fig. 4 shows the plots of (F(R)hν)1/2 and (F(R)hν)2 versus the photon energy (hν). The shapes of these curves favor the direct transition. An optical band gap Eg can be determined from the extrapolation of the linear region of the curve to meet the (hν) axis at (F(R)hν)2 = 0. The estimated band gap energy is 4.52 eV. This value proves that the α-KZnPO4 compound is a wide gap semiconductor.
3.4 Electrical properties
Fig. 5 describes the Nyquist diagram (−Z′′ vs. Z′) at some temperature. From the shape of these spectra, it can be understood the presence of a single semi-circular arc at each temperature, which confirms the grain contribution in this material.23 Moreover, the shows that the radius of the corresponding semicircular arcs decreased inversely with temperature, which reveals that the a conductivity improvement and thus more dielectric loss.24 The material has thus a semiconductor behavior. Additionally, we note that the experimental points are located on the arcs of the circles centered below the real axis. This suggests that the process of conduction in α-KZnPO4 does not obey the Debye model rather the Cole–Cole model.25
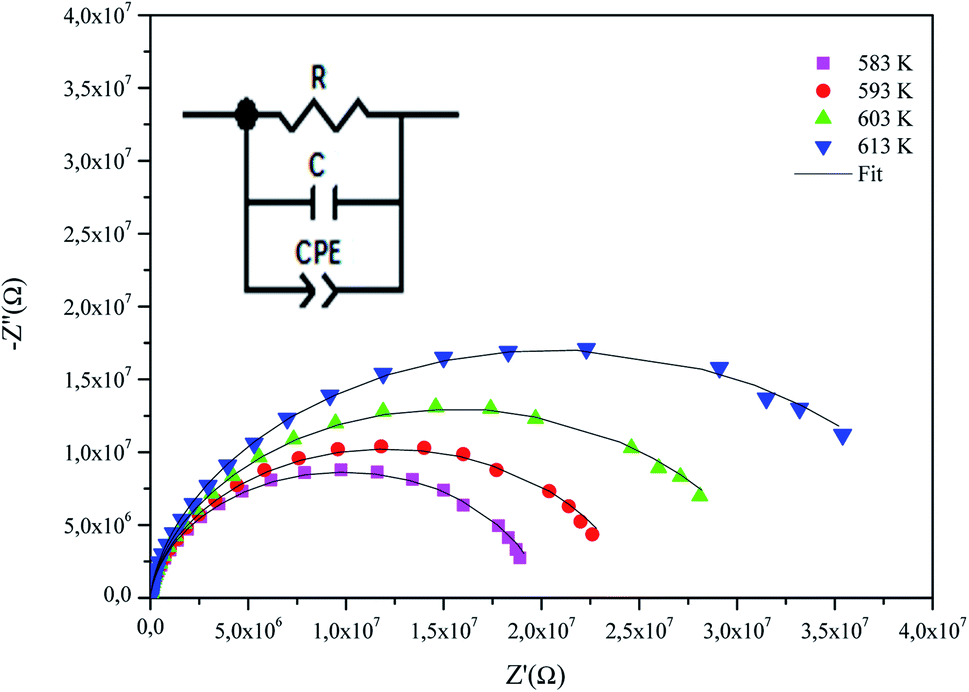 | ||
| Fig. 5 Complex impedance spectra in the Nyquist plane with electrical equivalent circuit (inset), accompanied by theoretical data (solid line). | ||
In order to analyze these spectra and to extract the different electrical parameters, it is useful to have an equivalent circuit model that provides a realistic representation of the electrical properties of the studied sample. The impedance components were adjusted with the Zview software. The best fit is the outcome of an electrical circuit formed by a parallel combination of a resistance R, capacitance C, and fractal capacitance CPE as depicted in the inset of Fig. 5. It is worth mentioning here that the presence of a constant phase element (CPE) in the equivalent circuit model justifies the non-ideal Debye behavior26 and describes the observed depression of the semicircles.
The impedance of the CPE contribution is an empirical function of the type:
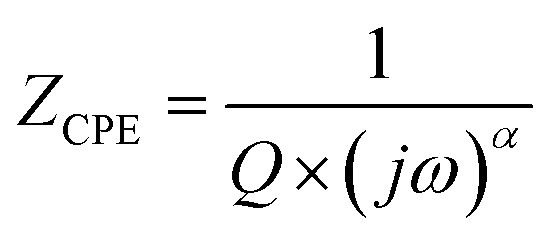 | (5) |
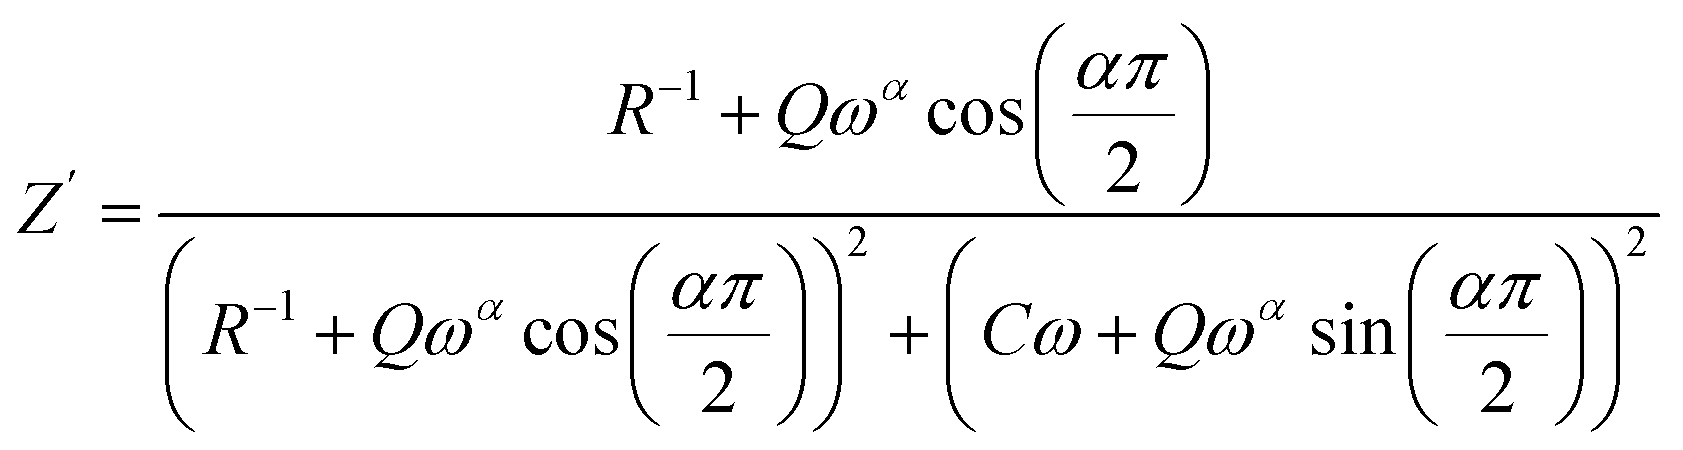 | (6) |
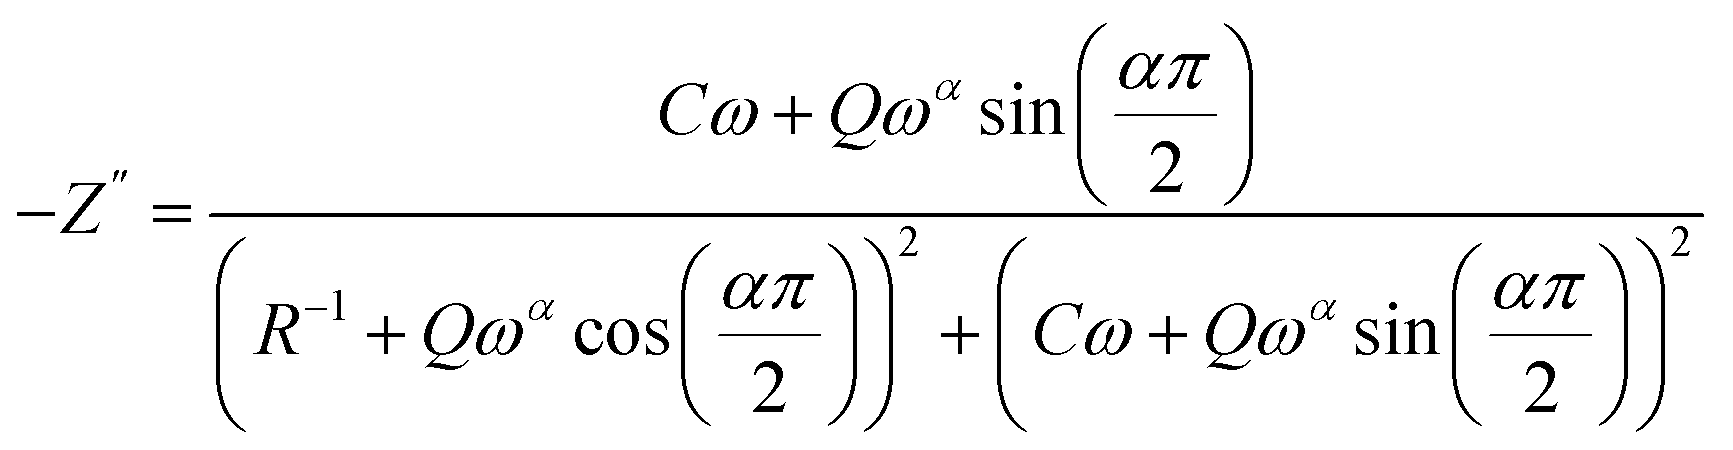 | (7) |
The parameters R, α, C, and Q have been obtained by using a mean square method that is used to minimize the difference between the experimental and calculated data.
The justification of the choice of the equivalent circuit is confirmed by the variations of the experimental values of (Z′) and (−Z′′) at various temperatures versus the calculated ones using the parameters of the equivalent circuit model (Fig. 6a and b). From this figure, it is evident that the slope obtained from a linear fit of the data points at each temperature is nearly equal to the unity. This behavior reveals that the adopted equivalent circuit describes well the electric properties of the investigated compound.
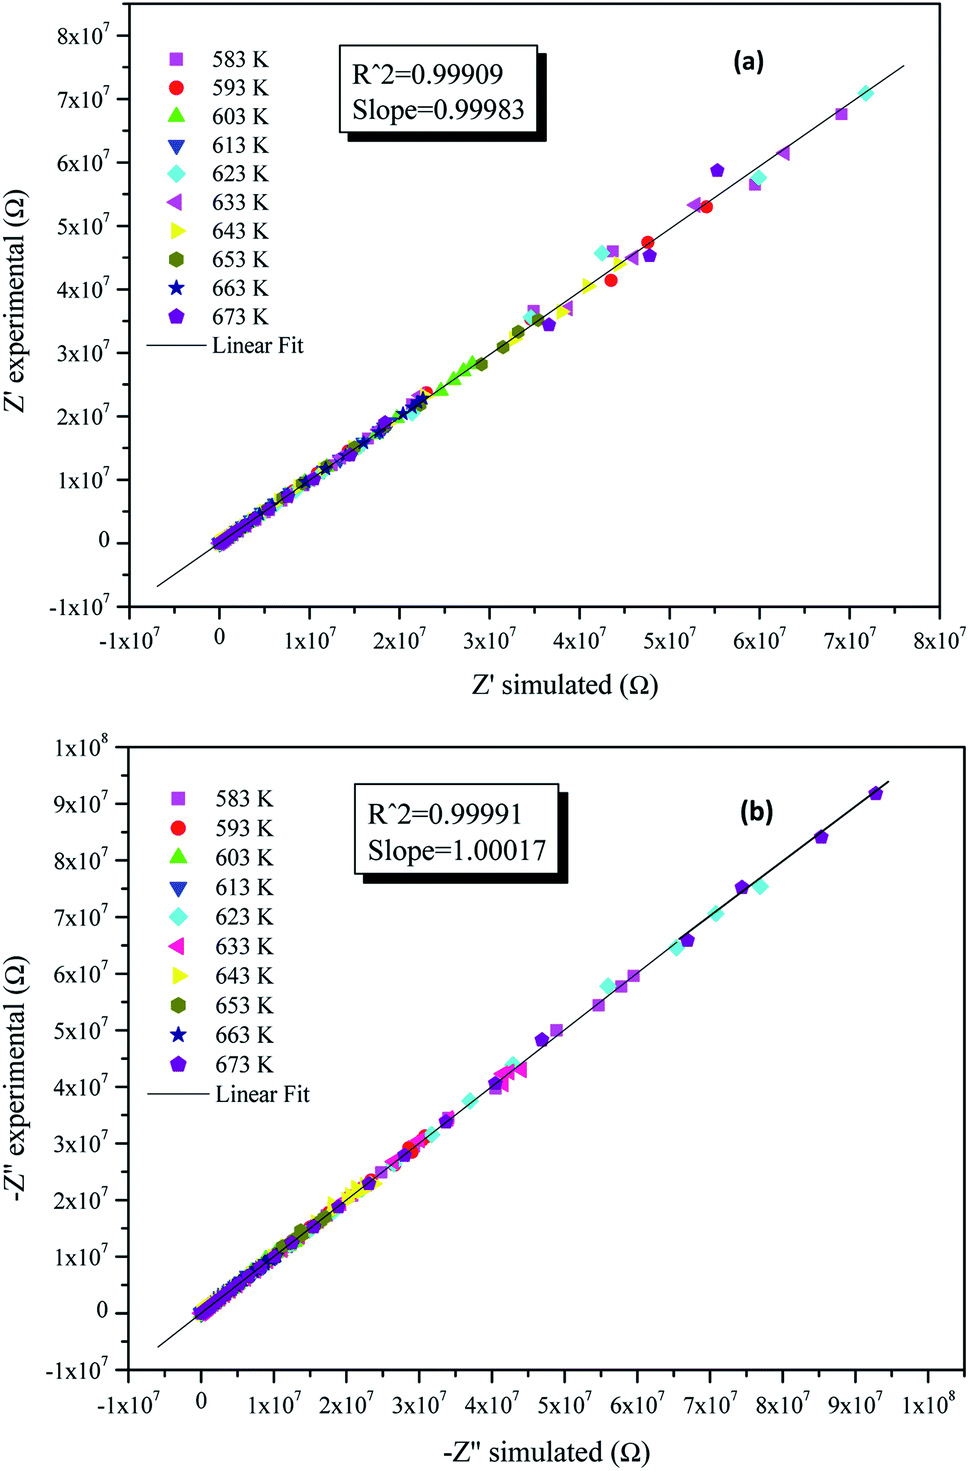 | ||
| Fig. 6 (a) and (b): plots of measured values versus simulated values of the real and imaginary parts of the impedance. | ||
3.5 Conductivity studies
 | (8) |
The temperature dependence of the conductivity (σdc) is displayed in Fig. 7. The linearity of ln(σdcT) versus 1000/T justifies that our sample does not have a phase transition in the temperature range studied. We note that the value of the conductivity increases gradually with increasing temperature, suggesting that the electrical conduction in this material is a thermally activated transport process.30 The linear region is fitted with the Arrhenius equation:
 | (9) |
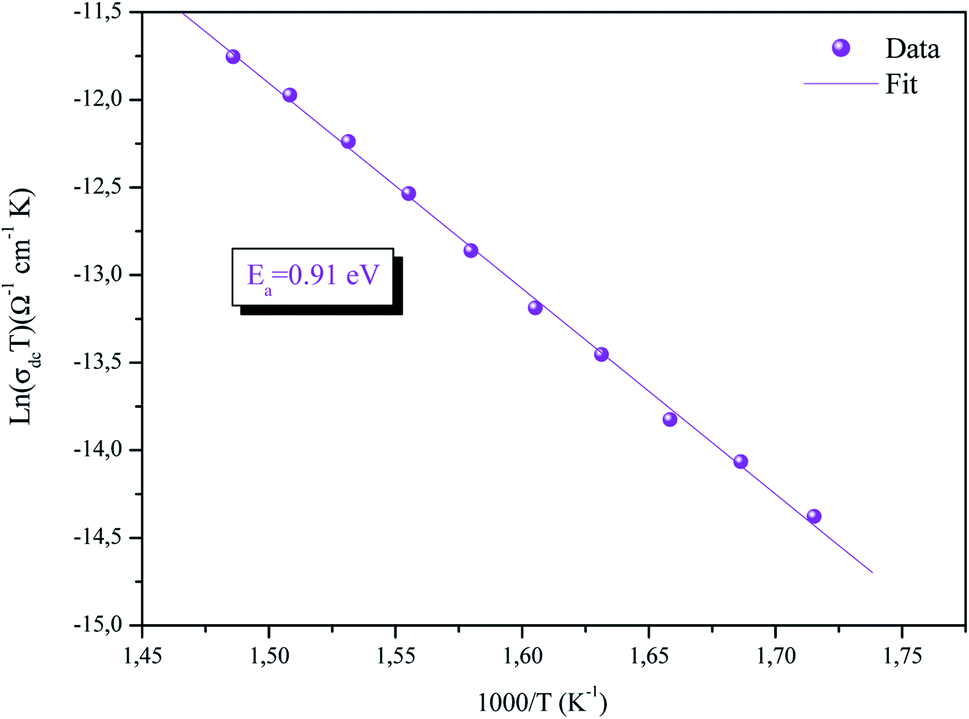 | ||
| Fig. 7 Arrhenius plots for the bulk conductivity of the α-KZnPO4 sample. | ||
 | (10) |
The variation of the ac conductivity as a function of the angular frequency at the temperature range from 583 to 673 K is illustrated in Fig. 8. In fact, the conductivity curves reveal the low-frequency and high-frequency regions.
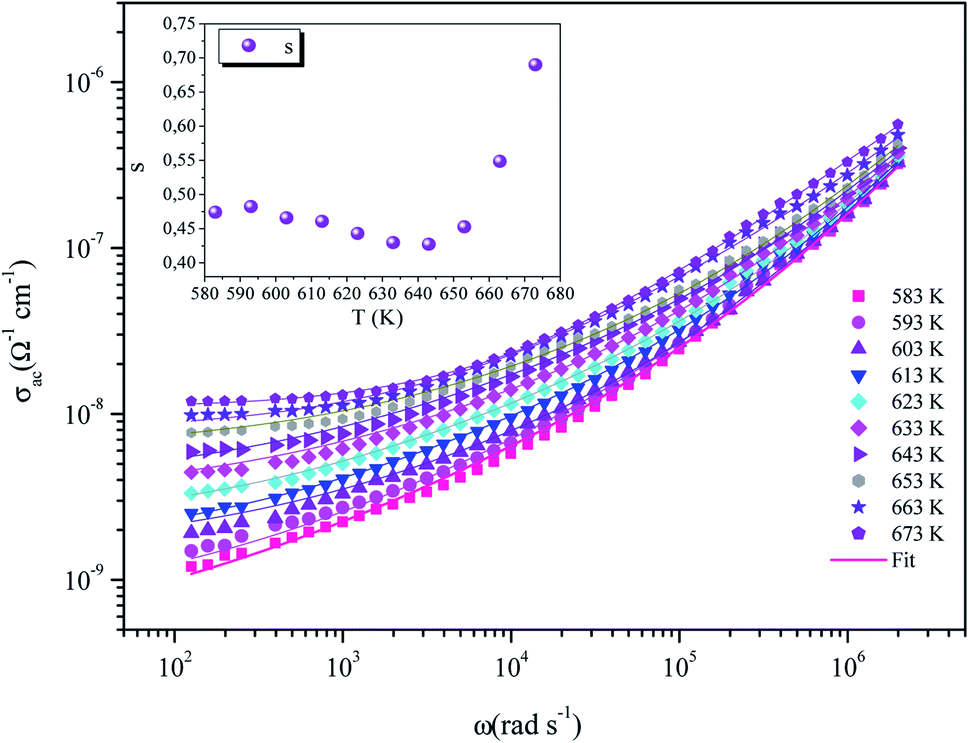 | ||
| Fig. 8 Dependence of ac conductivity with the angular frequency at different temperatures: the solid lines are the best fits to eqn (9). The inset is the variation of the universal exponent s with the temperature. | ||
The conductivity σac increases gradually with the increase in frequency in the high frequency region. However, it is nearly independent in the low frequency region. We deduce that the ions influence uncorrelated and aleatory hopping motions and lead a macroscopic transport of dc conductivity.31
The curves also reveal a AC conductivity elevation in congruence with temperature, which points out the semiconductor behavior of the title compound.32 In fact, this increase is related to the intensification of the mobility and the charge carriers that favor better conduction.33
Added to this, we noticed that the experimental measurements of the AC conductivity can be fitted by the known augmented Jonscher's relation:34
| σac(ω) = σdc + Aωs + Bω | (11) |
If s < 1, the electron jump is related to a displacement with a sudden jump. However, if s > 1, the charge carriers jump occurs between adjacent sites.
Eqn (11) denotes the universal dielectric response (UDR) and the nearly constant loss (NCL), which are two additive terms that match the different processes that occur in the material.
The power-law frequency-dependent UDR term is the result of the hopping of the carriers with interactions of the inherent defects or disorder in the material. However, the linear frequency-dependent NCL term is modeled to originate from rocking motions in an asymmetric double well potential36 and electrical loss occurring during the time regime; the ions are confined to the potential energy minimum.37 UDR and NCL terms are also designed to occur in the high-temperature/low-frequency and the low-temperature/high-frequency regimes, respectively.
The modeling of the experimental curves using the Jonscher equation (eqn (11)) shows good agreement between the theoretical and experimental plots and reveals the parameters σdc, A, B and s at different temperatures.
3.6 AC theory investigation of the conduction mechanism
The dependence of the AC conductivity and its exponent s(T) to frequency and temperature has been explained by a variety of theoretical models. In general, the effect of temperature on the exponent (s) plays a key role in the estimation of the conduction mechanism model in disordered materials. According to the literature, these models are based on tunneling load transport mechanisms by jumping over a potential barrier or through this barrier: these different models are the quantum mechanical tunneling (QMT) model, suggested by Austin-Mott,38 the correlated barrier hopping (CBH) model, presented by Elliot,39,40 the overlapping large polaron tunneling (OLPT) model proposed by Long,41 and finally the small polaron tunneling (SPT) model.42The variation of the exponent s as a function of temperature is shown in the inset of Fig. 8. It shows a drop when the temperature rises, reaching a minimum at 643 K, and then it starts to increase with increasing temperature. According to Long,41 the overlapping large polaron tunneling model (OLPT) is the adequate model for this compound. In addition, this model can be used in other phosphate compounds such as NaZnPO4 (ref. 43) and α-AgCuPO4.44
In this model, the polaron tunneling mechanism endorses the AC conductivity while the distortion clouds of the polarons overlapped. As for large polarons, the spatial extent of the polaron was larger than the interatomic spacing. For some polarons, the potential wells of the nearby sites could overlap due to the long-range character of the Coulomb interaction. Subsequently, the polaron hopping energy decreases. The polaron hopping energy is reduced according to the following equation:
 | (12) |
 | (13) |
According to this model, the expression for the AC conductivity was evaluated by the following equation:41,43,44
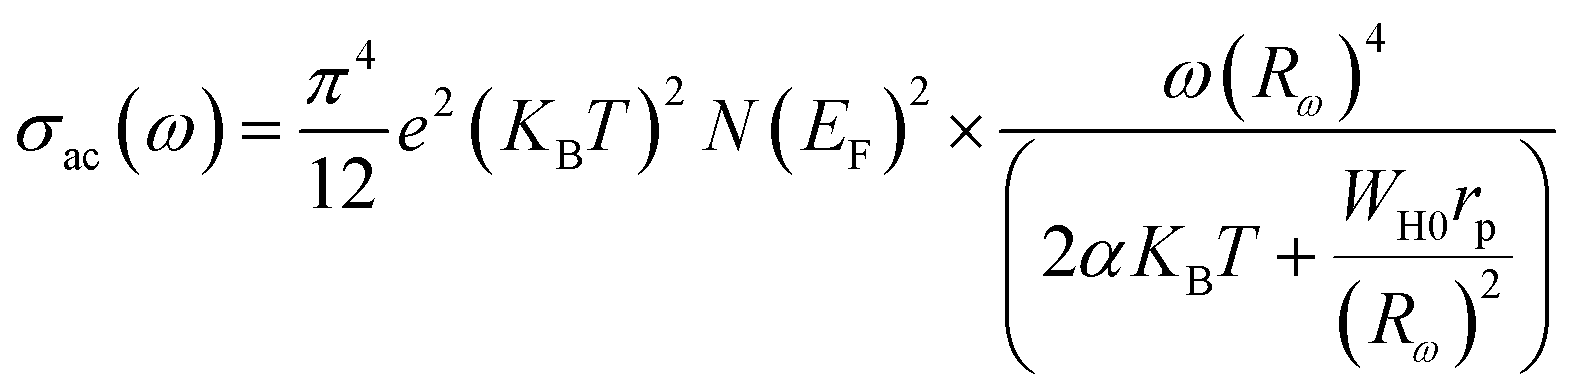 | (14) |
 | (15) |
In the OLPT model, s is defined by the following formula:
 | (16) |
These expressions are used in order to adjust the variation of ln(σac) as a function of 1000/T for fixed values of frequency, which is shown in Fig. 9. It is clear that the theoretical calculations of the conductivity (fits) are in good agreement with the experimental data (symbol), which confirms the choice of the OLPT model.
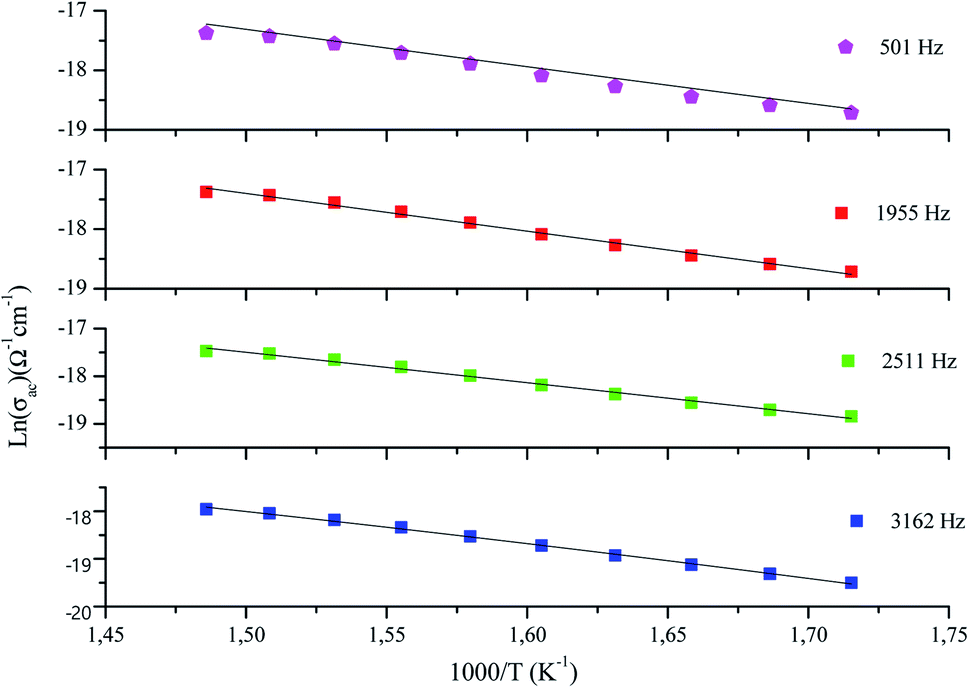 | ||
| Fig. 9 OLPT model fitting of ac conductivity at different frequency values for α-KZnPO4. | ||
The values of the parameters α, WH0, N(EF), rp, and Rω, resulting from this adjustment are classified in Table 2.
| Frequencies (Hz) | N(EF) (eV−1 cm−3) | α (Å−1) | WH0 (eV) | rp (Å) |
|---|---|---|---|---|
| 501 | 3.83 × 10¹³ | 1 | 0.90 | 0.20 |
| 1955 | 4.00 × 10¹³ | 1 | 0.97 | 0.39 |
| 2511 | 4.37 × 10¹³ | 1 | 0.99 | 0.46 |
| 3162 | 4.53 × 10¹³ | 1 | 1.0 3 | 0.49 |
Among the results of refinement, the variations of the states density N(EF) against frequency are shown in Fig. 10(a). The frequency increase stimulates the mobility of free charge. This can be the cause behind the increment of the radius of the polaron (rp) and it thus justifying the elevation of the ac conductivity at a high frequency.
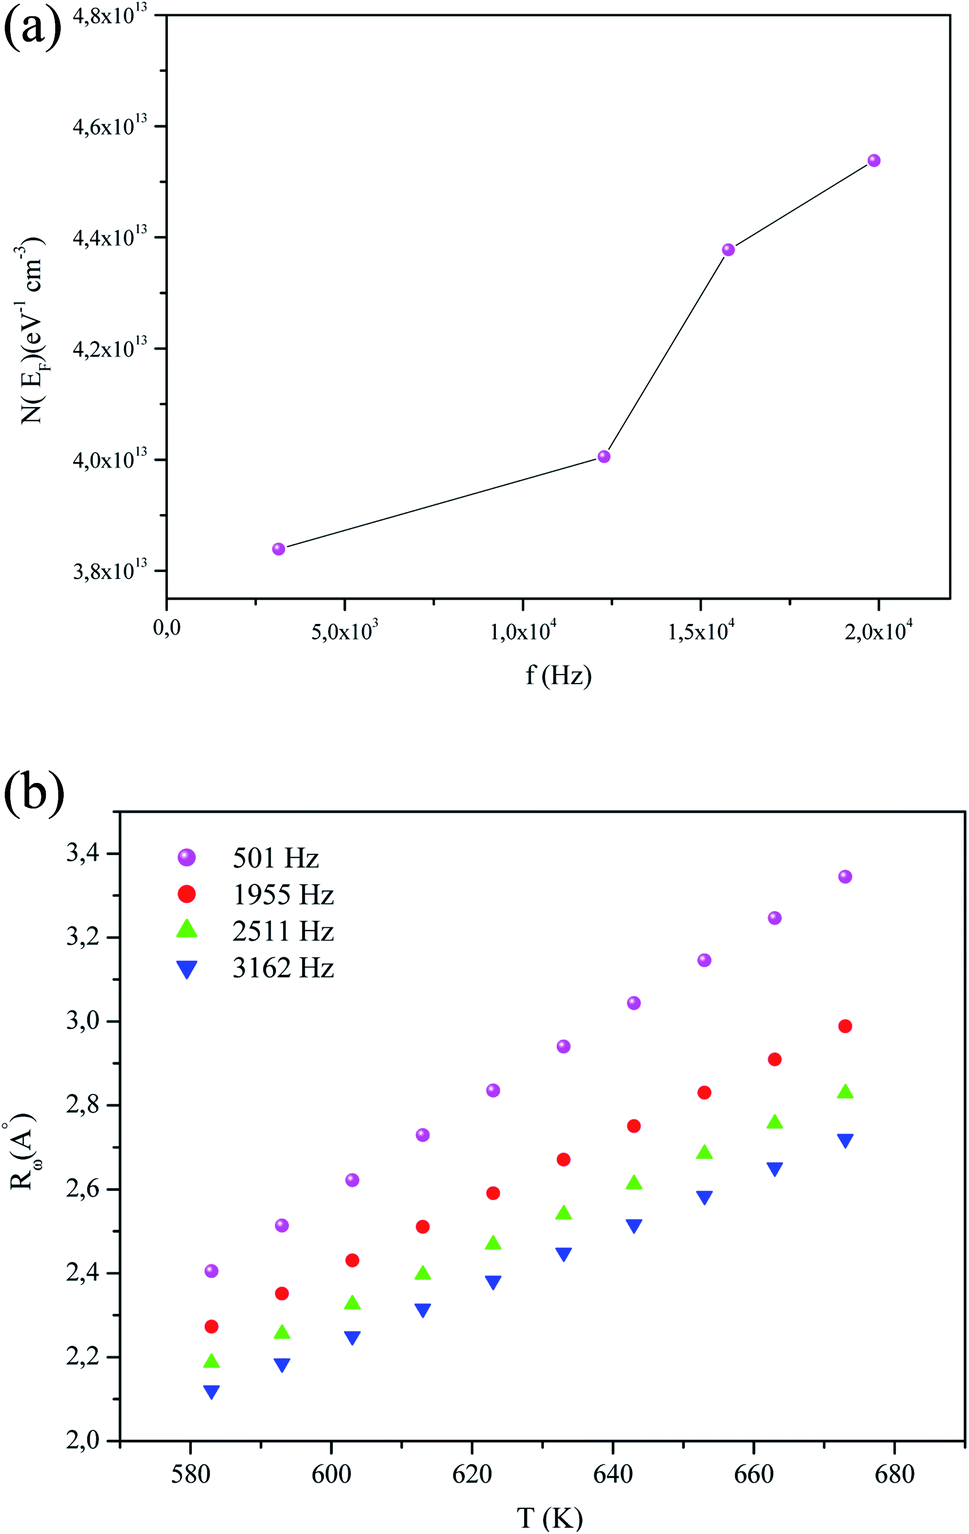 | ||
| Fig. 10 (a) Variation of the parameters N(EF) (eV−1 cm−3) as a function of frequency. (b) Temperature dependence of the hopping tunneling distance Rω at different frequencies. | ||
The variation of the tuning distance Rω with temperature for diverse frequencies is illustrated in Fig. 10(b). For a fixed temperature, it is remarkable that the tunneling distance Rω decreases most rapidly at anincreased frequency. At a fixed frequency, the distance of the tunnel increases with the increase in temperature, implying that the elevation in temperature provides a contribution of thermal energy to the polarons, which then move and accelerate the hopping processes and, subsequently, the interchain interaction.
We notice that the values of Rω were similar to the interatomic spacing. The Rω hopping distance are in the interatomic distance (2.10 Å ≤ Rω ≤ 3.34 Å) order of magnitude. The conduction process of the material is due to the movement of the K+ cation along the (001) tunnels direction.
3.7 Complex modulus analysis
To analyze the electrical relaxation processes at different temperatures and frequencies, we relied on the modulus formalism. This method makes it possible to extract the conductivity relaxation frequency for the grain material and to determine the charge carrier parameters.This formalism is complementary to the conductivity study.
Macedo and et al.45 formulated a theory for conductivity relaxation in ion conductors in terms of a dimensionless quantity, M*, which is defined as the inverse of complex permittivity, ε*(ω). It is resolved into real and imaginary parts:
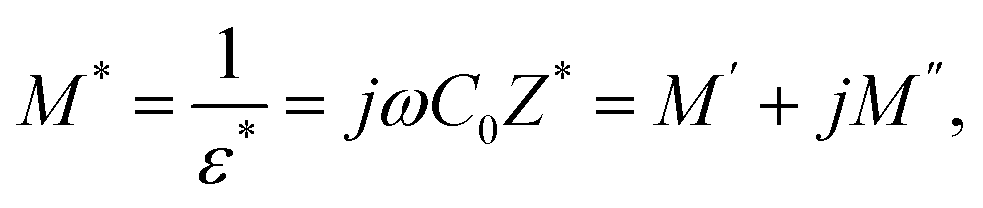 | (17) |
where
 is the vacuum capacitance of cell.
The variation of the real part of the electric modulus (M′) as afunction of the frequency at different temperatures isshownin Fig. 11(a). At lower frequencies region, M′ is found to be approaching zero for all the given temperatures, which may be due to the neglect of electrode polarization.46 Moreover, the value of M′ has followed a continuous dispersal with the increase in frequency. This can be attributed to the conduction phenomena due to the short distance mobility of charge carriers in the temperature ranges considered.47,48
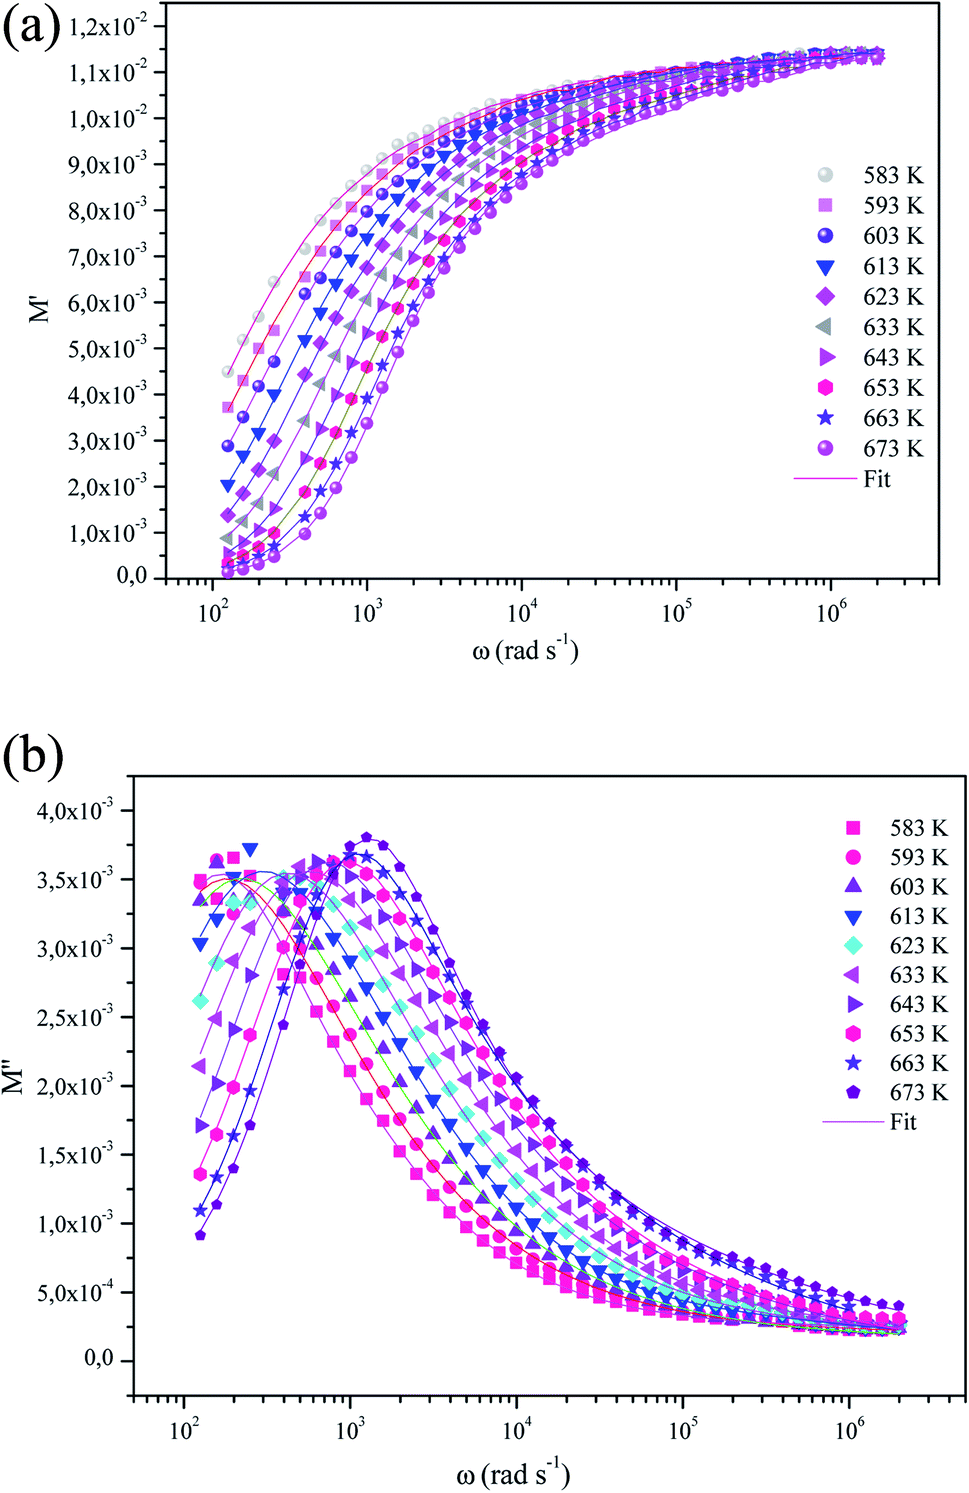 | ||
| Fig. 11 (a) The variation of the real part of the electrical modulus as a function of the frequencies of α-KZnPO4 at different temperatures. (b) Variation of imaginary parts of modulus (M′′) as a function of frequency at various temperatures. Solid lines represent the fitted data to eqn (16). | ||
The variation of the imaginary part M′′ of the modulus as a function of frequency at several temperatures is shown in Fig. 11(b).
The plot shows the characteristic peaks at (fmax) centered at the dispersion region of the real part of electric modulus (M′). The presence of these peaks in the modulus spectra accounts for the conductivity relaxation processes. At a higher temperature, the relaxation peak moves to a higher frequency position, which shows a relaxation process in accordance with temperature. With the increase in temperature, the charge carriers become thermally activated and their movement speeds up. Consequently, the relaxation time decreases and the relaxation frequency increases. This phenomenon shifts the relaxation peaks towards a higher frequency with an increasing temperature.
At the low frequency region below the maximum peak 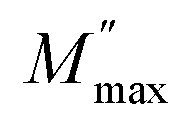 , a pure conduction process takes place.49 The charge carriers drift to long distances. However, at the high frequency region above the maximum peak
  ; the carriers are spatially constrained to move freely only within their potential wells over short distances.50 Thus, the peak frequency (fmax) underlies the transition from long range to short range mobility of charge carriers.51,52
Besides, the experimental data of M′′ were fitted theoretically using a Bergman's equation which is plotted in Fig. 11(b) by a solid line. The imaginary part of M′′(ω) was approximated as:53
 | (18) |
 , ωmax are the modulus and the angular frequency maximum, respectively. β is the stretched exponential parameter positioned in the range of [0–1]. β = 1 for an ideal dielectric, where the dipole–dipole interaction is negligible (Debye relaxation) and this interaction is significant when β < 1 (non-Debye relaxation).
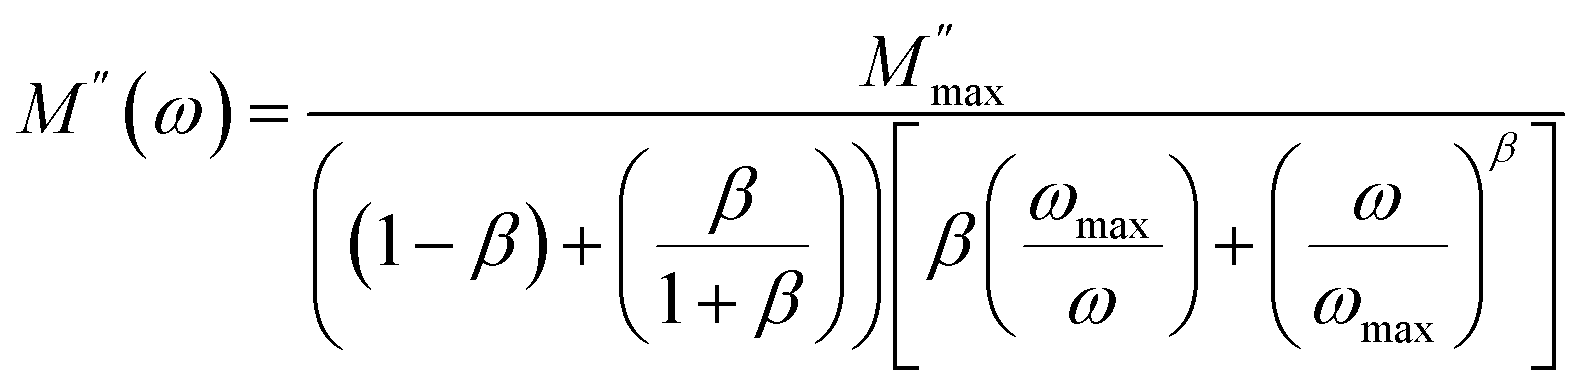
The β parameter extracted from the best fit at diverse temperatures is displayed in Fig. 12. Its values are found to be temperature dependent. We thus notice that all values of β are less than unity. This confirms the non-Debye behavior for the α-KZnPO4 compound.
 | ||
| Fig. 12 Variation of β as a function of temperature. | ||
Activation energy associated with the relaxation process has been determined from the temperature dependent relaxation frequency, which, according to Arrhenius law, is given by:
 | (19) |
The insert of Fig. 13 demonstrates the plot of ln(fm) vs. 1000/T. The value of activation energy (Em) is computed according to the above plot and range in the order of (0.79 ± 0.02) eV. The difference between the values of activation energy obtained by impedance spectroscopy and electrical relaxation modulus confirms that the transport in α-KZnPO4 is not due to a simple hopping mechanism.
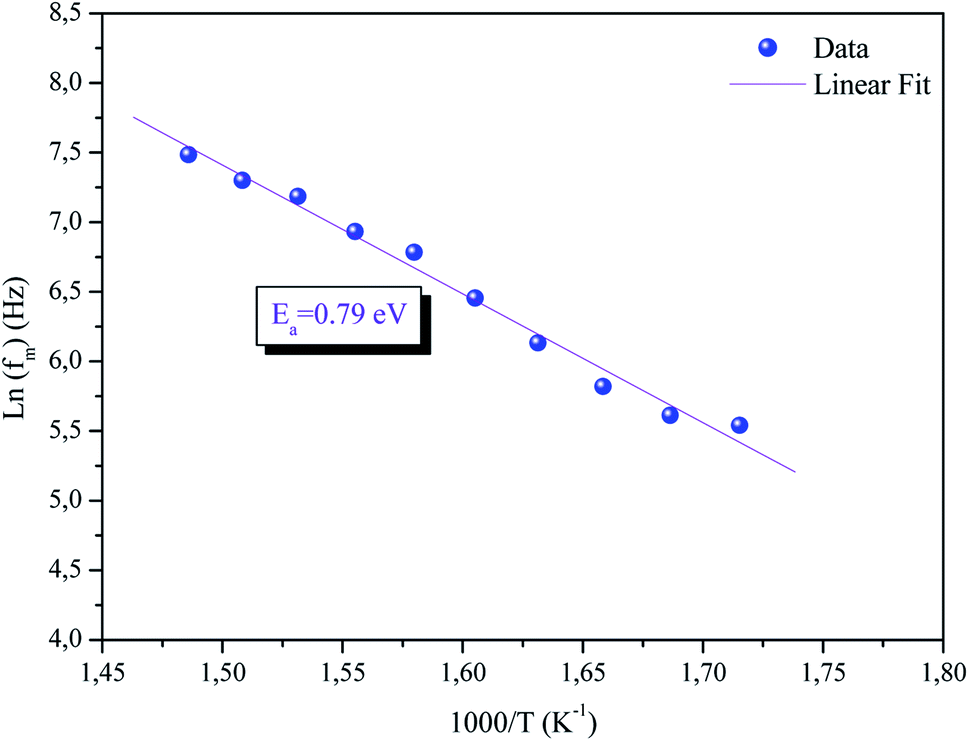 | ||
| Fig. 13 The dependence of ln(fm) on temperature for α-KZnPO4. | ||
4. Conclusions
The α-KZnPO4 compound was successfully prepared by the solid method under newly-defined conditions of temperature. X-ray diffraction recorded at room temperature revealed that the structure of the compound crystallizes in hexagonal symmetry with P63 space group. Furthermore, the EDX results confirm the good stoichiometric property of the preparation and prove a homogeneous chemical composition. The optical measurement proves the light absorption in the UV and visible range where the band gap is around 4.52 eV, indicating a wide gap semiconductor compound. A detailed analysis of the impedance data reveals a non-Debye relaxation and confirms the only contribution of grain to the conductivity of the material. An equivalent circuit for the electrochemical cell with the studied compound was proposed. The AC conductivity obeys of augmented Jonscher's power law at different temperatures. The displacements of the K+ ion are probably due to an OLPT mechanism in the tunnel-type cavities along the c axis. In fact, the OLPT is the most appropriate model for explaining the mechanism of the charge transport in α-KZnPO4. Values of obtained parameters from the adjustment of AC conductivity data were discussed and correlated to the crystallographic data. Eventually, the temperature variation of M′′ peak showed a thermally activated relaxation process and a temperature-dependent stretching exponent β parameter.Conflicts of interest
All authors have no conflicts of interest.References
- H. Sharma, S. Jindal and N. Aggarwal, Impact of copper doping on perovskite structure ferroelectric ceramic, Mater. Today, 2020, 33, 1632–1636 CAS.
- T. Xian, H. Yang, L. Di and J. Dai, Enhanced photocatalytic activity of BaTiO3C3N4 for the degradation of methyl orange under simulated sunlight irradiation, J. Alloys Compd., 2015, 622, 1098–1104 CrossRef CAS.
- P. P. Khirade, S. D. Birajdar, A. V. Humbe and K. M. Jadhav, Structural, electrical and dielectrical property investigations of Fe-doped BaZrO3 nanoceramics, J. Electron. Mater., 2016, 45, 3227–3235 CrossRef CAS.
- I. Pet’kov, V. I. Korchemkin, E. A. Asabina, A. R. Zaripov, V. S. Kurazhkovskaya, E. Yu Borovikova and S. Yu Stefanovich, Russ. J. Inorg. Chem., 2012, 57, 1214–1225 CrossRef.
- G. Nénert, J. Bettis, R. Kremer, H. Ben Yahia, C. S. Ritter, E. Gaudin, O. Isnard and M. H. Whangbo, Inorg. Chem., 2013, 52, 9627–9635 CrossRef PubMed.
- H. P. Uppara, H. Dasari, S. K. Singh, N. K. Labhsetwar and M. S. Murari, Effect of copper doping over GdFeO3 perovskite on soot oxidation activity, Catal. Lett., 2019, 149, 3097–3110 CrossRef CAS.
- S. Zhang, D. Guo, M. Wang, M. S. Javed and C. Hu, Magnetism in SrTiO3 before and after UV irradiation, Appl. Surf. Sci., 2015, 335, 115–120 CrossRef CAS.
- D. J. Shin, S. J. Jeong, C. E. Seo, K. H. Cho and J. H. Koh, Multi-layered piezoelectric energy harvesters based on PZT ceramic actuators, Ceram. Int., 2015, 41, S686–S690 CrossRef CAS.
- R. Gautier, O. K. Andersen, P. Gougeon, J. F. Halet, E. Canadell and J. D. Martin, Electronic Structure, Electrical and Magnetic Properties of RMo8O14 Compounds (R = La, Ce, Pr, Nd, Sm) Containing Bicapped Mo8 Clusters, Inorg. Chem., 2002, 41, 4689–4699 CrossRef CAS PubMed.
- F. Zhou, K. Kang, T. Maxisch, G. Ceder and D. Morgan, The electronic structure and band gap of LiFePO4 and LiMnPO4, Solid State Commun., 2004, 132, 181–186 CrossRef CAS.
- M. D. Johannes, K. Hoang, J. L. Allen and K. Gaskell, Hole polaron formation and migration in olivine phosphate materials, Phys. Rev. B: Condens. Matter Mater. Phys., 2012, 85, 115106 CrossRef.
- G. Wallez, F. Lucas, J. P. Souron and M. Quarton, Potassium-zinc monophosphate: an original polymorphic tridymite derivate, Mater. Res. Bull., 1999, 34, 1251–1261 CrossRef CAS.
- A. Martina, The Crystal Structure of α-KZnPO4, Z. Naturforsch., B: J. Chem. Sci., 1992, 47, 1249–1254 CrossRef.
- R. Hammond and J. Barbier, Structural chemistry of NaCoPO4, Acta Crystallogr., Sect. B: Struct. Crystallogr. Cryst. Chem., 1996, 52, 440–449 CrossRef.
- P. Feng, X. Bu, S. H. Tolbert and G. D. Stucky, Syntheses and characterizations of chiral tetrahedral cobalt phosphates with zeolite ABW and related frameworks, J. Am. Chem. Soc., 1997, 119, 2497–2504 CrossRef CAS.
- R. Hammond, J. Barbier and C. Gallardo, Crystal structures and crystal chemistry of AgXPO4 (X = Be, Zn), J. Solid State Chem., 1998, 141, 77–185 CrossRef.
- P. Rozalin, R. Naik and N. C. Mishra, Low-temperature growth of γ phase in thermally deposited In2Se3 thin films, Phase Transitions, 2012, 91, 862–871 Search PubMed.
- P. Priyadarshini, D. Subhashree, D. Alagarasan, R. Ganesan, S. Varadharajaperumal and R. Naik, Observation of high nonlinearity in Bi doped BixIn35-xSe65 thin films with annealing, Sci. Rep., 2021, 11, 21518 CrossRef CAS PubMed.
- M. Enneffati, N. K. Maaloul, B. Louati, K. Guidara and K. Khirouni, Synthesis, vibrational and UV-visible studies of sodium cadmium orthophosphate, Opt. Quantum Electron., 2017, 3, 331 CrossRef.
- M. Mehnaoui, R. Ternane, G. Panczer, M. Trabelsi-Ayadi and G. Boulon, Structural and luminescent properties of new Pb2+ doped calcium chlorapatites Ca10−xPbx(PO4)6Cl2 (0 ≤ x ≤ 10, J. Phys.: Condens. Matter, 2008, 20, 275227 CrossRef CAS PubMed.
- P. Priyadarshini, D. Subhashree, A. Devarajan, G. Rajamanickam and V. Selvaraj, Role of Bismuth incorporation on the structural and optical properties in BixIn35-xSe65 thin films for photonic applications, J. Am. Ceram. Soc., 2021, 104, 5803–5814 CrossRef CAS.
- P. Kubelka, Ein Beitrag zur Optik der Farbanstriche (Contribution to the optic of paint), Z. Phys. Chem., 1931, 12, 593–601 Search PubMed.
- K. B. Brahim, A. Oueslati, F. Hlel and M. Gargouri, Synthesis, structural characterization and electrical conduction mechanism of the new organic–inorganic complex: ([(C3H7)4N] FeCl4), Mater. Res. Bull., 2019, 118, 110505 CrossRef.
- C. L. Li, T. Y. Yan, G. O. Barasa, Y. H. Li, R. Zhang, S. Huang and S. L. Yuan, Colossal dielectric response in Ba1.5Sr1.5Co2Fe24O41 ceramics at high-temperature, J. Mater. Sci.: Mater. Electron., 2018, 29, 9971–9978 CrossRef CAS.
- M. Mumtaz, M. Naveed, B. Amin, M. Imran and M. N. Khan, Temperature dependent impedance spectroscopy of (Co3O4)x/CuTl-1223 nanoparticles-superconductor composites, Ceram. Int., 2018, 44, 4351–4359 CrossRef CAS.
- S. B. Aziz and R. M. Abdullah, Crystalline and amorphous phase identification from the tanδ relaxation peaks and impedance plots in polymer blend electrolytes based on [CS: AgNt]x: PEO (x-1)(10 ≤ x ≤ 50), Electrochim. Acta, 2018, 285, 30–46 CrossRef CAS.
- B. Louati, Vibrational analysis and AC electrical conduction behavior of lithium zinc orthogermanate, Ionics, 2021, 1–8 Search PubMed.
- S. Selvasekarapandian and M. Vijayakumar, The ac impedance spectroscopy studies on LiDyO2, Mater. Chem. Phys., 2003, 80, 29–33 CrossRef CAS.
- I. Dakhlaoui, K. Karoui, F. Hajlaoui, N. Audebrand, T. Roisnel and F. Jomni, [(CH3)3N(CH2)2Br]2[CoBr4] halogenometallate complex: crystal structure, high-temperature reversible phase transition, electrical and optical properties, J. Mol. Struct., 2021, 1231, 129684 CrossRef CAS.
- M. M. Costa, G. F. M. Pires Jr, A. J. Terezo, M. P. F. Graca and A. S. B. Sombra, Impedance and modulus studies of magnetic ceramic oxide Ba2Co2Fe12O22(Co2Y) doped with Bi2O3, J. Appl. Phys., 2011, 110, 034107 CrossRef.
- L. Miladi, A. Oueslati and K. Guidara, Phase transition, conduction mechanism and modulus study of KMgPO4 compound, RSC Adv., 2016, 6, 83280–83287 RSC.
- L. Essaleh, S. Amhil, S. M. Wasim, G. Marín, E. Choukri and L. Hajji, Theoretical and experimental study of AC electrical conduction mechanism in the low temperature range of p-CuIn3Se5, Phys. E Low-dimens. Syst. Nanostruct., 2018, 99, 37–42 CrossRef CAS.
- J. Shanker, B. V. Prasad, M. B. Suresh, R. V. Kumar and D. S. Babu, Electrical properties of NdCr1-xFexO3 perovskite ceramic nanoparticles—An impedance spectroscopy studies, Mater. Res. Bull., 2017, 94, 385–398 CrossRef CAS.
- S. Nasri, M. Megdiche, M. Gargouri and K. Guidara, Electrical conductivity and dielectric relaxation behavior of AgFeP2O7 compound, Ionics, 2014, 20, 399–407 CrossRef CAS.
- K. Funke, Jump relaxation in solid electrolytes, Prog. Solid State Chem., 1993, 22, 111–195 CrossRef CAS.
- A. S. Nowick and B. S. Lim, Electrical relaxations: Simple versus complex ionic systems, Phys. Rev. B: Condens. Matter Mater. Phys., 2001, 63, 184115 CrossRef.
- C. León, A. Rivera, A. Várez, J. Sanz, J. Santamaria and K. L. Ngai, Origin of constant loss in ionic conductors, Phys. Rev. Lett., 2001, 86, 1279 CrossRef PubMed.
- I. G. Austin and N. F. Mott, Polarons in crystalline and non-crystalline materials, Adv. Phys., 1969, 18, 41–102 CrossRef CAS.
- S. R. Elliott, Ac conduction in amorphous chalcogenide and pnictide semiconductors, Adv. Phys., 1987, 36, 135–217 CrossRef CAS.
- R. Punia, R. S. Kundu, M. Dult, S. Murugavel and N. Kishore, Temperature and frequency dependent conductivity of bismuth zinc vanadate semiconducting glassy system, J. Appl. Phys., 2012, 112, 083701 CrossRef.
- A. R. Long, Frequency-dependent loss in amorphous semiconductors, Adv. Phys., 1982, 31, 553–637 CrossRef CAS.
- M. Dult, R. S. Kundu, S. Murugavel, R. Punia and N. Kishore, Conduction mechanism in bismuth silicate glasses containing titanium, Phys. Rev. B: Condens. Matter Mater. Phys., 2014, 452, 102–107 CrossRef CAS.
- N. Chakchouk, B. Louati and K. Guidara, Electrical properties and conduction mechanism study by OLPT model of NaZnPO4 compound, Mater. Res. Bull., 2018, 99, 52–60 CrossRef CAS.
- S. O. Mansour, B. Louati and K. Guidara, AC conductivity and dielectric behavior of low-temperature phase of α-AgCuPO4, Ionics, 2016, 22, 1135–1143 CrossRef CAS.
- P. B. Macedo, C. T. Moynihan and R. Bose, The long time aspects of this correlation function, which are obtainable by bridge techniques at temperatures approaching the glass transition, Glass Phys. Chem., 1972, 13, 171 CAS.
- S. Dhankhar, R. S. Kundu, R. Parmar, S. Murugavel, R. Punia and N. Kishore, Electronic transport and relaxation studies in bismuth modified zinc boro-tellurite glasses, Solid State Sci., 2015, 48, 230–236 CrossRef CAS.
- F. S. Howell, R. A. Bose, P. B. Macedo and C. T. Moynihan, Electrical relaxation in a glass-forming molten salt, J. Phys. Chem. A, 1974, 78, 639–648 CrossRef CAS.
- K. L. Nagi and C. Leon, Recent advances in relating macroscopic electrical relaxation data to microscopic movements of the ions in ionically conducting materials, Solid State Ionics, 1999, 125, 81–90 CrossRef.
- A. Hadded, J. Massoudi, E. Dhahri, K. Khirouni and B. F. O. Costa, Structural, optical and dielectric properties of Cu1.5Mn1.5O4 spinel nanoparticles, RSC Adv., 2020, 10, 42542–42556 RSC.
- K. Holderna-Natkaniec, M. O. M. Sghaier, P. Ławniczak, M. Zdanowska-Frączek, A. Wozniak-Braszak and S. Chaabouni, Electric properties and internal dynamics of the [C6H18N2]SbCl5 [C6H18N2]Cl2 in intermediate temperature phase (part II), Polyhedron, 2015, 85, 131–136 CrossRef CAS.
- R. Vaish and K. B. R. Varma, Dielectric properties of Li2O-3B2O3 glasses, J. Appl. Phys., 2009, 106, 064106 CrossRef.
- N. Kaur, M. Singh, L. Singh and A. M. Awasthi, Kumar J Gamma-radiation-induced dielectric relaxation characteristics of layered crystals of phlogopite mica, Nucl. Instrum. Methods Phys. Res., Sect. B, 2013, 316, 232–238 CrossRef CAS.
- R. Bergman, General susceptibility functions for relaxations in disordered systems, J. Appl. Phys., 2000, 88, 1356–1365 CrossRef CAS.
| This journal is © The Royal Society of Chemistry 2022 |