 Open Access Article
Water-soluble carboxymethyl chitosan (WSCC)-modified single-walled carbon nanotubes (SWCNTs) provide efficient adsorption of Pb(II) from water†
Jinling Gao *,
Mingzhe Song,
Tongtong Li,
Yuyao Zhao and
Anxu Wang
College of Science, Heilongjiang Bayi Agricultural University, Daqing, 163319, China. E-mail: gjlscl@sina.com
First published on 1st March 2022
Abstract
Nanocomposites play a key role in the removal of toxic metal(loid)s from environmental water. In this study, we investigated the adsorption capability of water-soluble carboxymethyl chitosan (WSCC)-modified functionally oxidized single walled carbon nanotubes (oSWCNTs) for rapid and efficient removal of toxic Pb(II) from water. The WSCC–oSWCNTs nanocomposite was prepared by an acid treatment of SWCNTs followed by an ultrasonic dispersion process using WSCC as dispersant. The morphology and chemical characteristics of the WSCC–oSWCNTs nanocomposite were further identified using various characterization techniques (i.e., transmission electron microscopy, TEM; scanning electron microscopy, SEM; Raman spectra; Fourier transform infrared spectroscopy, FTIR; X-ray photoelectron spectroscopy, XPS; nitrogen adsorption–desorption isotherm test). The efficiency of the adsorption process in batch experiments was investigated via determining various factor effects (i.e. WSCC–oSWCNTs nanocomposite concentration, solution pH, initial Pb(II) concentration, contact time, and reaction temperature). Kinetic results showed that the adsorption process followed a pseudo-second-order, while an isotherm results study showed that the adsorption process followed the Langmuir and Freundlich isotherm models at the same time. In addition, the van't Hoff equation was used to calculate thermodynamic parameters for assessing the endothermic properties and spontaneity of the adsorption process. The WSCC–oSWCNTs nanocomposite manifested a high adsorption capacity for Pb(II) (113.63 mg g−1) via electrostatic interactions and ion-exchange, as its adsorption rate could reach up to 98.72%. This study, therefore, provides a novel adsorbent for the removal and detection of harmful residues (i.e. toxic metal(loid)s) from environmental water, such as industry wastewater treatment and chemical waste management.
1 Introduction
Water pollution, being a global problem, has received considerable attention in recent years due to its serious threat to the whole biosphere.1 With industrial waste, toxic metal(loid)s have been discharged into the environment, causing water pollution. It is well known that Pb(II), one of the most carcinogenic heavy metals, enters the food chain through the polluted water, threatening the safety of the global biosphere.2,3 The maximum permissible Pb(II) exposure in drinking water is 15 μg L−1.4 It, thus, is of great practical significance to study how to effectively remove Pb(II) from wastewater.Current methods for removing toxic metal(loid)s in water include coprecipitation,5 membrane filtration,6 reverse osmosis,7 photocatalysis methods8,9 and adsorption.10 Among these methods, adsorption is a promising technique that is simple operation, low cost and friendly effect.11 Adsorption method is a relatively mature and simple technology of wastewater treatment, especially suitable for large volume and low concentration of water treatment system. Common adsorbents include activated carbon,12 biological materials,13 hydrogel,14 silica gel,15 and nano complex materials.16 However, these adsorbents have some disadvantages in poor adsorption capacity due to their low specific surface area or poor dispersion in water.17
Single-walled carbon nanotubes (SWCNTs) are hollow tubes, which are formed by crimping monolayer graphite sheet, with large specific surface area to have strong adsorption effect on toxic metal(loid)s removal. Yet, there is a strong van der Waals force between SWCNTs tubes, easily leading to their agglomerate. Both agglomeration and poor dispersibility in water reduces the effective specific surface area of SWCNTs, decreasing the adsorption efficiency on some adsorbate substances. For instance, the adsorption capacity of SWCNTs was only 33.55 mg g−1 for Pb(II) removal.18 The preparation of water-dispersible SWCNTs-based complex, therefore, is an effective way to enhance its adsorption efficiency on adsorbate. In order to further improve the adsorption capacity of SWCNTs, it was modified with some nanoparticles to remove some toxic metal(loid)s,19–22 and the adsorption efficiency of functionalized SWCNTs was increased clearly, as it was the improvement of surface adsorption potential when SWCNTs surfaces were modified with functional groups. Chen et al. also outlined absorption of Pb(II) using manganese-terephthalic acid (MOF/SWCNTs), showing that MOF/SWCNTs had a stronger adsorption ability on Pb(II) than other common toxic (loid)s.23 In order to analyze the adsorption mechanism between adsorbents and adsorbents, previous studies also indicated some theory factors, such as adsorption equilibrium, adsorption thermal effect, and adsorption kinetic theory of SWCNTs.24
Chitosan, a low-cost environmental protection biopolymer, is characterized by a large number of amino and hydroxyl groups. The lone pair electrons of chitosan nitrogen atoms can provide a promising prospect in the adsorption of toxic metal(loid)s with its applications.25–28 Thus, it is particularly important in removing pollutants from aqueous solutions. However, the adsorption capacity of chitosan was only 55 mg g−1 for Pb(II) removal. The best approach to enhance the adsorption potential of chitosan is to graft functional groups through modification and constructing nanohybrid materials with chitosan.29 For example, some studies have shown that when chitosan was loaded onto MWCNTs (multi-walled carbon nanotubes), its complex material illustrated a high adsorption capacity.30–32 Compared with chitosan, water-soluble carboxymethyl chitosan (WSCC) has a better dispersibility in water. Recent researches showed that WSCC–MWCNTs nanocomposite had a greater reusability for removal of toxic metal(loid)s.33–35 Indeed, WSCC–MWCNTs nanocomposite contains porous carbon nanotubes and lone pair electrons of nitrogen atoms, both of which have affinity on toxic ions. Compared with MWNTs or WSCC, WSCC–MWCNTs nanocomposite, thus, can provide more adsorption sites. In addition, compared with MWCNTs, SWCNTs have a stronger adsorption performance than MWCNTs due to its larger specific surface area. However, it is still limited on research of the adsorption properties of Pb(II) from water using WSCC–SWCNTs nanocomposite as adsorbent.
Therefore, it is of great practical value to modify oxidized SWCNTs (oSWCNTs) by WSCC for improving their dispersibility and adsorption capacity in water. The adsorption behavior and effect of WSCC–oSWCNTs nanocomposite towards Pb(II), thus needs to be further investigated.
2 Materials and methods
2.1 Materials
This study selected SWCNTs (CVD, 90%, diameter 1–1.2 nm, length 2–10 μm, Suiheng Technology Co., Ltd, Shenzhen of China), and a high molecular weight chitosan (Aladdin, Mn = 1.2 × 10⁵ Da, deacetylation = 80%).2.2 Instruments and equipment
The morphology and chemical characteristics of the WSCC–oSWCNTs nanocomposite was identified using various characterization techniques as follows: scanning electron microscope (SEM, S4800, Hitachi), transmission electron microscope (TEM, JEM2100Plus), Raman spectroscopy (HR800, Jobin Yvon), X-ray photoelectron spectroscopy (XPS, VG ESCALABMK II), nitrogen adsorption–desorption isotherm test (TriStar II 3020, Micromeritics), and Fourier transform infrared spectrometer (FTIR, Nicolet IS5). The concentration of metal iron was evaluated by atomic absorption spectrometry (AAS, AA320N).2.3 Experimental methods
 | (1) |
 | (2) |
3 Results and discussion
3.1 Characterization of SWCNTs, oSWCNTs, and WSCC–oSWCNTs nanocomposite
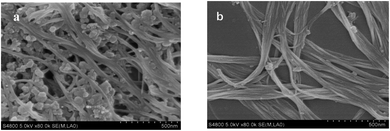
SEM images of SWCNTs and oSWCNTs are shown in Fig. 2. As being illustrated in Fig. 2a and b, nitric acid treatment showed the effectiveness of the purification process. SWCNTs are somewhat fuzzy, as there were other carbon impurities distributed between the bundles of SWCNTs (Fig. 2a). The image (Fig. 2b) of oSWCNTs is clearer than that of Fig. 2a, because the impurity carbon particles were further reduced (Fig. 2b), and oSWCNTs bundles with smaller pipe diameter are observed more clearly, indicating that a large amount of carbon impurities in the sample were effectively removed by acidification treatment. Meanwhile, both the surface adsorption efficiency and the dispersibility of oSWCNTs increased with the weakening of the van der Waals forces among SWCNTs.40The combination behavior of WSCC on SWCNTs was observed by TEM. Based on the Fig. S1,† the surface of oSWCNTs is uneven because of the uniform scattering of WSCC on it, indicating that both WSCC and oSWCNTs were combined together through the p–π conjugate.41 Indeed, the introduction of WSCC on oSWCNTs increased its dispersion in water solution, further leading to enhance its adsorption capacity.
Raman spectroscopy is a valuable tool for characterizing carbon-based nanostructures. Raman spectra of SWCNTs shows two vibration peaks between 1000–2000 cm−1, and the peaks of D and G peaks are about at 1350 cm−1 and 1580 cm−1, respectively. D peak is usually attributed to the presence of amorphous or disordered carbon in SWCNTs, and the strength ratio (ID/IG) further explains both the defects and performance indicators of SWCNTs.42
Fig. S2† shows the Raman spectra of SWCNTs, oSWCNTs, and WSCC–oSWCNTs nanocomposite at the excitation wavelength of 633 nm. The ID/IG ratio of oSWCNTs (0.084) is higher than that of SWCNTs (0.060), indicating that amorphous carbon was removed, and side wall defects were generated after acid treatment of SWCNTs. This improved the dispersibility of oSWCNTs in aqueous solution. Similarly, the ID/IG ratio of WSCC–oSWCNTs nanocomposite (0.092) is higher than that of oSWCNTs, which also led to more defects in the side walls of oSWCNTs. This could be attributed to the electrostatic interaction between the oSWCNTs and WSCC40 to improve the dispersibility of WSCC–oSWCNTs nanocomposite in aqueous solution, thus enhancing its absorption capacity towards absorbates.
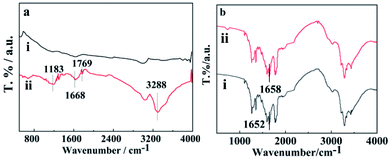
Fig. 3a shows the FTIR spectra of SWCNTs and oSWCNTs. Compared with the FTIR spectra of SWCNTs, the appearance of new bands at 1183 cm−1, 1769 cm−1, and 3288 cm−1 is noticed at that of oSWCNTs. The first band is attributed to the C–O stretching of oSWCNTs, while the last two bands are associated with the C![[double bond, length as m-dash]](https://www.rsc.org/images/entities/char_e001.gif) O and O–H stretching of the –COOH group. The appearance of these bands indicates that SWCNTs were successfully oxidized. This is consistent with the conclusion of Raman spectroscopy in this study.
O and O–H stretching of the –COOH group. The appearance of these bands indicates that SWCNTs were successfully oxidized. This is consistent with the conclusion of Raman spectroscopy in this study.
Furthermore, FTIR was used to confirm the charge transfer interaction between the nanotubes and polymers.43 Fig. 3b shows the FTIR spectra of WSCC and WSCC–oSWCNTs nanocomposite, founding the N–H characteristic absorption peak blue-shifts from 1652 cm−1 in the WSCC sample to 1658 cm−1 in the WSCC–oSWCNTs nanocomposite. The weakness of N–C bonds was ascribed to both a result of lone electron pair transfer from the WSCC to oSWCNTs and the p–π interaction of oSWCNTs with WSCC.44 This is reasonable to assume that WSCC was successful in combination with the oSWCNTs to form a stable nanocomposite, the WSCC–oSWCNTs nanocomposite as a novel kind of heavy metal ions adsorbent was obtained.
The N2 adsorption–desorption isotherms of SWCNTs, oSWCNTs and WSCC–oSWCNTs nanocomposite are presented in Fig. 4a. The surface areas of SWCNTs, oSWCNTs and WSCC–oSWCNTs nanocomposite were calculated using the model of BET. The surface area of SWCNTs (321.57 m2 g−1) is larger than that of oSWNTs (279.28 m2 g−1), but the surface area of the WSCC–oSWCNTs nanocomplex is 52.78 m2 g−1. SWCNTs illustrate the availability of more sites for oxidation through acid treatment and functionalization with WSCC due to its high surface area.18 Being compared to the SWCNTs and oSWCNTs, the low surface area of WSCC–oSWCNTs nanocomposite suggests successful consumption of active surface sites and partial possession of pore space on SWCNTs.45 All the above results illustrate that the water soluble WSCC was successful in combination with the oSWCNTs to form a stable nanocomposite, and a novel kind of heavy metal ions adsorbent was prepared successfully.
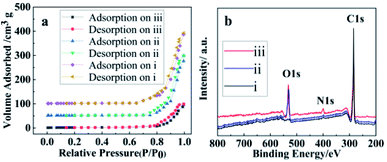 | ||
| Fig. 4 (a) Nitrogen adsorption–desorption isotherms and (b) XPS spectra of (i) SWCNTs, (ii) oSWCNTs and (iii) WSCC–oSWCNTs composite. | ||
To further confirm the successful preparation of WSCC–oSWCNTs nanocomposite. The XPS spectra of SWCNTs, oSWCNTs and WSCC–oSWCNTs nanocomposite were obtained to check the percentage of each element in the materials. Fig. 4b shows the XPS spectra of SWCNTs, oSWCNTs and WSCC–oSWCNTs nanocomposite. The XPS analysis reveals two significant peaks, C 1s and O 1s, at the surface of oSWCNTs. After treatment with WSCC, a small N 1s peak appeared in the spectra obtained for the WSCC–oSWCNTs nanocomposite, and this is a further confirmation of WSCC modification on SWCNTs.
A summary of the calculated percent compositions of C, O, and N on the surface of the WSCC–oSWCNTs nanocomposite further supports these results (Table 1), as the N 1s peak increased by 0.9% after treatment with WSCC. These results illustrate that the water soluble WSCC was successful in combination with the oSWCNTs to form a stable nanocomposite. A novel kind of heavy metal ions adsorbent was prepared successfully.
| Adsorbent | % composition | ||
|---|---|---|---|
| C | O | N | |
| oSWCNTs | 92.4 | 7.6 | |
| WSCC–oSWCNTs | 90.4 | 8.7 | 0.9 |
3.2 Adsorption of Pb(II) from water using WSCC–oSWCNTs nanocomposite
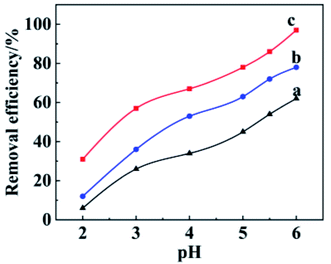 | ||
| Fig. 5 Effect of pH on Pb(II) adsorption using (a) SWCNTs, (b) oSWCNTs, and (c) WSCC–oSWCNTs complex as an adsorbent, respectively. | ||
Based on the results from Fig. 5, the removal rate of Pb(II) improves from 30% to 97% with increasing pH from 2 to 6 using WSCC–oSWCNTs nanocomposite as adsorbent (Fig. 5c), and the removal rate of oSWCNTs increases from 12% to 78% as the pH varied from 2 to 6 (Fig. 5b). Yet, the removal rate of SWCNTs increases from 6% to 59% as the pH varied from 2 to 6 (Fig. 5a). Overall, from Fig. 5a–c, with increasing the functionalization of the side wall of SWCNTs, the more defects of the SWCNTs are, and the higher adsorption performance is. Indeed, the water solubility of oSWNTs was also greatly enhanced after the modification with WSCC, which further enhanced the adsorption performance of WSCC–oSWCNTs nanocomposite. Furthermore, its adsorption performance also gradually enhanced with increasing pH value, because most of free oxygen on the adsorbent is protonated at lower pH. Consequently, since it was protonated positively charged surfaces, adsorbent repulses Pb(II) via electrostatic repulsion, leading to a low removal efficiency of Pb(II) at low pH.2 The removal efficiency of Pb(II) increased with increasing solution pH, because more adsorption sites could be obtained on the adsorbent.46 The adsorption rate of Pb(II) on WSCC–oSWCNTs nanocomposite reached up to ∼97% at pH = 6. Therefore, pH at 6 was considered as the optimum value for the rest adsorption experiments.
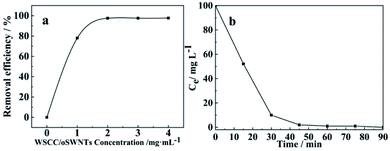
Fig. 6a illustrates that the removal rate of Pb(II) increases gradually along with the increasing of WSCC–oSWCNTs nanocomposite dosage in solution, showing 97% of Pb(II) within 90 min at 2 mg mL−1 of dosage of WSCC–oSWCNTs nanocomposite. The Pb(II) adsorption efficiency is almost still remained unchanged as further increasing the adsorbent dosage, because the WSCC–oSWCNTs nanocomposite began to agglomerate as its concentration continuously increased in the solution, and its effective adsorption surface area decreased.2 Thus, the optimal concentration of WSCC–oSWCNTs nanocomposite was considered as 2 mg mL−1 for the rest study.
In addition, both the pseudo-first-order and pseudo-second-order models can be used to describe the adsorption rate and mechanism.48,49 The pseudo-first-order kinetics follows a monolayer physical absorption process with diffusion as a rate-determining step, as being illustrated in eqn (3),50 and the pseudo-second-order kinetics follows a multilayer chemical absorption process, as being shown in eqn (4).51
ln(qe − qt) = ln![[thin space (1/6-em)]](https://www.rsc.org/images/entities/char_2009.gif) qe − k1t qe − k1t
| (3) |
 | (4) |
The adsorption kinetics of WSCC–oSWCNTs nanocomposite toward Pb(II) were calculated by pseudo-first-order and pseudo-second-order kinetic models. Fig. 7 was drawn according the average intermittent adsorption equilibrium data of adsorption equilibrium Pb(II) at different time. Two kinetic models were discussed according to eqn (3) and (4). The most suitable model was selected according to the value of the highest determination coefficient (R2).
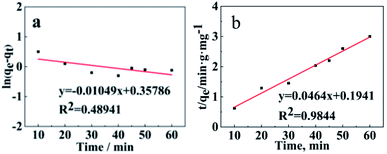 | ||
| Fig. 7 (a) Pseudo-first-order and (b) pseudo-second-order models of Pb(II) adsorption using WSCC–oSWCNTs complex as an adsorbent. | ||
Adsorption experiments were carried out at 303 K using WSCC–oSWCNTs nanocomposite dose of 200 mg and initial Pb(II) dose of 10 mg in a 100 mL solution for 60 min. As being compared with the pseudo-second-order kinetics, the R2 of the pseudo-first-order kinetics was significantly (R2 < 0.5) smaller, and its adsorption fitting was not ideal, indicating that the adsorption process follows the second-order-kinetics adsorption. qe values (Table S1†) calculated using the pseudo-second-order adsorption kinetic model was found to be similar to experimental value (calculated using eqn (1)) of adsorption capacity. Therefore, the adsorption process of heavy-Pb(II) on WSCC–oSWCNTs nanocomposite can be well explained by pseudo-second-order kinetics and is governed by chemisorption. Moreover, according to the actual water quality and the requirement of Pb(II) equilibrium quantity, thus, this fitting equation can be used to determine the quantity of WSCC–oSWCNTs nanocomposite should be applied.
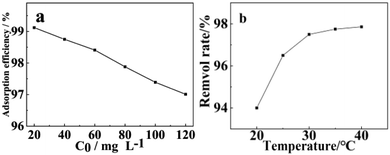 | ||
| Fig. 8 Effect of (a) initial concentration of Pb(II) and (b) temperature on the adsorption behavior of WSCC–oSWCNTs complex. | ||
When adsorption process reaches equilibrium, adsorption isotherms can be used to explain the adsorption distribution or pattern of Pb(II) on WSCC–oSWCNTs nanocomposite, providing the adsorption capacity of WSCC–oSWCNTs nanocomposite. Langmuir isotherm, Freundlich isotherm, Temkin isotherm, and Dubinin–Radusckevisch–Kanager isotherm are generally used as the isotherm models. Langmuir isotherm indicates the monolayer adsorption on the surface of WSCC–oSWCNTs nanocomposite with being equally distributed adsorption energy, as being showed in eqn (5). Freundlich isotherm indicates a non-uniform multilayer adsorption with various adsorption energy, as being expressed using eqn (6).52 Temkin isotherm postulates that the heat of adsorption of all molecules would decrease with increasing surface coverage linearly, as being given by the eqn (7).53 Dubinin–Radushkevich model can used to identify whether the process is chemical adsorption or physical adsorption, the linearized form of this model is expressed with eqn (8)–(10).53
 | (5) |
 | (6) |
qe = k1(ln![[thin space (1/6-em)]](https://www.rsc.org/images/entities/char_2009.gif) k2) + k1 k2) + k1![[thin space (1/6-em)]](https://www.rsc.org/images/entities/char_2009.gif) ln ln![[thin space (1/6-em)]](https://www.rsc.org/images/entities/char_2009.gif) ce ce
| (7) |
ln![[thin space (1/6-em)]](https://www.rsc.org/images/entities/char_2009.gif) qe = −βε2 + ln qe = −βε2 + ln![[thin space (1/6-em)]](https://www.rsc.org/images/entities/char_2009.gif) q(D–R) q(D–R)
| (8) |
 | (9) |
 | (10) |
Fig. 9 shows the average intermittent adsorption equilibrium data of Pb(II) from water using WSCC–oSWCNTs nanocomposite as an adsorbent. Four adsorption isotherm models were illustrated according to eqn (5)–(10).
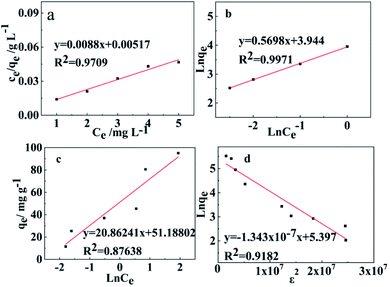 | ||
| Fig. 9 (a) Langmuir, (b) Freundlich, (c) Temkin, and (d) Dubinin–Radusckevisch–Kanager adsorption isotherms for the adsorption of Pb(II) using WSCC–oSWCNTs complex as an adsorbent. | ||
Adsorption experiments were carried out at 303 K using the WSCC–oSWCNTs nanocomposite dose of 200 mg, and initial Pb(II) dose of 10 mg in a 100 mL solution for 45 min. Adsorption data were fit on all studied adsorption isotherms and are displayed in Fig. 9 and Table S2.† It can be found that the adsorption of Pb(II) by WSCC–oSWCNTs nanocomposite conforms to both Langmuir isothermal adsorption model and Freundlich isothermal adsorption model. The adsorption process includes both monolayer and multilayer adsorption, but multimolecular layer adsorption is dominant. Meanwhile, the adsorption process of Pb(II) on WSCC–oSWCNTs nanocomposite is very complex, which may include various adsorption mechanisms such as ion exchange process (COOH–Pb(II)), electrostatic attraction process (Coulomb attraction), and complexation (N–Pb(II) coordination bond). The maximum adsorption capacity by fitting Langmuir model (qm) was 113.63 mg g−1. The adsorption capacity of the WSCC–oSWCNTs nanocomposite was also compared to those of other adsorbents from the literature (Table 2)2,18,29,54–62 for Pb(II) removal from water. These observations indicate the potential of WSCC–oSWCNTs nanocomposite for Pb(II). Constant 1/n by fitting Freundlich model was 0.57, indicating that the adsorption of WSCC–oSWCNTs nanocomposite on Pb(II) easily occurs. This, thus, highlights that the adsorbent of WSCC–oSWCNTs nanocomposite has a strong adsorption capacity for Pb(II). A positive heat of adsorption β value from the Temkin isotherm supports the endothermic behavior of adsorption,63 and the calculated value of E from the Dubinin–Radusckevisch–Kanager isotherm also suggests the chemisorption nature of adsorption. Therefore, these observations proposed multilayer adsorption of Pb(II) on heterogeneous sites following chemisorption.
| Adsorbent | Adsorption capacity (mg g−1) | References |
|---|---|---|
| CAU-7-TATB | 63 | 54 |
| Activated alumina | 83 | 55 |
| Conjugate adsorbent | 188.67 | 56 |
| Anaerobically digested sludge | 126 | 57 |
| Biochar | 106.39–168.05 | 58 |
| Oak wood ash/GO/Fe3O4 | 47.16 | 59 |
| Polymeric nanocomposite | 256.4–476 | 60 |
| Calcined clay | 10.2–34.08 | 61 |
| Fe3O4@TATS@ATA | 205.2 | 62 |
| Chitosan | 55 | 29 |
| SWCNT | 33.55 | 18 |
| MoS2/SH-MWCNTs | 90.0 | 2 |
| WSCC–oSWCNTs complex | 113.63 | In this study |
Fig. 8b shows the adsorption results of WSCC–oSWCNTs nanocomposite on Pb(II) in solution at various temperature. It was observed that the adsorption capacity of WSCC–oSWCNTs nanocomposite increased with increasing adsorption temperature, and its maximum adsorption capacity appeared at 30 °C. The adsorption effect of WSCC–oSWCNTs nanocomposite at higher temperatures was greater because of the decreased viscosity of Pb(II) at higher temperatures, faster movement speed of Pb(II), and the reduced mass transfer resistance. In addition, more active sites were released due to both the higher the temperature and the easier the deprotonation reaction, thus improving the adsorption effect of WSCC–oSWCNTs nanocomposite on Pb(II). However, WSCC–oSWCNTs nanocomposite was easily agglomerated with increasing temperature. This effect was due to the reduced the surface area of WSCC–oSWCNTs nanocomposite, and the combined effect of both factors that the adsorption capacity stabilized at 30 °C.
In addition, the influence of temperature on adsorption behavior was further investigated using Gibbs–Helmholtz formula (eqn (11) and (12)).
| ΔG = ΔH − TΔS | (11) |
 | (12) |
According to eqn (8), the linear equation of ln![[thin space (1/6-em)]](https://www.rsc.org/images/entities/char_2009.gif) kd changing with 1/T was obtained, as being showed in Fig. S3† that three thermodynamic parameters at different temperatures were calculated and shown in Table S3.†
kd changing with 1/T was obtained, as being showed in Fig. S3† that three thermodynamic parameters at different temperatures were calculated and shown in Table S3.†
As being shown in Table S3,† ΔH was greater than zero, indicating that the adsorption process is endothermic. Therefore, the adsorption quantity increases with increasing temperature. Yet, a positive value of ΔS also implies an increased disorder at the solid/liquid interface.2 ΔG was less than zero at all temperature, indicating the feasibility and spontaneity of the adsorption process. With increased temperature, a continuous decrease in ΔG value highlights that the adsorption process is more promising under high-temperature condition.
3.3 Desorption and recycling studies
To perform the regeneration ability of WSCC–oSWCNTs nanocomposite, desorption tests were achieved using HCl.61 To evaluate the reusability of the WSCC–oSWCNTs nanocomposite, it was subjected to several loadings with the Pb(II) solution and subsequent elution. The results displayed that the recovery of Pb(II) was constant (82.5%) even after 4 successive cycles of adsorption/desorption process (Fig. 10a). Meanwhile, there was no significant change in the FTIR spectra of WSCC–oSWCNTs nanocomposite (a) before and (b) after 4 successive cycles of adsorption/desorption process for Pb(II) in Fig. S4,† suggesting that the stability of WSCC–oSWCNTs nanocomposite is good for practical applications.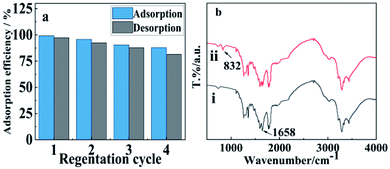 | ||
| Fig. 10 (a) Recycling studies and (b) FT-IR spectra of WSCC–oSWCNTs (i) before and (ii) after adsorption for Pb(II). | ||
3.4 Effect of interfering ions on Pb(II) removal
Several types of co-existing ions such as Na+, K+, Ca2+, Mg2+, Cd2+, Hg2+, Al3+, and Cr3+ are existed in the groundwater. These ions effects were investigated to evaluate the Pb(II) ions selectivity by WSCC–oSWCNTs nanocomposite. The data clarified that these common ions were not obviously affected the Pb(II) ions adsorption as being depicted in Table S4.† However, the selectivity of WSCC–oSWCNTs nanocomposite for Pb(II) is very obvious. Therefore, the Pb(II) ions were preferably adsorbed by WSCC–oSWCNTs nanocomposite.3.5 Adsorption mechanism
Isotherm studies showed that the adsorption of WSCC–oSWCNTs nanocomposite on Pb(II) was suitable for both Langmuir isothermal adsorption model and Freundlich isothermal adsorption model, so the adsorption process includes both monolayer adsorption and multilayer adsorption. Yet multimolecular layer adsorption was dominant. To gain the detailed information of the interaction, FTIR spectra were carried out in Fig. 10b. The peak attributes to N–H stretching vibration of WSCC–oSWCNTs nanocomposite weakens at 1658 cm−1, and a new peak at 832 cm−1 is observed after Pb(II) adsorption, suggesting that the inner adsorption of WSCC–oSWCNTs nanocomposite on Pb(II) could be attributed to the formation of metal–N complexes between Pb(II) and WSCC–oSWCNTs nanocomposite, there is a similar conclusion in previous study.54 It has shown that amine groups of WSCC play an important role in the whole adsorption process. FTIR results were consistent with the result of pseudo-second-order kinetics model, and both of them suggest the adsorption process is chemisorption. Furthermore, the negative charges on the side walls of oSWCNTs, such as –COOH and –OH, provide electron pairs to Pb(II), contributing to the effective adsorption of Pb(II). In addition, there are ions-exchange between –COOH and Pb(II) at high pH. Similarly, these adsorption mechanisms were also illustrated in previous studies.2,64The selective adsorption of Pb(II) can be explained by the theory of hard–soft-acid–base. Due to its large volume and high polarizability, Pb(II) (compared with other metal ions in Table S4†) is classified as soft acid.54 Therefore, the bonding ability between Pb(II) and N in WSCC–oSWCNTs nanocomposite is stronger than the other metal ions do. Consequently, WSCC–oSWCNTs nanocomposite displays an ability of selective adsorption of Pb(II) in water.
4 Conclusion
Water-soluble biopolymer WSCC was prepared as a soluble dispersant. oSWCNTs were further dispersed using WSCC as a dispersant. WSCC–oSWCNTs nanocomposite was obtained as an adsorbent. It was used to study the adsorption characteristics on Pb(II) from water, as well as various adsorption parameters such as pH, contact time, initial Pb(II) concentration, dosage of WSCC–oSWCNTs nanocomposite, and adsorption temperature. Adsorption capacity of WSCC–oSWCNTs nanocomposite on Pb(II) was 113.63 mg g−1. The adsorption process was found to be perfectly fitted to pseudo-second-order kinetic model, and isotherm study further showed that the adsorption process using the Langmuir, Freundlich, Temkin and Dubinin–Radusckevisch–Kanager isotherm models, revealed a multilayer chemisorption process. FTIR further confirmed the result of the chemisorption process. The higher adsorption efficiency of WSCC–oSWCNTs nanocomposite on Pb(II) was a result of ion-exchange, electrostatic interaction, and metal complexes formation between WSCC–oSWCNTs nanocomposite and Pb(II).Funding
This work was supported by the Natural Science Foundation of Heilongjiang Province of China (LH2019B012).Conflicts of interest
No potential conflict of interest was reported by the authors.Acknowledgements
This work was supported by the Start-up Program in Heilongjiang Bayi Agricultural University (XDB201815), the Talent Development Program in Heilongjiang Bayi Agricultural University (ZRCPY201818), and Scientific Planning Guide the Project of Daqing (No. zd-2021-63).References
- S. Bolisetty, M. Peydayesh and R. Mezzenga, Chem. Soc. Rev., 2019, 48(2), 463–487 RSC.
- R. Gusain, N. Kumar, E. Fosso-Kankeu and S. S. Ray, ACS Omega, 2019, 4, 13922–13935 CrossRef CAS PubMed.
- L. Chen, J. Wang, J. Beiyuan, X. Guo, H. Wu and L. Fang, Sci. Total Environ., 2021, 151556 Search PubMed.
- D. T. Sun, L. Peng, W. S. Reeder, S. M. Moosavi, D. Tiana, D. K. E. Oveisi and W. L. Queen, ACS Cent. Sci., 2018, 4(3), 349–356 CrossRef CAS PubMed.
- J. Liu, Z. Zhao and G. Jiang, Environ. Sci. Technol., 2008, 42(18), 6949–6954 CrossRef CAS PubMed.
- Y. Imoto, T. Yasutaka, M. Someya and K. Higashino, Sci. Total Environ., 2018, 624, 96–105 CrossRef CAS PubMed.
- S. Lee, E. Lee, J. Ra, B. Lee, S. Kim, S. H. Choi, S. D. Kim and J. Cho, Desalination, 2008, 221(1–3), 244–252 CrossRef CAS.
- S. M. El-Sheikh, A. B. Azzam, R. A. Geioushy, F. M. El-Dars and B. A. Salah, J. Alloys Compd., 2021, 857, 157513 CrossRef CAS.
- R. A. Geioushy, S. M. El-Sheikh, A. B. Azzam, B. A. Salah and F. M. El-Dars, J. Hazard. Mater., 2020, 381, 120955 CrossRef CAS PubMed.
- V. B. Gde, J. R. de Andrade, M. G. C. da Silva and M. G. A. Vieira, Environ. Chem. Lett., 2020, 18, 1145–1168 CrossRef.
- P. Kulal and V. Badalamoole, Int. J. Biol. Macromol., 2020, 165, 542–553 CrossRef CAS PubMed.
- H. G. Park, T. W. Kim, M. Y. Chae and I. K. Yoo, Process Biochem., 2007, 42(10), 1371–1377 CrossRef CAS.
- U. Farooq, J. A. Kozinski, M. A. Khan and M. Athar, Bioresour. Technol., 2010, 101(14), 5043–5053 CrossRef CAS PubMed.
- R. R. Mohamed, M. H. Abu Elella, M. W. Sabaa and G. R. Saad, Cellulose, 2018, 25(11), 6513–6529 CrossRef CAS.
- S. Radi, Y. Toubi, M. Bacquet, s. Degoutin and F. Cazier, Sep. Sci. Technol., 2013, 48(9), 1349–1355 CrossRef CAS.
- A. Bessa, G. Gonçalves, B. Henriques, E. M. Domingues, E. Pereira and P. A. A. P. Marques, Nanomaterials, 2020, 10(8), 1474 CrossRef CAS PubMed.
- A. E. Burakov, E. V. Galunin, I. V. Burakova, A. E. Kucherova, S. Agarwal, A. G. Tkachev and V. K. Gupta, Ecotoxicol. Environ. Saf., 2018, 148, 702–712 CrossRef CAS PubMed.
- O. Moradi, Chem. Biochem. Eng. Q., 2011, 25(2), 229–240 CAS.
- S. S. Fiyadh, M. A. AlSaadi, W. Z. Jaafar, M. K. AlOmar, S. S. Fayaed, N. S. Mohd, L. S. Hin and A. El-Shafie, J. Cleaner Prod., 2019, 230, 783–793 CrossRef CAS.
- K. M. Lee, C. P. P. Wong, T. L. Tan and C. W. Lai, Mater. Sci. Eng., B, 2018, 236, 61–69 Search PubMed.
- M. A. Tahoon, S. M. Siddeeg, A. N. Salem, W. Mnif and F. Ben Rebah, Processes, 2020, 8(6), 645 CrossRef CAS.
- M. P. Ajith, M. Aswathi, E. Priyadarshini and P. Rajamani, Bioresour. Technol., 2021, 126000 CrossRef CAS PubMed.
- F. Cai, Q. Wang, X. Chen, W. Qiu, F. Zhan, F. Gao and Q. Wang, Biosens. Bioelectron., 2017, 98, 310–316 CrossRef CAS PubMed.
- S. S. Ghasemi, M. Hadavifar, B. Maleki and E. Mohammadnia, J. Water Proc. Eng., 2019, 32, 100965 CrossRef.
- A. Sadeghizadeh, F. Ebrahimi, M. Heydari, M. Tahmasebikohyani, F. Ebrahimi and A. Sadeghizadeh, J. Environ. Manage., 2019, 232, 342–353 CrossRef CAS PubMed.
- K. Divya and M. S. Jisha, Environ. Chem. Lett., 2018, 16(1), 101–112 CrossRef CAS.
- A. Rampino, M. Borgogna, P. Blasi, B. Bellich and A. Cesaro, Int. J. Pharm., 2013, 455(1–2), 219–228 CrossRef CAS PubMed.
- S. Naskar, S. Sharma and K. Kuotsu, J. Drug Delivery Sci. Technol., 2019, 49, 66–81 CrossRef CAS.
- M. Benavente, L. Moreno and J. Martinez, J. Taiwan Inst. Chem. Eng., 2011, 42(6), 976–988 CrossRef CAS.
- M. Guo, J. Wang, C. Wang, P. J. Strong, P. Jiang, Y. S. Ok and H. Wang, Sci. Total Environ., 2019, 682, 340–347 CrossRef CAS PubMed.
- C. Jung, J. Heo, J. Han, N. Her, S. J. Lee, J. Oh, J. Ryu and Y. Yoon, Sep. Purif. Technol., 2013, 106, 63–71 CrossRef CAS.
- M. M. A. Aslam, W. Den and H. W. Kuo, J. Water Proc. Eng., 2021, 40, 101793 CrossRef.
- A. ZabihiSahebi, S. Koushkbaghi, M. Pishnamazi, A. Askari, R. Khosravi and M. Irani, Int. J. Biol. Macromol., 2019, 140, 1296–1304 CrossRef CAS PubMed.
- Y. Huang, X. Lee, F. C. Macazo, M. Grattieri, R. Cai and S. D. Minteer, Chem. Eng. J., 2018, 339, 259–267 CrossRef CAS.
- N. Abdolhi, A. Soltani, H. Khandan Fadafan, V. Erfani-Moghadam, A. D. Khalaji and H. Balakheyli, Nano-Struct. Nano-Objects, 2017, 12, 182–187 CrossRef CAS.
- N. A. Abdelwahab and F. M. Helaly, J. Ind. Eng. Chem., 2017, 50, 162–171 CrossRef CAS.
- Y. Wang, P. Zhou, D. Xiao, Y. Zhu, Y. Zhong, J. Zhang, X. Sui, X. Feng, H. Xu and Z. Mao, Carbohydr. Polym., 2019, 221, 202–208 CrossRef CAS PubMed.
- T. Baran, A. Menteş and H. Arslan, Int. J. Biol. Macromol., 2015, 72, 94–103 CrossRef CAS PubMed.
- K. S. Zhang, D. Pham, O. Lawal, S. Ghosh, V. S. Gangoli, P. Smalley, K. Kennedy, B. E. Brinson, W. E. Billups, R. H. Hauge, W. W. Adams and A. R. Barron, ACS Appl. Mater. Interfaces, 2017, 9(43), 37972–37980 CrossRef CAS PubMed.
- M. Ashino, A. Schwarz, T. Behnke and R. Wiesendanger, Phys. Rev. Lett., 004, 93(13), 136101 CrossRef PubMed.
- M. Naito, K. Nobusawa, H. Onouchi, M. Nakamura, K. Yasui, A. Ikeda and M. Fujiki, J. Am. Chem. Soc., 2008, 130(49), 16697–16703 CrossRef CAS PubMed.
- G. Gordeev, A. Jorio, P. Kusch, B. G. M. Vieira, B. Flavel, R. Krupke, E. B. Barros and S. Reich, Phys. Rev. B, 2017, 96(24), 245415 CrossRef.
- L. Y. Yan, Y. F. Poon, M. B. Chan-Park, Y. Chen and Q. Zhang, J. Phys. Chem. C, 2008, 112(20), 7579–7587 CrossRef CAS.
- Z. Ounaies, C. Park, K. E. Wise, E. J. Siochi and J. S. Harrison, Compos. Sci. Technol., 2003, 63(11), 1637–1646 CrossRef CAS.
- B. Adeniran and R. Mokaya, J. Mater. Chem. A, 2015, 3(9), 5148–5161 RSC.
- M. H. Dehghani, M. M. Taher, A. K. Bajpai, B. Heibati, I. Tyagi, M. Asif, S. Agarwal and V. K. Gupta, Chem. Eng. J., 2015, 279, 344–352 CrossRef CAS.
- M. Zhang, Y. Liu, T. Li, W. Xu, B. Zheng, X. Tan, H. Wang, Y. Guo, F. Guo and S. Wang, RSC Adv., 2015, 5(58), 46955–46964 RSC.
- C. W. Cheung, J. F. Porter and G. McKay, Water Res., 2001, 35(3), 605–612 CrossRef CAS PubMed.
- M. Sekar, V. Sakthi and S. Rengaraj, J. Colloid Interface Sci., 2004, 279(2), 307–313 CrossRef CAS PubMed.
- O. Valsson and M. Parrinello, J. Chem. Theory Comput., 2013, 9(12), 5267–5276 CrossRef CAS PubMed.
- Y. S. Ho and G. McKay, Process Biochem., 1999, 34(5), 451–465 CrossRef CAS.
- J. Shang, M. Zong, Y. Yu, X. Kong, Q. Du and Q. Liao, J. Environ. Manage., 2017, 197, 331–337 CrossRef CAS PubMed.
- O. Ali and S. Mohamed, Turk. J. Chem., 2017, 41(6), 967–986 CrossRef CAS.
- R. Zhang, Y. Liu, Y. An, Z. Wang, P. Wang, Z. Zhen, X. Qin, X. Zhang, Y. Dai and B. Huang, Colloids Surf., A, 2019, 560, 315–322 CrossRef CAS.
- T. K. Naiya, A. K. Bhattacharya and S. K. Das, J. Colloid Interface Sci., 2009, 333(1), 14–26 CrossRef CAS PubMed.
- M. R. Awual, Chem. Eng. J., 2016, 289, 65–73 CrossRef CAS.
- B. J. Ni, Q. S. Huang, C. Wang, T. Y. Ni, J. Sun and W. Wei, Chemosphere, 2019, 219, 351–357 CrossRef CAS PubMed.
- A. H. Omidi, M. Cheraghi, B. Lorestani, S. Sobhanardakani and A. Jafari, Environ. Sci. Pollut. Res., 2019, 26(27), 27905–27914 CrossRef CAS PubMed.
- R. Pelalak, Z. Heidari, S. M. Khatami, T. A. Kurniawan, A. Marjani and S. Shirazian, Arabian J. Chem., 2021, 14(3), 102991 CrossRef CAS.
- M. Naushad, T. Ahamad and K. M. Al-Sheetan, J. Hazard. Mater., 2021, 407, 124816 CrossRef CAS PubMed.
- L. Khalfa, A. Sdiri, M. Bagane and M. L. Luisa, J. Cleaner Prod., 2021, 278, 123935 CrossRef CAS.
- A. A. Alqadami, M. Naushad, Z. A. ALOthman, M. Alsuhybani and M. Algamdi, J. Hazard. Mater., 2020, 389, 121896 CrossRef CAS PubMed.
- M. A. Ahmad, N. A. A. Puad and O. S. Bello, Water Resources and Industry, 2014, 6, 18–35 CrossRef.
- J. W. Shim, S. J. Park and S. K. Ryu, Carbon, 2001, 39(11), 1635–1642 CrossRef CAS.
Footnote |
| † Electronic supplementary information (ESI) available. See DOI: 10.1039/d2ra00066k |
| This journal is © The Royal Society of Chemistry 2022 |


