
 Open Access Article
 This Open Access Article is licensed under a Creative Commons Attribution-Non Commercial 3.0 Unported Licence
Hot spot formation and initial chemical reaction of PETN containing nanoscale spherical voids under high shock loading†
Yaping Zhang ab,
Tao Wang*a and
Yuanhang He*c
ab,
Tao Wang*a and
Yuanhang He*c
aInstitute of Intelligent Manufacturing Technology, Shenzhen Polytechnic, Shenzhen, 518055, China. E-mail: charlietree@szpt.edu.cn
bShenzhen Institutes of Advanced Technology, Chinese Academy of Sciences, Shenzhen, 518055, China
cState Key Laboratory of Explosion Science and Technology, Beijing Institute of Technology, Beijing 100081, China. E-mail: heyuanhang@bit.edu.cn
First published on 8th April 2022
Abstract
The initial response process of PETN containing nanoscale spherical cavities under impact loading was investigated using the ReaxFF-lg force field combined with the molecular dynamic method. The impact-induced void collapse process, hot spot formation and growth, and chemical reaction processes were determined. The hot spot formation goes through four stages: (1) overall temperature rise due to initial impact compression; (2) temperature rise on the upper surface of the void caused by local plastic deformation; (3) rapid temperature rise caused by molecules entering the interior of the void colliding with the downstream surface of the void; and (4) thermal diffusion between the hot spot and the surrounding region, resulting in a decrease in the temperature of the center of the hot spot and a slow increase in the temperature of the neighboring region. With weak impact, the void shape remains basically symmetric during the void collapse, and the void collapse is mainly caused by local plastic deformation. A strong impact will lead to a more intense material focusing. The void collapse caused by strong impact has a greater effect on the heating of the surrounding material, and the secondary compression formed by the collision between particles makes the hot spot area expand and the central region of the hot spot evolve into an approximate triangular cone. NO2 is produced in large quantities as the initial product during the void collapse to form the hot spot, indicating that the void activates the chemical reactivity of the PETN crystal.
1. Introduction
One of the core problems in detonation theory research is on understanding the initial chemical response of energetic materials in the condensed phase and the detonation process of energetic materials under shock or thermal loading. The coupling of load, mechanical response, and chemical reaction makes the study of this process extremely challenging. Most condensed energetic materials introduce some defects such as bubbles, impurities, and gaps during casting and pressing, which are beneficial to initiation under impact load.1–5 The heterogeneity of energetic materials make the mechanical energy generated by impact concentrate in a small area, which leads to the local formation of hot spots in energetic materials, stimulation of exothermic chemical reactions, further release of energy, stimulation of the rapid progress of chemical reactions, and form deflagration and detonation.6–8 In essence, hot spots are local regions of high temperature and high pressure in materials, which serve as nucleation sites for initiating and maintaining exothermic chemical reactions. After the shock loading, the shock wave interacts with the defects and forms local hot spots with the higher temperature near these areas, and the local hot spots continuously strengthen the leading shock wave to form detonation waves. Because the impact initiation process of energetic materials involves a variety of complex physical and chemical coupling effects and has a small time and space scale, most experimental and theoretical tools are not suitable for describing such heterogeneous and non-equilibrium systems. Molecular dynamics simulation method can observe the formation process of hot spots and the process of chemical reactions on the micro-scale, which provides a new way to analyze the physical and chemical processes of energetic materials under impact loading.9It is generally believed that when shock waves pass through defect areas in energetic materials, hot spots are formed, which increases the possibility of detonation.10 A large number of experiments and theoretical work11–20 show that the basic mechanism of hot spot formation and its relationship with detonation is still controversial. An et al.12–14 used the ReaxFF-MD method to simulate the generation of hot spots when the binder explosive composed of energetic materials and HTPB is impacted. The results showed that the density difference between energetic materials and HTPB always leads to hot spots at the interface between them. The simulation results of Holian et al.15 showed that the evaporation of materials into the voids during the void collapse and the subsequent recompression process were the main reasons for the formation of hot spots. Hatano16 simulated L-J system with rectangular cavities of different sizes and found that the increase of cross-sectional area perpendicular to the impact direction would increase the number of intermolecular collisions of energetic materials. Yao et al.19 proposed that the formation of hot spots should go through three processes: void collapse, heat conversion, and temperature relaxation by simulating the process of void collapse and hot spot formation caused by plastic binder explosive impact. Some scholars have also observed the formation of nano-jet in simulating the impact loading process of energetic materials with defects.21,22 Eason et al.21 studied the collapse process caused by the impact of cylindrical void in RDX crystal with various impact velocities and found that a fluid-like jet was formed during the collapse of cylindrical void in RDX crystal caused by strong impact. Nomura et al.22 thought that the nano-jet formed in the process of the void collapse was related to the enhancement of intermolecular collision by the free volume of voids, and the jet excited the vibration mode of surrounding molecules, which resulted in chemical reaction and improved the impact sensitivity. Strachan et al.23 simulated the impact compression process caused by two two-dimensional periodic RDX plates colliding with each other at different velocities and found that when the particle speed is 3 km s−1, local overheating occurs in the discontinuous parts during the impact compression process, which promotes the chemical reaction and produces a large number of small molecules such as NO2, NO and OH. Zhou et al.24 simulated the hot spot formation and chemical reaction of HMX crystal with nano-scale void under impact. The results showed that the enhancement of void size would lead to the slowdown of shock wave speed and the bending of the shock wavefront, and the hot spot formation and chemical reaction process strongly depend on void size and impact strength.
At present, the role of crystal properties in impact initiation and sensitivity is still unclear, and the analysis of hot spot critical size and impact initiation threshold is lacking. It can provide important theoretical significance for the transportation and storage of energetic materials on understanding the relationship between the initial shock threshold and the critical size of hot spots. The initial response of PETN with spherical void under shock wave is simulated. The hot spots formed by the interaction between shock wave and spherical void and the chemical reaction are analyzed.
2. Simulation details
Taking PETN as the research object, a 2 × 20 × 50 supercell (18.6054 Å × 186.054 Å × 332.015 Å) with a total of 116![[thin space (1/6-em)]](https://www.rsc.org/images/entities/char_2009.gif) 000 atoms was constructed in order to obtain higher calculation accuracy and better reflect the propagation characteristics of shock wave.7 The supercell structure was optimized by energy minimization, and then the system was placed in NVT ensemble (300 K) for 10 ps, followed by NPT (300 K, 0 GPa) for 50 ps to optimize atomic coordinates. After optimization, the density of PETN supercell was 1.789 g cm−3, which was close to the experimental density of 1.773 g cm−3.25 Spherical void is a common defect morphology of energetic materials.21 Spherical regions with radius R (R = 0.5 nm, 1 nm, 2 nm, and 3 nm) are removed from the center of the optimized PETN system to form spherical voids of different sizes.
000 atoms was constructed in order to obtain higher calculation accuracy and better reflect the propagation characteristics of shock wave.7 The supercell structure was optimized by energy minimization, and then the system was placed in NVT ensemble (300 K) for 10 ps, followed by NPT (300 K, 0 GPa) for 50 ps to optimize atomic coordinates. After optimization, the density of PETN supercell was 1.789 g cm−3, which was close to the experimental density of 1.773 g cm−3.25 Spherical void is a common defect morphology of energetic materials.21 Spherical regions with radius R (R = 0.5 nm, 1 nm, 2 nm, and 3 nm) are removed from the center of the optimized PETN system to form spherical voids of different sizes.
Through the impact loading experiment on PETN single crystal, Dick et al.26–30 found that the initial impact strength of PETN strongly depends on the orientation of crystal axis relative to the impact direction, that is, PETN is sensitive to impact in directions [110] and [001], and least sensitive to impact in direction [100]. Therefore, in order to save computing resources, the direction [001] is selected as the initial direction of impact. All particles in the system are given a speed of 1–3 km s−1 along the z negative direction to impact the reflecting wall, so as to generate a shock wave propagating along the z positive direction. In LAMMPS, the reflective wall means that if the atom moves outside the reflective wall, the reflective wall would give the particle an equivalent reverse speed, which makes the combined speed of the particle zero. The model of PETN supercell and shock compression is shown in Fig. 1. In the simulation process, the x and y directions are periodic boundary conditions, and the z-direction is a shrink-wrapped boundary condition. The system is placed under the NVE ensemble with a time step of 0.05 fs and runs for 14 ps to observe the formation process of shock-induced hot spots and chemical reactions.
 | ||
| Fig. 1 Model of shock simulation on PETN crystal containing a spherical void. Up is the particle velocity along the z-negative direction and the size is 1–3 km s−1. Us is the direction of shock wave propagation. R is the radius of the spherical VOID with sizes R = 0.5 nm, 1 nm, 2 nm, and 3 nm. | ||
All the above processes are simulated by LAMMPS32,33 software integrated with the ReaxFF-lg31 package. The ReaxFF-lg force field has been applied to hot spot formation and impact initiation34,35 of energetic materials.
3. Results and discussion
To accurately describe the hot spot formation process of PETN with spherical void induced by shock, the system is divided into two-dimensional layers, that is, the y and z directions are divided into 4 Å × 4 Å. Considering the existence of centroid speed (![[v with combining macron]](https://www.rsc.org/images/entities/i_char_0076_0304.gif) i, i = x, y, z), thermodynamic quantities such as temperature and pressure directly calculated by LAMMPS are not true values, so it is necessary to remove the influence of centroid speed.20,36 More details about the method are shown in ESI S1.†
i, i = x, y, z), thermodynamic quantities such as temperature and pressure directly calculated by LAMMPS are not true values, so it is necessary to remove the influence of centroid speed.20,36 More details about the method are shown in ESI S1.†
3.1 Influence of void size on shock response of PETN crystal
In order to study the influence of void size on shock response, PETN crystals with Up = 1 km s−1, R = 0.5 nm, 1 nm, 2 nm, and 3 nm were selected as the research objects. When the crystal collides with the reflective wall, the shock wave propagated from the bottom and reached the free surface of the upper end of the crystal at about 7.5 ps. For different R values, the corresponding Us was 3.62 km s−1, 3.59 km s−1, 3.49 km s−1 and 3.38 km s−1, respectively. It means that with the increase of void size, the shock wave speed decreases. It shows that the propagation of shock waves is disturbed by the void size, and the disturbance increases with the increase of void size.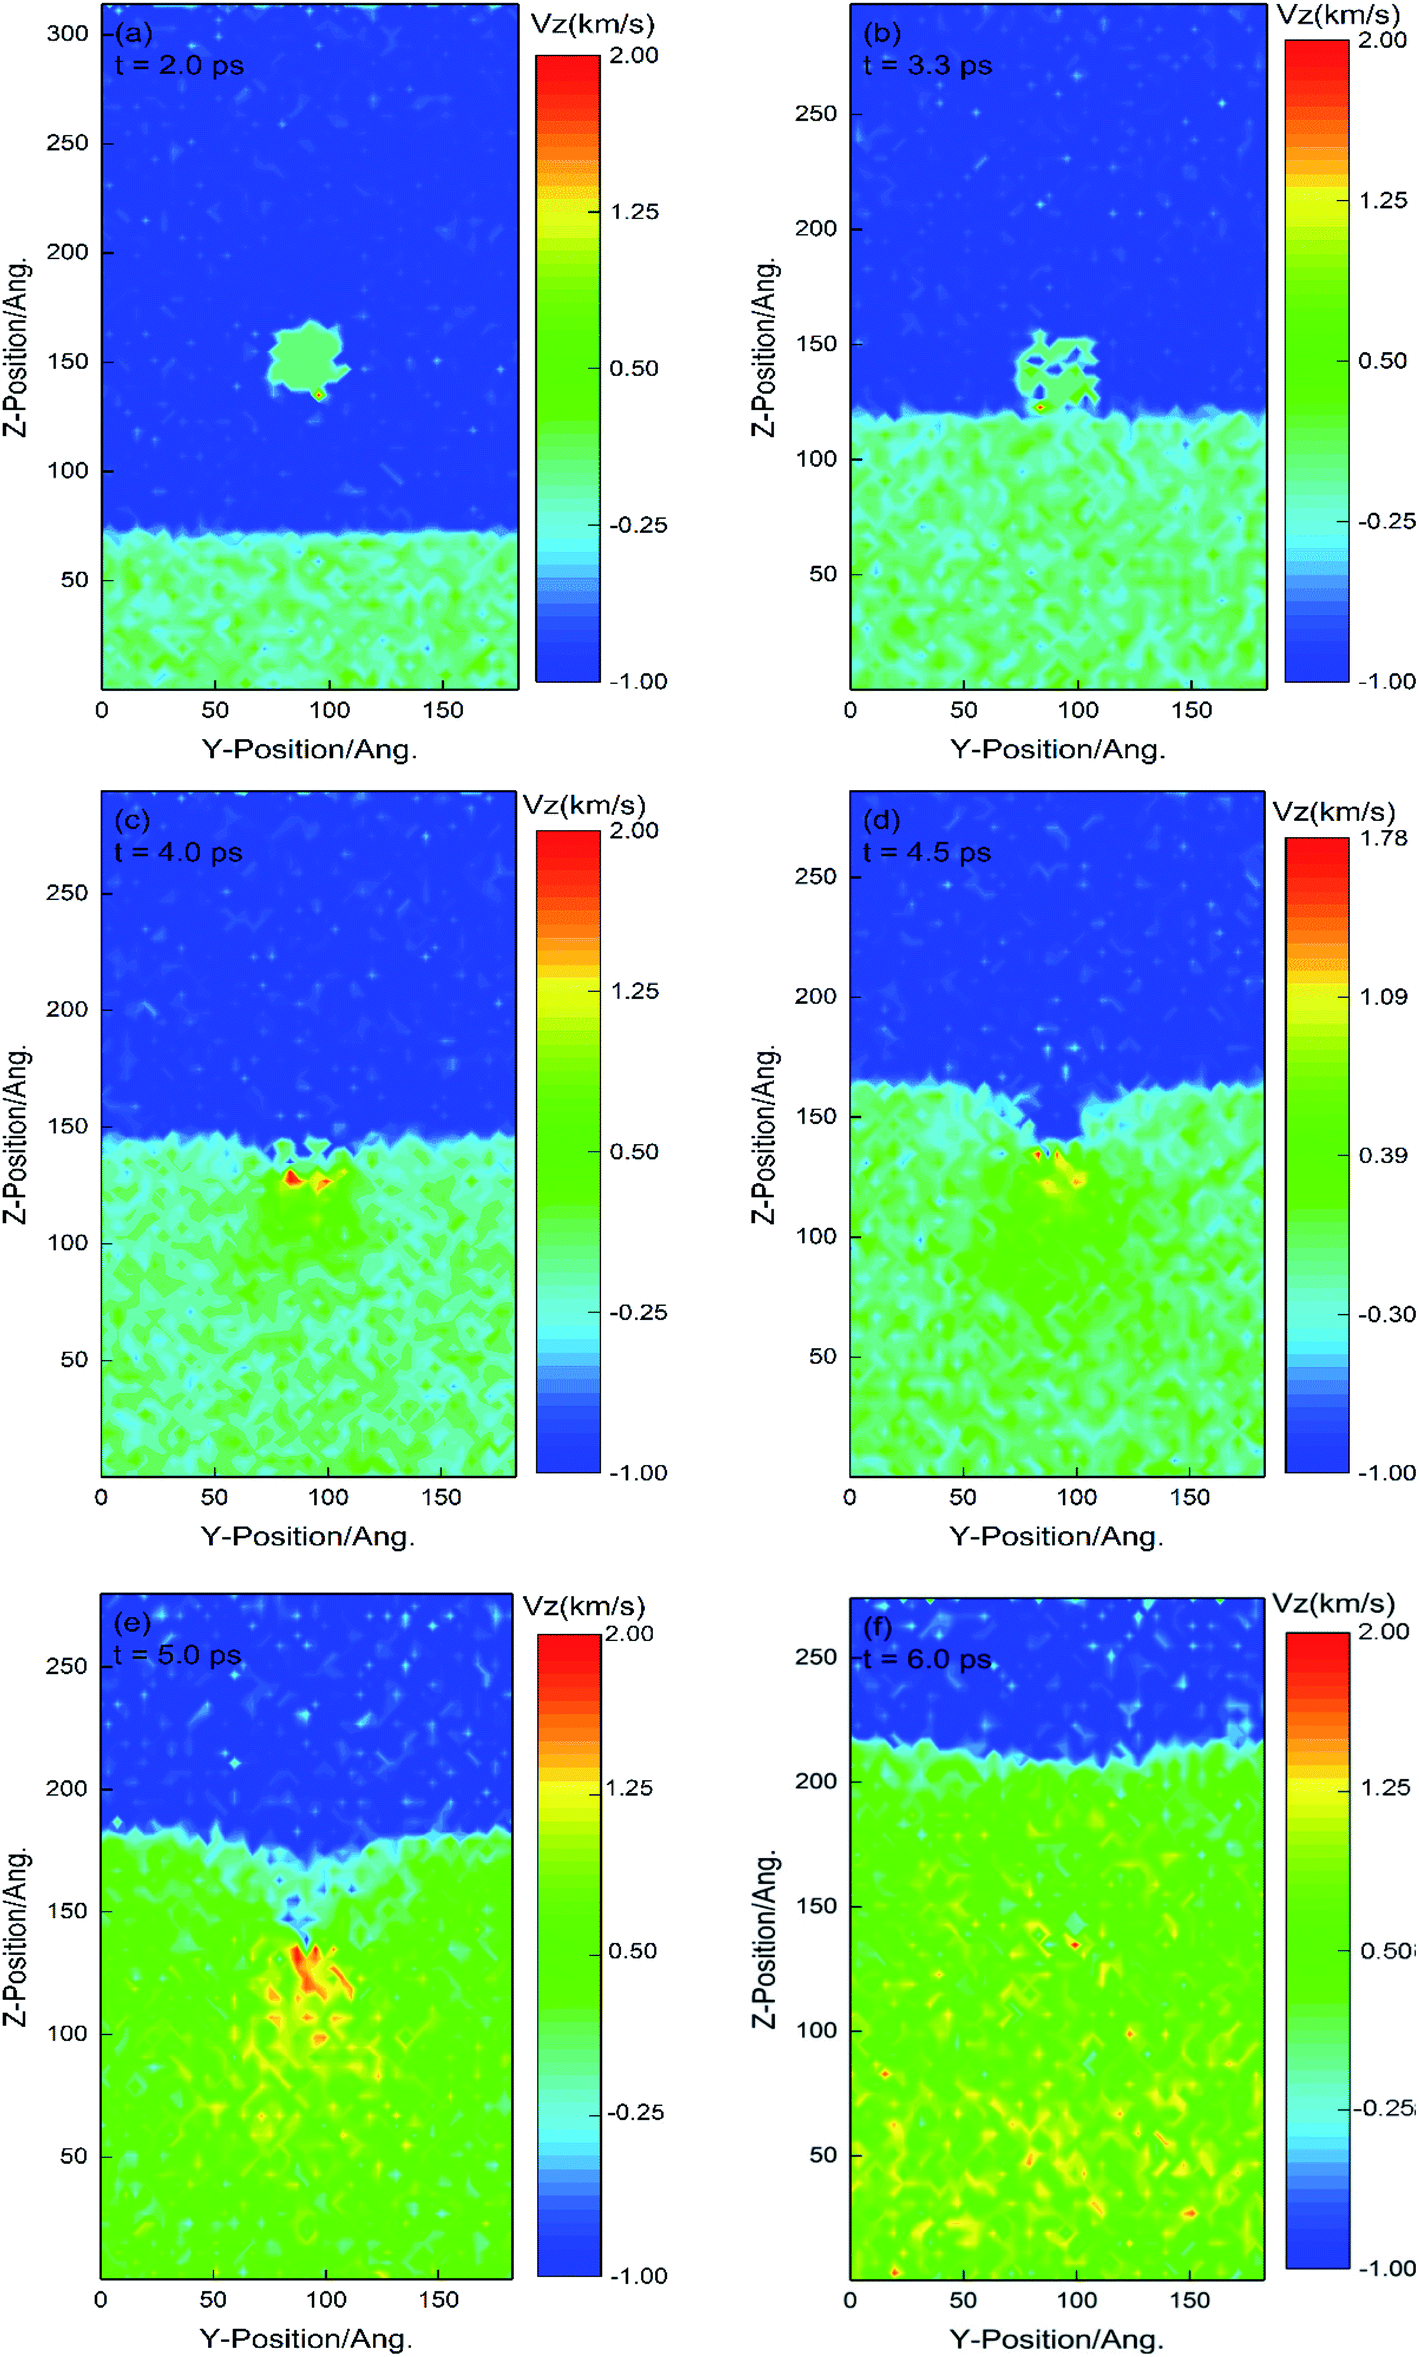 | ||
| Fig. 2 Velocity cloud in z-direction during shock wave propagation and void collapse for the vase of Up = 1 km s−1 and R = 2 nm. Panels (a–d) corresponds to the void collapse process; (e–f) corresponds to the complete collapse of the void. | ||
Some research mentioned in introduction,21,22 energetic materials exhibits hydrodynamic response during the void collapse, which is characterized by upstream materials focusing on the centerline of the void and forming hydrodynamic jets. However, the jet formation has not been observed in this part of the discussion, even though the Vz of some particles is twice the initial impact speed. This may be due to the small size of the void, and the particles colliding with each other in the void have already contacted the downstream surface of the void before they can form a jet. Throughout the whole process, the void collapse experienced three processes: (1) local plastic deformation caused by shock wave reaching the upstream surface of the void; (2) particles on both sides of the void enter the void under the action of shock wave and collide; (3) the particles entering the void continue to propagate forward until they collide with the surface molecules downstream of the void.
For PETN systems with shock velocities, Up = 1 km s−1, R = 0.5 nm, the void closure times tcollapse of 1 nm, 2 nm and 3 nm are 0.3 ps, 0.8 ps, 1.7 ps and 2.8 ps, respectively. Linear fit R and tcollapse, as shown in Fig. 3. For the PETN system with 1 μm void size, the void collapse time is 0.12 ns, which is much shorter than that of HMX system with the same size, which is 0.48 ns.24 This may be due to two reasons: (1) the impact sensitivity of PETN is higher than that of HMX; (2) the focusing effect of the spherical void is more obvious, which leads to a faster void collapse process.
 | ||
| Fig. 3 The linear fitting curve of void radius R and void collapse time tcollapse. | ||
 | ||
| Fig. 4 Spatial distributions of temperature during impact compression for the case of Up = 1 km s−1 and R = 2 nm. Panels (a–d) correspond to the void collapse process; (e–f) corresponds to the complete collapse of the void. | ||
As the particles continuously enter the void, the temperature inside the void gradually increases due to the collision between particles and chemical reactions to release heat. The further action of shock wave makes the particles in the void continue to advance to the downstream surface of the void, and collide with the downstream surface of the void at 5.0 ps, which results in a sharp increase in the internal temperature of the void (as shown in Fig. 4(c) and (d)). After the void collapses completely, the particles collide with each other to produce chemical reactions and release energy, and the internal temperature of the void is close to 2500 K. In the next 1 ps, due to the heat exchange and dissipation between the hot spot and the unignited area, the central temperature of the hot spot decreases to 1650 K, but the hot spot area gradually increases, and the temperature around the hot spot is 300 K higher than the critical temperature of ignited PETN 850 K.37
As can be seen from the temperature nephogram of the hot spot in Fig. 4, the formation of the hot spot goes through four stages: (1) the overall temperature rise caused by the initial impact compression, corresponding to Fig. 4(a); (2) temperature rise on the upper surface of the void caused by local plastic deformation, as shown in Fig. 4(b) and (c); (3) rapid temperature rise caused by molecules entering the void colliding with the downstream surface of the void, corresponding to Fig. 4(d) and (e); (4) the hot spot diffuses with the surrounding area, which makes the temperature in the center of the hot spot decrease and the temperature in the adjacent area increase slowly. Among them, (3) and (4) play a key role in the formation of hot spots. (3) Determines the center temperature of the hot spot, while (4) determines the duration of the hot spot. For comparison, the impact compression process of PETN crystals with void radii R = 0.5 nm, 1 nm, and 3 nm at an impact speed of 1 km s−1 is discussed, respectively. It is found that the hot spots of PETN systems with void radii of 0.5 nm and 1 nm will be extinguished with the impact compression process. PETN crystals with void sizes of 2 nm and 3 nm form hot spots at an impact speed of 1 km s−1. More details about the spatial–temporal temperature distribution are shown in the ESI S2.†
Shan,38 Yao19 and others believed that the nucleation and growth of hot spots formed when the void collapses completely was an important process to induce chemical reactions in the system. As mentioned above, it can be seen that the size and temperature of hot spots formed by PETN systems with different void radii are different when the void collapses, so it is necessary to study the growth process of hot spots after the void collapses.
Fig. 5 is the temperature nephogram of PETN system with void radius of 2 nm and 3 nm at impact speed of 1 km s−1, when the crystal is squeezed and stretched after the void is completely closed. The propagation of shock waves is disturbed by void size, and the disturbance increases with the increase of void size. Comparing Fig. 5(a) with Fig. 5(d), the shock wave of PETN system with void radius R = 2 nm and 3 nm reaches the free surface of the upper end of the system with 7.3 ps and 8.0 ps respectively, that is, the system reaches the maximum compression state. The temperature in the center area of the hot spot decreases slightly, which is caused by the heat exchange and dissipation between the hot spot and the surrounding area. The size of the hot spot tends to increase, and the hot spot is still close to the spherical shape, and the shape of the shock wave keeps radial symmetry.
 | ||
| Fig. 5 Spatial–temporal temperature distribution with void radius R of 2 nm and 3 nm at Up = 1 km s−1 for the maximum compression and the stretching of the crystal. (a) and (d) correspond to the maximum compression of the PETN with R = 2 nm and 3 nm, respectively; (b) and (c) correspond to the stretching phase of the PETN with R = 2 nm; (e) and (f) correspond to the stretching phase of the PETN with R = 3 nm. | ||
When the shock wave reaches the upper free surface, it reflects and forms a reverse stretching wave, which interacts with the shock wave along the z-axis in the crystal, which may make hot spots grow and form secondary hot areas.38 In the initial stretching stage, due to the mutual cancellation of the reverse stretching wave and the forward shock wave, the hot spot center temperature of PETN system with two void radii gradually decreases, as shown in Fig. 5(b) and (e). The area around the hot spot becomes larger due to the secondary shock wave produced by void collapse. Compared with the surrounding tensile material, the temperature in this area is much lower than that in the center of the hot spot, and the hot spot can still keep symmetry at this time. After that, the positive shock wave along the z-direction, the secondary shock wave formed by void collapse, and the stretching wave formed by reflection interact with each other, which makes more kinetic energy in the impact area transform into heat, and the hot spot formation turns into asymmetry. The size of hot spot decreases gradually, the temperature does not increase obviously, and the formation of secondary hot zone is not observed, which may need longer simulation time to determine. Combined with the above analysis, it can be seen that the hot spot center temperature and hot spot area increase with the increase of void size.
 | ||
| Fig. 6 Time evolution curves of major products for PETN with void radius R of 0.5 nm (a), 1 nm (b), 2 nm (c), and 3 nm (d) at Up = 1 km s−1. | ||
The fracture of the O–NO2 bond to form NO2 is one of the initial reaction mechanisms of impact PETN crystal, which is not affected by void size. CO and CO2 were not detected in the whole reaction process, which is due to: (1) a large amount of C is still concentrated in the undecomposed PETN; (2) C5H8O10N3, C5H8O8N2, C5H8O6N2 were the main intermediates of the reaction. In the PETN system with R ≥ 2 nm, a small amount of H2O is produced, which is due to the close distance between the initial NO2 and H in PETN, which will promote the production of H2O.
3.2 Effect of impact strength on impact response of PETN crystal
In order to study the effect of impact strength on shock response, PETN crystals with Up = 1 km s−1, 2 km s−1, 3 km s−1, and void radius R = 3 nm were selected as the research objects.Fig. 7 depicts the density program of the void collapse process of PETN system with a void radius of 3 nm at an impact speed of 3 km s−1. At the beginning of the shock, the PETN system is continuously compressed. As shown in Fig. 7(a), the shock wave sweeps through the area, and the density of the local area increases due to the compression of the material. When the shock wave reaches the upstream surface of the void, the particles around the void enter the void. Because there are few particles entering the void initially, the density inside the void is lower than that around the void, as shown in Fig. 7(b) and (c). After that, the particles entering the void collide continuously and squeeze twice, which makes the density of the void increase sharply within 0.5 ps. As shown in Fig. 7(d), after the void collapse is completed, the density of the void area is much higher than that of the uncompressed area and higher than that of the compressed area around the void.
 | ||
| Fig. 7 Spatial–temporal density distribution in the process of the void collapse for the case of Up = 3 km s−1, R = 3 nm. (a) represents the initial moment, (b) and (c) correspond to the particle entering the interior of the void; (d) represents the void collapse completion moments. | ||
After the void collapse, the chemical bonds of some PETN crystals near the void break, and large number of atomic groups and free atoms are formed. Then these atomic groups propagate forward at high speed under the action of shock waves, and the energy released in the propagation process may further strengthen the leading shock wave. This will make the crystal gradually transition from unstable detonation to stable detonation, and it is possible to form hot spots during the impact process.
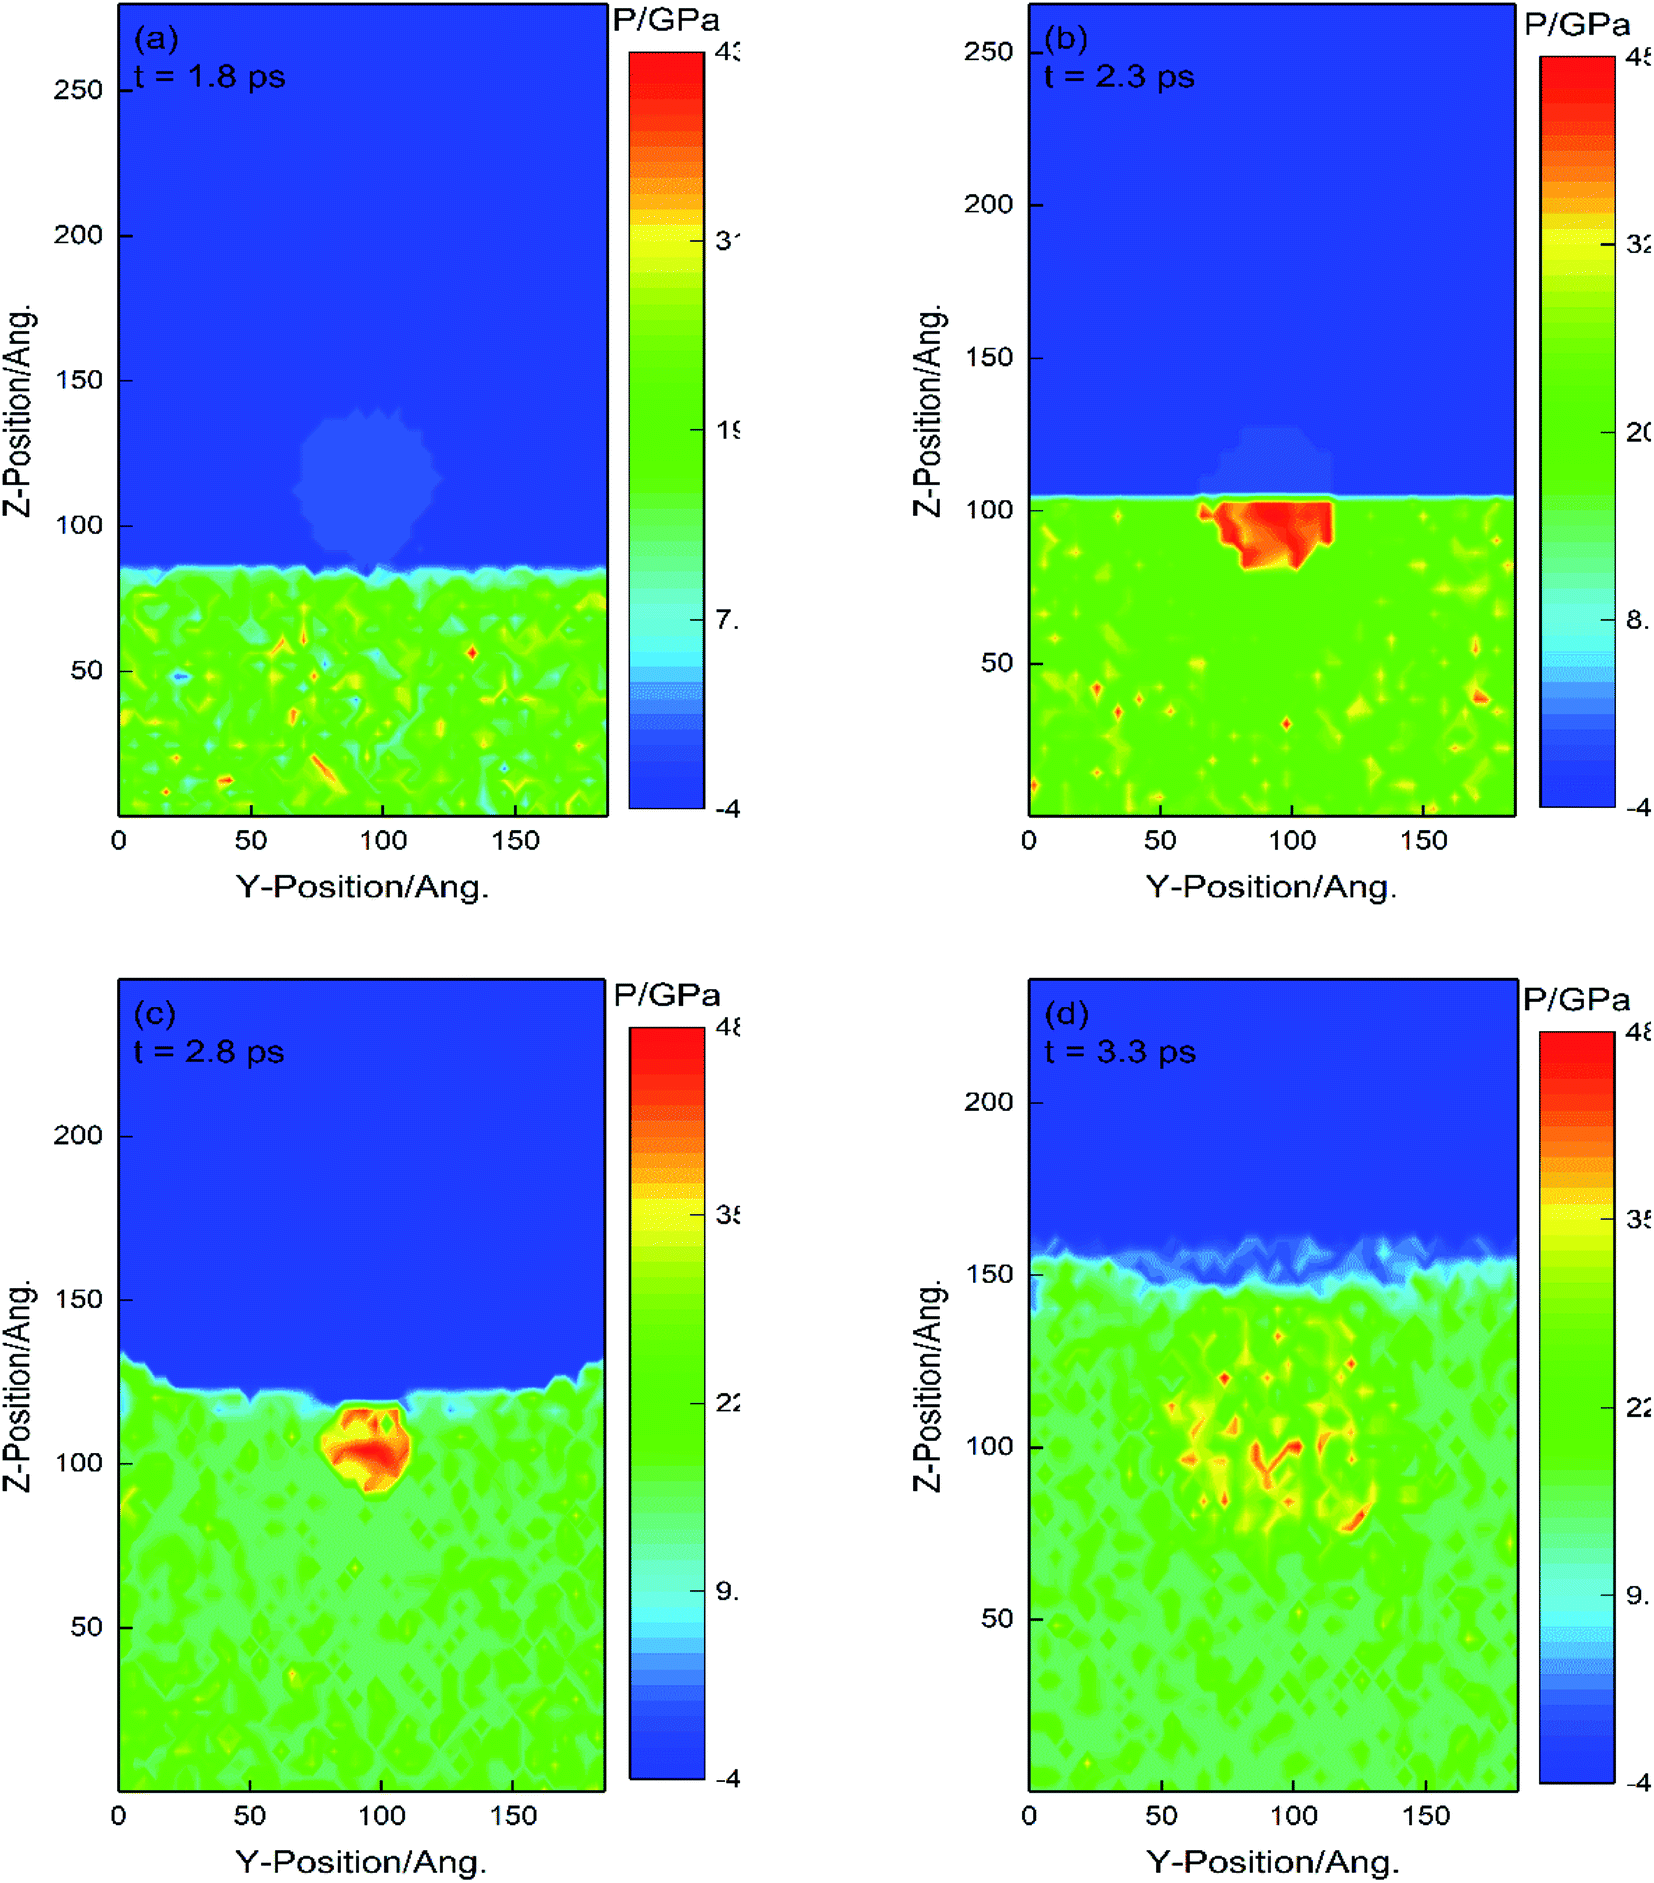 | ||
| Fig. 8 Spatial–temporal press distribution in the process of the void collapse for the case of Up = 3 km s−1, R = 3 nm. (a) represents the initial moment, (b) and (c) correspond to the particle entering the interior of the void; (d) represents void collapse completion moments. | ||
When the void is completely closed, concave waves can be seen due to the recompression of molecules on the downstream surface, as shown in Fig. 8(c). After the void collapses completely, the particles collide with each other to produce chemical reactions and release energy, and the internal pressure of the void is close to 50 GPa. In the next 0.5 ps time, the hot spot center pressure decreases to 35 GPa, but the hot spot area gradually increases. Secondary compression from the impact zone leads to a rapid decrease in the central pressure of the hot spot and an increase in the pressure in the surrounding environment. The secondary compression wave catches up with the leading shock wave, and the recompression of the material between the shock wavefront and the initial shock region increases the intramolecular energy, which makes the pressure in the surrounding region increase.
Fig. 9 is a temperature program of hot spot formation process in PETN system with a void radius of 3 nm at impact speed of 3 km s−1. When the shock wave reaches the upstream surface of the void at 1.8 ps, the temperature in the compression zone is about 2000 K, as shown in Fig. 9(a). The shock wave continues to propagate forward, forcing particles on both sides of the void into the void. Particles collide with each other and react chemically to release energy, and at the same time, the generated kinetic energy is converted into intramolecular energy, which makes the temperature in the inner region of the void as high as 6000 K.
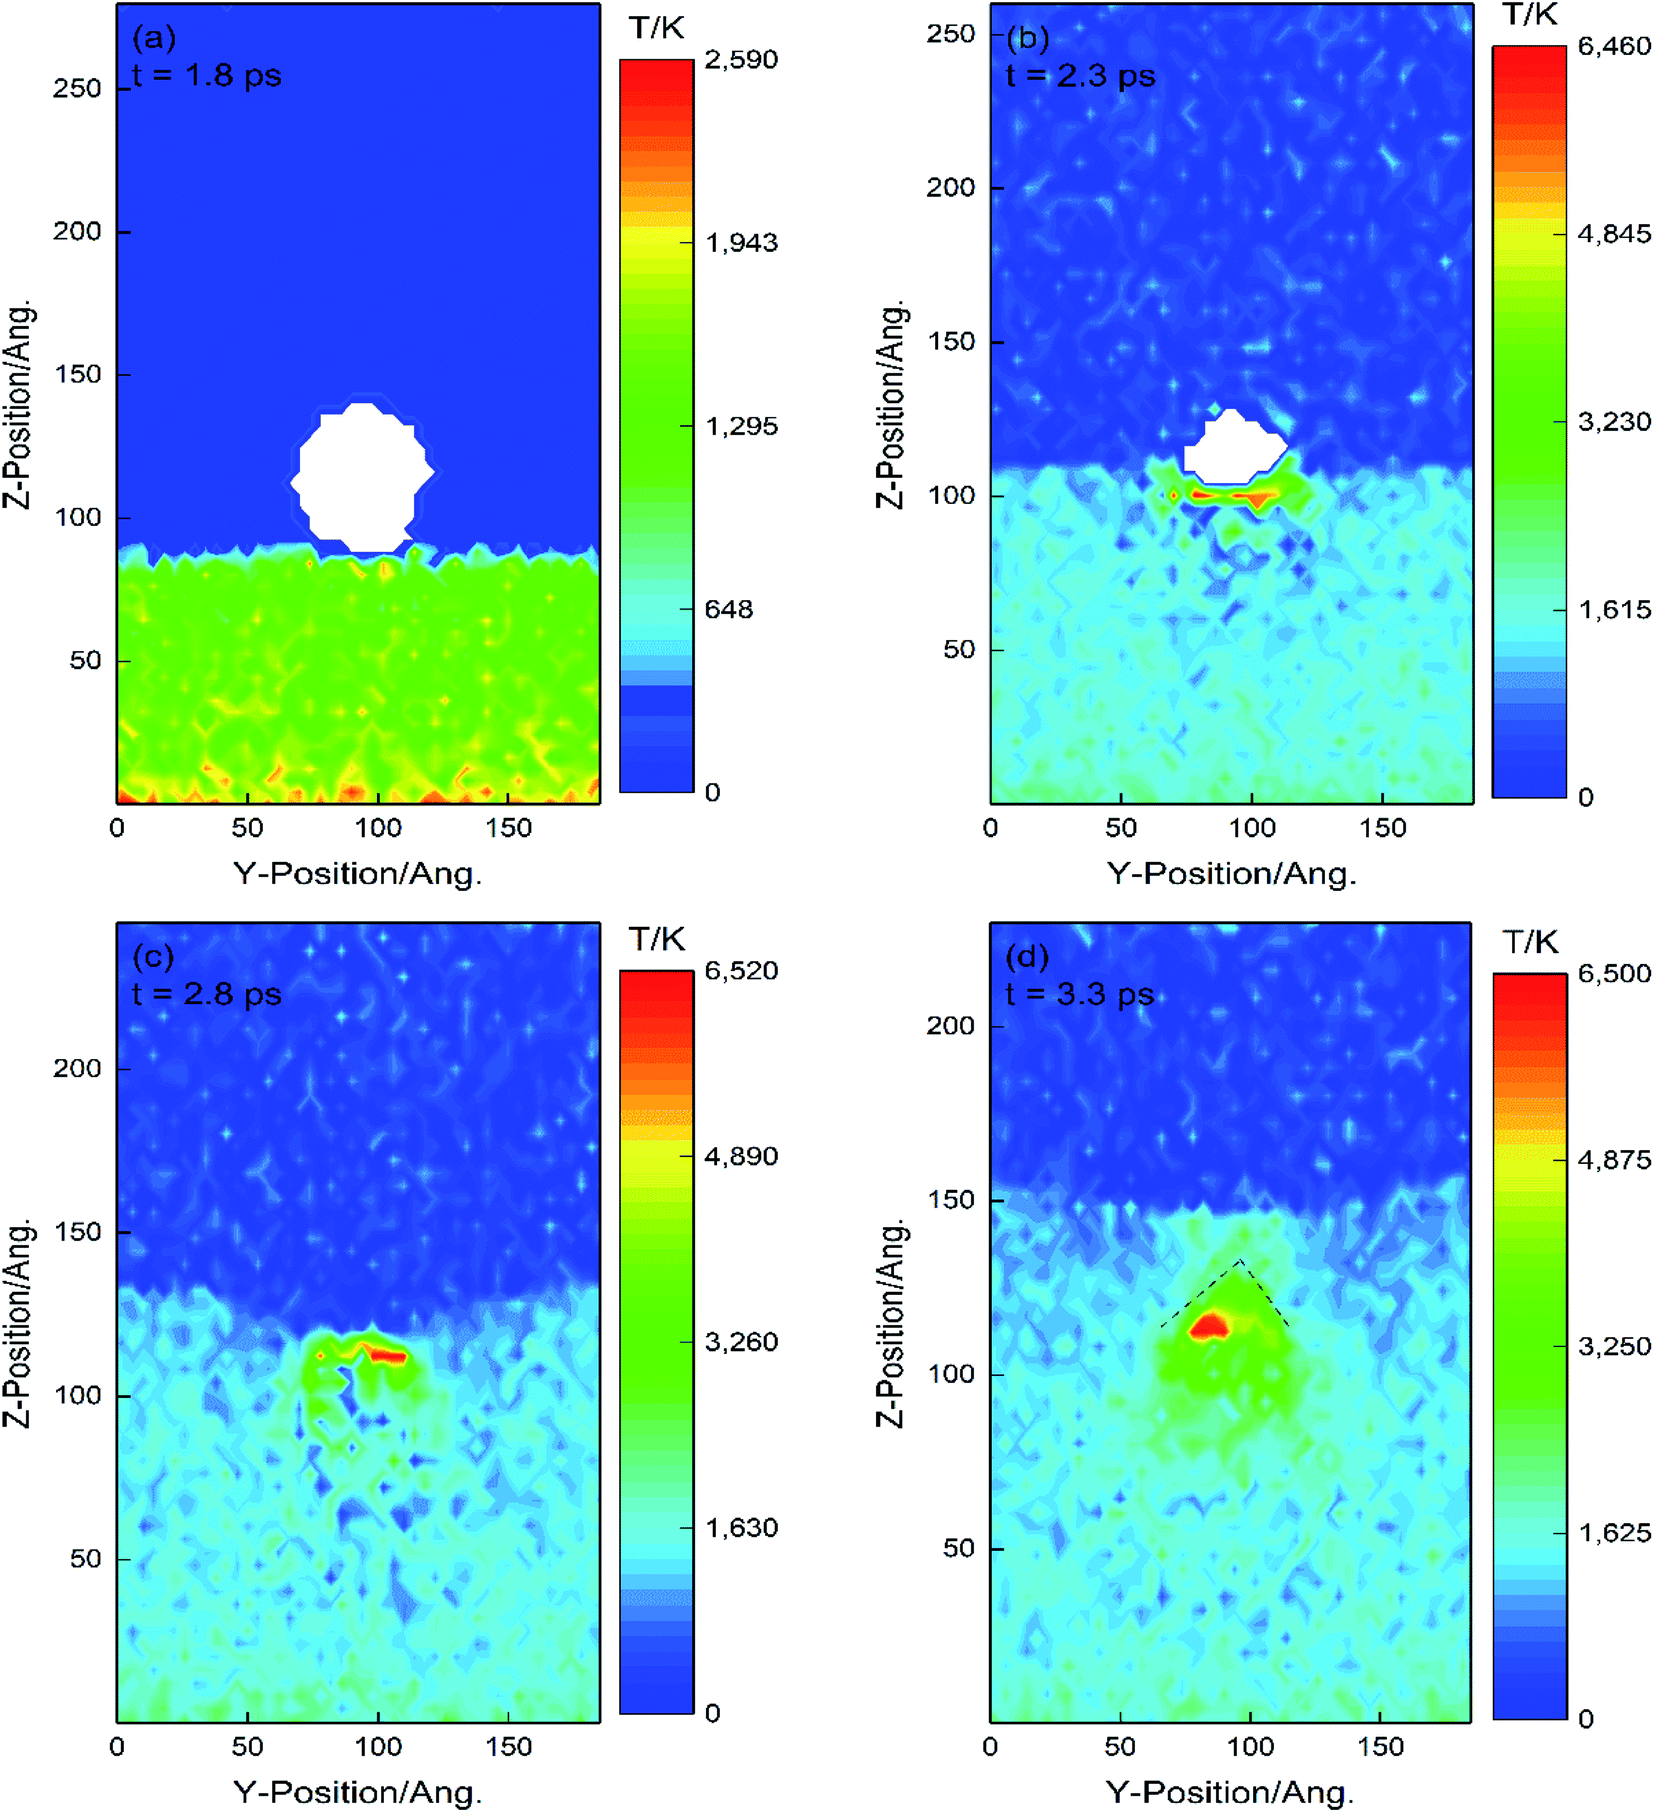 | ||
| Fig. 9 Spatial–temporal temperature distribution in the process of the hot spot formation for the case of Up = 3 km s−1, R = 3 nm. (a) represents the initial moment, (b) and (c) correspond to the particle entering the interior of the void; (d) represents the void collapse completion moments. | ||
The further action of shock wave makes the particles in the void continue to advance to the downstream surface of the void and collide with the downstream surface of the void at 2.8 ps. As shown in Fig. 9(c), after the void is completely collapsed, obvious concave waves can be observed, and the hot spot center temperature is always higher than 6000 K. This shows that the void collapse caused by strong impact has a greater influence on the heating of surrounding materials, and more kinetic energy is converted into heat energy. These heat energies promote the chemical reaction of molecules around the hot spot, which makes the hot spot area expand continuously, and the central area of the hot spot evolves into an approximate triangular cone, as shown by the black dashed line in Fig. 9(d).
Similar findings are found in the temperature program study of hot spot formation process in PETN system with a void radius of 3 nm at an impact speed of 2 km s−1. More details about the spatial–temporal temperature distribution are shown in the ESI S3.†
In order to study the relationship between impact strength and void radius, Fig. 10 shows the hot spot formation process of PETN system with void radius R = 2 nm under the strong impact (impact velocities of 2 km s−1 and 3 km s−1). The shock wave reaching the downstream surface of the void at 2 km s−1 and 3 km s−1 velocities is 3.5 ps and 2.8 ps, respectively.
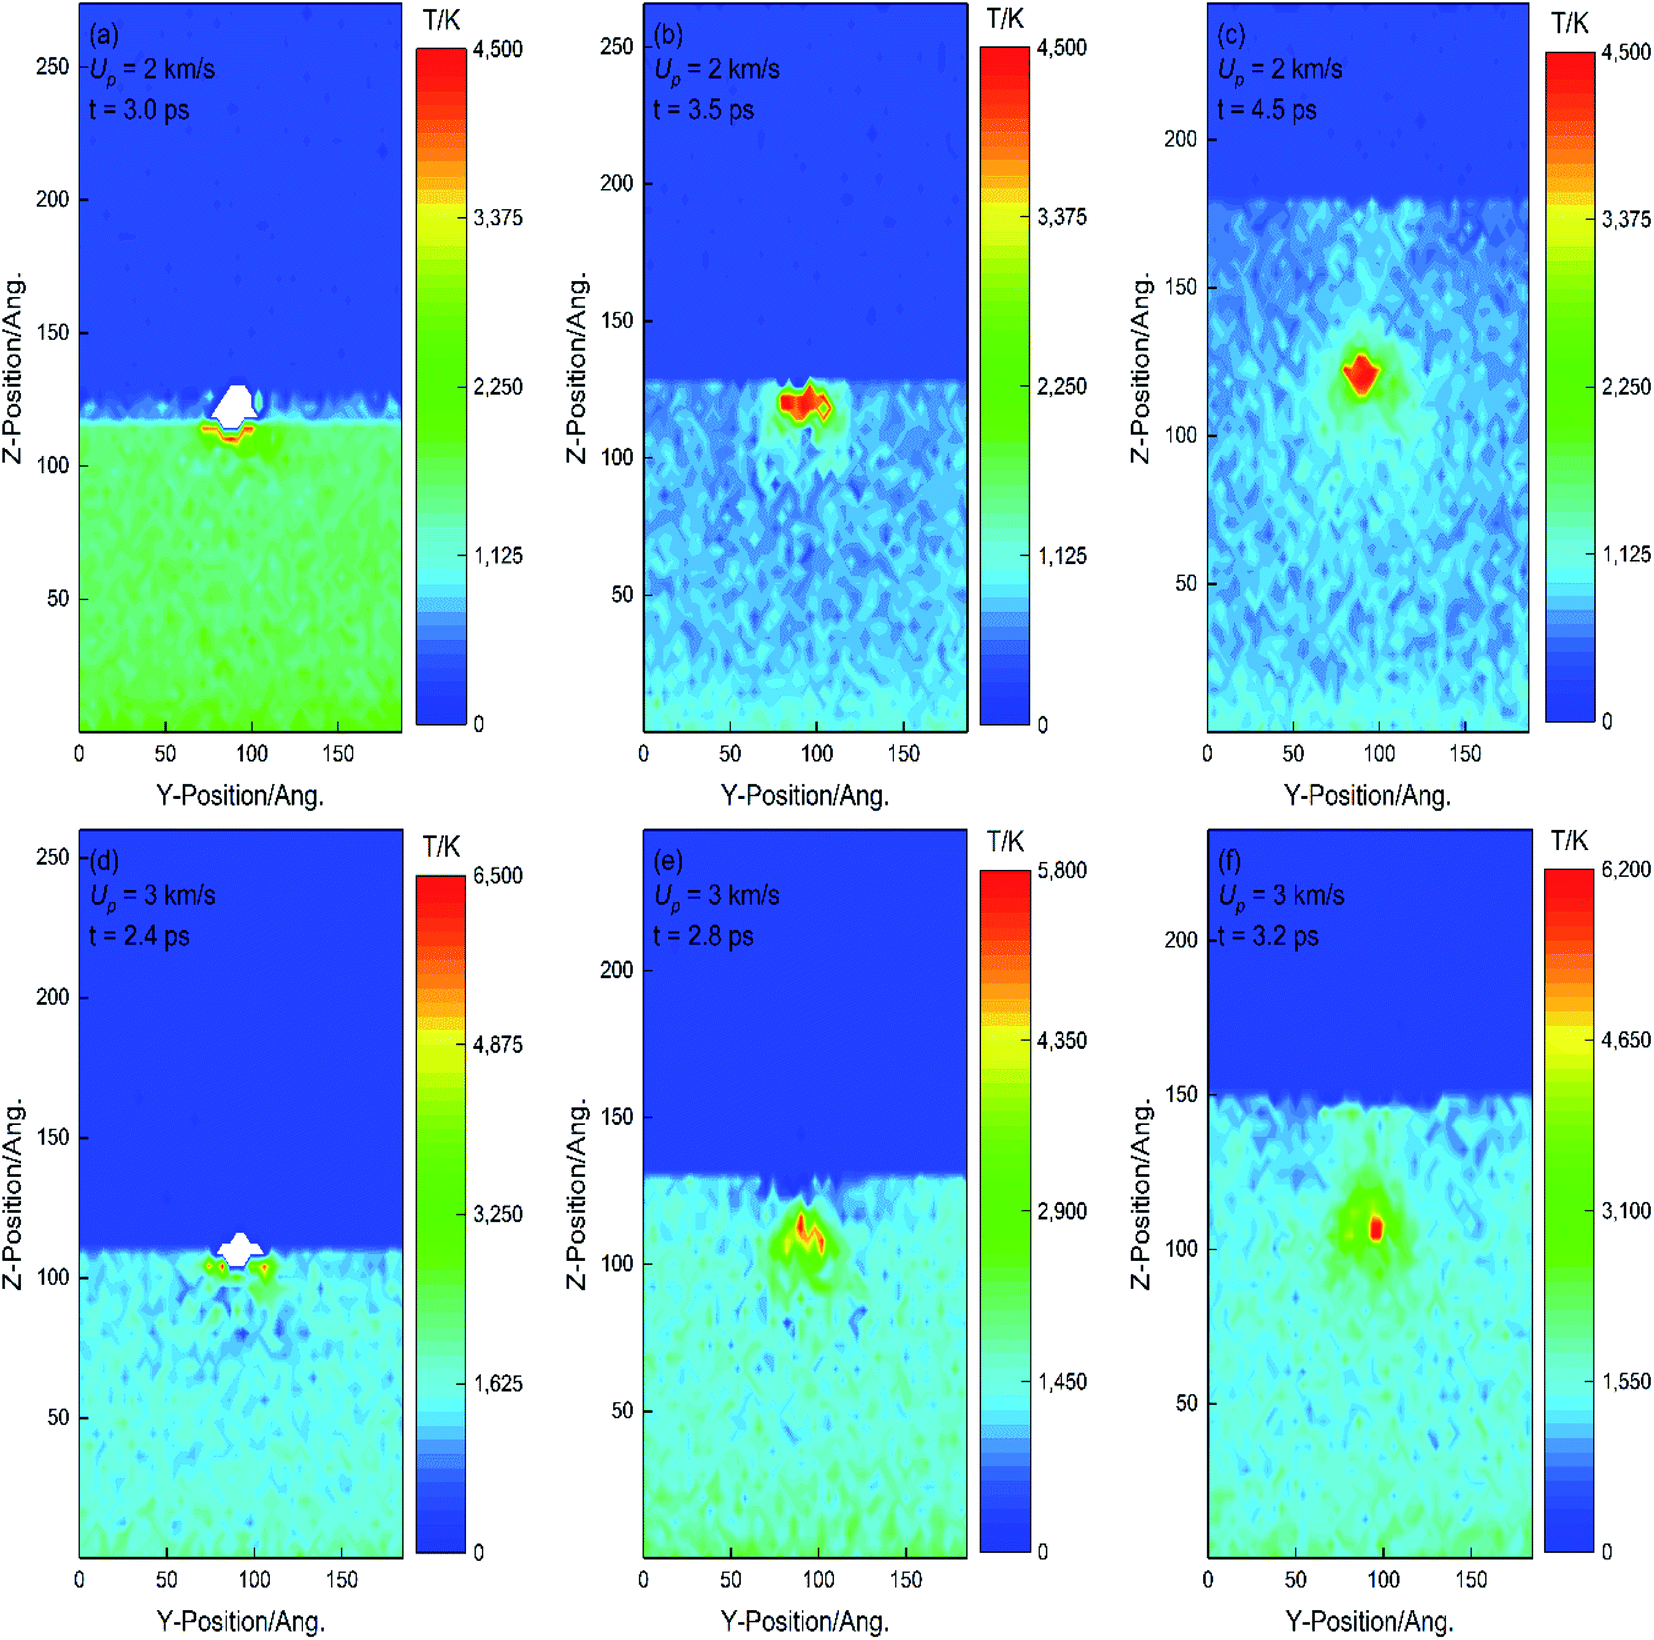 | ||
| Fig. 10 Hot spot formation process for PETN with void radius R = 2 nm at Up = 2 km s−1, 3 km s−1. (a)–(c) correspond to Up = 2 km s−1; (d)–(f) correspond to Up = 3 km s−1. (b) and (e) are the void collapse completion moments. | ||
From Fig. 10(b), it can be seen that the central temperature of the hot spot formed when the void collapse is completed is as high as 4500 K, and the temperature around the hot spot also exceeds 2500 K. There are many reasons for this high temperature: (1) initial temperature rise caused by impact compression; (2) local plastic deformation when shock wave propagates to the void; (3) the particles entering the void collide with each other, so that more kinetic energy is converted into heat energy; (4) local chemical reaction releases energy. It is precise because of the coupling of various physical and chemical changes that the temperature in the center of hot spots rises sharply. As the shock wave continues to propagate, the hot spot area gradually changes into an approximate triangular cone shape, as shown in Fig. 10(c). This situation can also be observed in PETN system with impact speed of 3 km s−1. The difference is that when the impact speed is 3 km s−1, the hot spot area is larger and the center temperature of the hot spot is higher.
In addition, the formation process of hot spots in PETN system with a void radius R = 1 nm at shock velocities of 2 km s−1 and 3 km s−1 is discussed. More details about the spatial–temporal temperature distribution are shown in the ESI S4.† By comparing the hot spot formation process of strong and weak shocks in PETN system with a small void radius, different mechanisms of hot spot formation can be obtained.
Under weak shock (1 km s−1), the hot spot formation process is mainly caused by the temperature rise caused by the collision of particles entering the void. Under strong impact (2 km s−1, 3 km s−1), when particles on both sides of the void enter the void, the greater collision speed will make more kinetic energy transfer to intramolecular energy and increase heat energy; the secondary compression produced by particles impacting the downstream surface of the void plays an important role in the formation of hot spots. The secondary compression wave produced by the collision between particles in the void leads to the rapid decrease of the pressure in the impact area and the increase of the pressure in the surrounding environment. The secondary compression wave quickly catches up with the leading shock wave, and the recompression of the material between the front of the shock wave and the initial impact region enhances the intramolecular energy, which leads to the secondary compression of the system, which makes the hot spot area formed by the impact expand to approximate the triangular cone area, and the temperature of the hot spot center rises.
According to the hot spot theory, the growth or extinction of hot spots depends on whether the energy released by local physical and chemical processes is higher than the energy consumed by heat transfer and heat diffusion. This section focuses on hot spot growth in PETN system with a void radius of 3 nm at shock velocities of 2 km s−1 and 3 km s−1. Fig. 11 is the temperature program of PETN system with a void radius R = 3 nm during crystal maximum compression and crystal stretching at impact velocities of 2 km s−1 and 3 km s−1. As shown in Fig. 11(a) and (e), the compression amount of the system is different when the maximum compression is reached at different impact velocities. When the crystal reaches the maximum compression at the impact speed of 2 km s−1, the crystal size along the z-direction is 226 Å, which is 32% compressed compared with the initial size of 332 Å. At the impact speed of 2 km s−1, the crystal is compressed by about 40% when it reaches the maximum compression.
 | ||
| Fig. 11 Spatial–temporal temperature distribution with void radius R = 3 nm at Up = 2 km s−1, 3 km s−1 for the maximum compression and the stretching of the crystal. (a) and (d) correspond to the maximum compression of the PETN with Up = 2 km s−1 and Up = 3 km s−1 respectively; (b) and (c) correspond to the stretching phase of the PETN with Up = 2 km s−1; (e) and (f) correspond to the stretching phase of the PETN with Up = 3 km s−1. | ||
When the PETN crystal reaches the maximum compression, the hot spot shape is close to the triangular cone. After that, the shock wave reflects on the upper free surface to form a stretching wave, which makes PETN system in a continuous stretching state. During the stretching process, heat transfer between the hot spot and the surrounding area occurs continuously, and the hot spot area gradually expands, and the hot spot temperature does not decrease. Under the action of shock wave and tensile wave, the shape of hot spot is no longer a triangular cone, as shown in Fig. 11(b) and (c). This shows that the energy released by chemical reaction has exceeded the energy consumed by heat dissipation, and the hot spots would grow further, and the leading shock wave would be strengthened to cause the system to gradually develop into stable detonation.
 | ||
| Fig. 12 Time evolution of main product evolution for PETN with void radius R of 3 nm at Up = 2 km s−1, 3 km s−1. (a) and (b) correspond to the PETN system at Up = 2 km s−1; (c) and (d) correspond to the PETN system at Up = 3 km s−1. | ||
When Up = 2 km s−1, almost no chemical reaction occurs in the initial shock compression stage. When the shock wave reaches the upstream surface of the void, the O–NO2 bond in PETN breaks to form NO2. The formation of NO3 lags behind that of NO2, and the formation of C5H8O9N3 is not found, which indicates that the impact strength of 2 km s−1 is not enough to break the O–ONO2 bond in PETN to form NO3. The formation of NO3 is mostly formed by the reaction between NO2 and free O in the system. In Fig. 12(b), the final products such as H2O and CO2 are formed during the collapse of the void, but no formation of N2 is observed. This is because most of the N in PETN exists in NO2 and NO3 groups. In order to produce N2, it is necessary to eliminate O in NO2 and NO3 groups, which is a complex redox process. The environment in the system does not have such a complex reaction.
Fig. 12 shows that the number of reactants in the system increases sharply with the increase of impact strength. It shows that strong impact converts more kinetic energy into heat energy and promotes the formation of products. During the void collapse, the products increase rapidly, which proves that the void collapse greatly improves the chemical reactivity (as shown in the amount of NO2 in Fig. 12(c) and the amount of H2O in Fig. 12(d)). The O–NO2 bond breaks to form NO2, which is not affected by impact strength. When Up = 3 km s−1, NO2, NO3, etc. appear in the impact compression stage because the impact strength has exceeded the PETN impact initiation threshold. In Fig. 12(c), the change of NO2 quantity goes through three stages. In the initial impact compression stage, the amount of NO2 increases slowly. At the beginning of the void collapse, the amount of NO2 increased rapidly. After the void collapse, the amount of NO2 first decreased and then gradually increased. The appearance of NO3, C5H8O9N3, HONO, and C5H7O10N3 indicated that the initial decomposition path of PETN began to increase under strong impact. Ng39,40 and others believed that when the incident energy was high enough, PETN in an excited state would produce ONO2 group, and then NO3, which is consistent with the research results.
Comparing Up = 2 km s−1 with Up = 3 km s−1, it is found that the initial reaction path of NO2 formed by the fracture of O–NO2 bond has not changed, but Up = 3 km s−1 increases the possible reaction path, such as the generation of NO3 and HONO groups. When Up = 2 km s−1, NO2 in the system is mostly produced during the process of void collapse to form hot spots; when Up = 3 km s−1, NO2 in the system begins to appear in large quantities during the shock compression stage. These results indicate that strong shock can directly induce the initial reaction of PETN and accelerate the decomposition of PETN molecules by interacting with hot spots.
4. Conclusions
The initial response processes of PETN containing nanoscale spherical void under impact loading were investigated using ReaxFF-lg force field combined with the molecular dynamics method. The impact-induced void collapse process, hot spot formation and growth, and chemical reaction processes, which strongly depend on the void size and impact strength, were determined.The void collapse undergoes three stages: (1) local plastic deformation caused by the shock wave reaching the upstream surface of the void; (2) particles on both sides of the void enter the void and collide under the action of the shock wave; (3) the particles entering the void continue to propagate forward until they collide with molecules on the downstream surface of the void. The shape of the shock wave formed after the void collapse is similar to a concave wave. For the impact velocity of 1 km s−1, the PETN system with void radius R of 0.5 nm and 1 nm fails to form hot spots during the impact process; the PETN system with void radius R of 2 nm and 3 nm forms hot spots during the impact process. The formation of hot spots goes through four stages: (1) overall temperature rise due to initial impact compression; (2) temperature rise on the upper surface of the void caused by local plastic deformation; (3) rapid temperature rise caused by molecules entering the interior of the void and colliding with the downstream surface of the void; and (4) thermal diffusion between the hot spot and the surrounding area, resulting in a decrease in the temperature of the center of the hot spot and a slow increase in the temperature of the neighboring area. Process (3) determines the hot spot center temperature and process (4) determines the hot spot duration. The hot spot area and hot spot temperature increase with the increase of void radius.
With a void radius of 3 nm and Up = 1 km s−1, the void shape remains essentially symmetric during the void collapse, which is mainly caused by local plastic deformation. For the case of Up = 2 km s−1, 3 km s−1, strong shock will lead to more intense material focusing. For the case of Up = 1 km s−1, the high temperature generated during the void collapse is the main reason for the hot spot formation; Up = 2 km s−1, 3 km s−1, the void collapse caused by strong impact has a greater effect on the heating of the surrounding material, and the secondary compression formed by the mutual collision between particles makes the hot spot. The hot spot area expands continuously and the central region of the hot spot evolves into an approximate triangular cone.
For small void radius and low-velocity impact conditions, no significant chemical reactions are observed. The breakage of the O–NO2 bond to form NO2 as the initial reaction path does not change, but the strong impact increases the possible reaction paths and produces more products. NO2 as the initial product is produced in large quantities during the void collapse to form the hot spot, indicating that the void activates the chemical reactivity of PETN crystals. The strong shock induces the initial reaction of PETN directly and accelerates the decomposition of PETN molecules by interacting with hot spots, etc.
Conflicts of interest
The authors declare no competing financial interests.References
- G. Afanasev, V. Bobolev, Y. Kazarova and Y. F. Karabano, Combust., Explos. Shock Waves, 1972, 8, 241–246 CrossRef.
- C. S. Coffey, Phys. Rev. B: Condens. Matter Mater. Phys., 1981, 24, 6984–6990 CrossRef CAS.
- J. W. Mintmire, D. T. Robertson and C. H. White, Phys. Rev. B: Condens. Matter Mater. Phys., 1994, 49, 14859–14864 CrossRef CAS PubMed.
- Y. Shi and D. W. Brenner, J. Phys. Chem. B, 2008, 112, 14898–14904 CrossRef CAS PubMed.
- R. W. Armstrong, Rev. Adv. Mater. Sci., 2009, 19, 13–40 CAS.
- J. P. Dear, J. E. Field and A. J. Walton, Nature, 1988, 332, 505–508 CrossRef.
- M. M. Kuklja and A. B. Kunz, J. Phys. Chem. Solids, 2001, 61, 35–44 CrossRef.
- M. M. Kuklja and A. B. Kunz, J. Phys. Chem. B, 1999, 103, 8427–8431 CrossRef CAS.
- M. M. Islam and A. Strachan, J. Phys. Chem. C, 2017, 121, 22452–22464 CrossRef CAS.
- D. D. Dlott and M. D. Fayer, J. Chem. Phys., 1990, 92, 3798–3812 CrossRef CAS.
- A. Tokamkoff, M. D. Fayer and D. D. Dlott, J. Phys. Chem., 1993, 97, 1901–1913 CrossRef.
- Q. An, S. V. Zybin, W. A. Goddard III, B. A. Jaramillo, M. Blanco and S.-N. Luo, Phys. Rev. B: Condens. Matter Mater. Phys., 2011, 84, 220101 CrossRef.
- Q. An, S. V. Zybin, W. A. Goddard III, B. A. Jaramillo and T.-T. Zhou, J. Phys. Chem. C, 2013, 117, 26551–26561 CrossRef CAS.
- Q. An, W. A. Goddard III, S. V. Zybin and S.-N. Luo, J. Phys. Chem. C, 2014, 118, 19918–19928 CrossRef CAS.
- B. L. Holian, T. C. Germann, J. B. Maillet and C. T. White, Phys. Rev. Lett., 2002, 89, 285501 CrossRef PubMed.
- T. Hatano, Phys. Rev. Lett., 2004, 92, 015503 CrossRef PubMed.
- Y. Shi and D. W. Brenner, J. Phys. Chem. C, 2008, 112, 6263–6270 CrossRef CAS.
- S. D. Herring, T. G. Germann and N. G. Jensen, Phys. Rev. B: Condens. Matter Mater. Phys., 2010, 82, 214108 CrossRef.
- L. Yao and J. Chen, J. Appl. Phys., 2017, 122, 175105 CrossRef.
- E. Jaramillo, T. D. Sewell and A. Stranchan, Phys. Rev. B: Condens. Matter Mater. Phys., 2007, 76, 064112 CrossRef.
- R. M. Eason and T. D. Sewell, J. Dyn. Behav. Mater., 2015, 1, 423–438 CrossRef.
- K. Nomura, R. K. Kalia, A. Nakano and P. Vashishta, Appl. Phys. Lett., 2007, 91, 183109 CrossRef.
- A. Strachan, A. C. T. van Duin, D. Chakraborty, S. Dasgupta and W. A. Goddard III, Phys. Rev. Lett., 2003, 91, 098301 CrossRef PubMed.
- T.-T. Zhou, J.-F. Lou, Y.-P. Zhang, H. J. Song and F. L. Huang, Phys. Chem. Chem. Phys., 2016, 18, 17627–17645 RSC.
- J. Trotter, Acta Crystallogr., 1963, 16, 698 CrossRef CAS.
- J. J. Dick, Appl. Phys. Lett., 1984, 44, 859–861 CrossRef CAS.
- J. J. Dick, R. N. Mulford, W. J. Spencer, D. R. Pettit, E. Garcia and D. C. Shaw, J. Appl. Phys., 1991, 70, 3572–3587 CrossRef CAS.
- J. J. Dick and J. P. Ritchie, J. Appl. Phys., 1994, 76, 2726–2737 CrossRef CAS.
- J. J. Dick, J. Appl. Phys., 1997, 81, 601–612 CrossRef CAS.
- J. J. Dick, D. E. Hooks, R. Menikoff and A. R. Martinez, J. Appl. Phys., 2004, 96, 374–379 CrossRef CAS.
- L.-C. Liu, Y. Liu, S. V. Zybin, H. Sun and W. A. Goddard III, J. Phys. Chem. A, 2011, 115, 11016–11022 CrossRef CAS PubMed.
- S. J. Plimpton, J. Comput. Phys., 1995, 117, 1–19 CrossRef CAS.
- H. M. Aktulga, J. C. Fogarty, S. A. Pandit and A. Y. Grama, Parallel Comput., 2012, 38, 245–259 CrossRef.
- N.-N. Ge, S. Bai, J. Chang and G.-F. Ji, RSC Adv., 2018, 8, 17312–17320 RSC.
- Y. Li, W.-L. Yu, H. Huang, M. Zhu and J.-T. Wang, RSC Adv., 2021, 11, 38383–38390 RSC.
- R. M. Eason and T. D. Sewell, J. Phys. Chem. C, 2011, 116, 2226–2239 CrossRef.
- J. E. Field, Acc. Chem. Res., 1992, 25, 489–496 CrossRef CAS.
- T. R. Shan, R. R. Wixom and A. P. Thompson, Phys. Rev. B, 2016, 94, 054308 CrossRef.
- W. L. Ng, J. E. Field and H. M. Hauser, J. Chem. Soc., 1976, 2, 637–639 Search PubMed.
- W. L. Ng, J. E. Field and H. M. Hauser, J. Appl. Phys., 1986, 59, 3945–3952 CrossRef.
Footnote |
| † Electronic supplementary information (ESI) available: S1 shows method of subtracting the center-of-mass velocity. S2 is the spatial–temporal temperature distribution of the void collapse for the case of Up = 1 km s−1. S3 is the spatial–temporal temperature distribution of the hot spot formation process for the case of Up = 1 km s−1, R = 3 nm. S4 is hot spot formation process for PETN system with void radius R = 1 nm at Up = 2 km s−1, Up = 3 km s−1. See DOI: 10.1039/d2ra00417h |
| This journal is © The Royal Society of Chemistry 2022 |