DOI:
10.1039/D1RA08926A
(Paper)
RSC Adv., 2022,
12, 11052-11059
Nucleation and growth mechanism in the early stages of nickel coating in jet electrodeposition: a coarse-grained molecular simulation and experimental study†
Received
8th December 2021
, Accepted 4th April 2022
First published on 11th April 2022
Abstract
In jet electrodeposition, microscopic nucleation and growth in the early stages of nickel coating are curcial and directly related to the consistency and reliability of the coating structure. We set up a three-electrode device with flow-injection function based on the vertical distribution and further studied the early stages of nanocluster formation corresponding to parallel and vertical distribution states. According to the nucleation diffusion and growth analysis, a coarse-grained molecular dynamics model is established for the first time to reveal the influences of different growth environments on the microscopic nucleation growth of the coating structure. Thus, the ion dynamic diffusion and nucleation kinetic mechanism could be further achieved, these vary under different electrodeposition conditions. In addition, the physical structure of the surface coating can be obtained by element analysis and density functional theory (DFT) calculations. These findings provide a theoretical and experimental basis for the efficient preparation of nickel coatings.
Introduction
Nickel coatings are widely used in various industries, including metal decoration,1,2 corrosion-resistant materials,3 self-cleaning materials4 and electronic components,5 due to their excellent corrosion resistance, surface stability, good morphology, plasticity, and ductility, as well as the wide range of reserves. Meanwhile, nickel is also extensively applied to photo/electrocatalytic hydrogen production because of free electrons in the 3d orbitals of transition metals.6,7
At present, the methods to prepare nickel coatings include plasma spraying, electroless plating, hydrothermal/solvothermal methods and electrodeposition.8,9 Among them, electrodeposition is the most extensively used because of its simple process, low preparation cost, environmental friendliness, and excellent coating quality.10 Currently, to further enhance the preparation efficiency and achieve outstanding structure performance, jet electrodeposition has been developed. Wang et al. prepared a Ni–CeO2 composite coating by jet electrodeposition, leading to an outstanding corrosion effect.11 Liu et al. adopted composite technology consisting of rolling and jet electrodeposition. A nickel coating with excellent surface quality can be prepared by optimizing the process parameters.12 Therefore, jet electrodeposition can successfully achieve the high-efficiency fabrication of nickel coatings with superior characteristics.
The morphology of the coating surface is sensitively related to the nucleation and growth process in the initial state. Many reports have focused on the exploration of the deposition kinetics.13 Various 3D nucleation models of the diffusion control process were established to reveal the metallic reduction mechanism.14,15 However, few studies focused on the jet electrodeposition process, especially the simulation to explore nucleation and growth through the process of the molecular dynamics. Therefore, utilizing an appropriate kinetic method to illustrate the nucleation mechanism of coating prepared by jet electrodeposition is urgent, further leading to the promotion of the high-quality preparation of nickel coatings.
This work aims at characteristics of different electrodeposition processes. We develop a vertical distributed three-electrode system to analyze the nucleation deposition behaviors of jet electrodeposition. The coarse-grained molecular model is adopted for the first time to simulate the deposition of nickel ion combined with the setting condition of nucleation and diffusion, corresponding to traditional, vertical, and jet electrodeposition. The morphology and element analysis reveal that jet electrodeposition could induce the coating to grow with dendritic structure accompanied by fast nucleation and growth rate. Finally, the DFT result further confirms that the coating prepared by jet electrodeposition has superior conductivity and electrocatalytic performance. Our work provides a deep insight into the nucleation and growth mechanism of jet electrodeposition. It offers a steady a steady foundation for theory and experiment for preparation of nickel coating.
Result and discussion
Electrodeposition measurement mode
Aimed at the characteristic of jet electrodeposition, the three-electrode cell for electrochemical test is optimized, as shown in Fig. 1a. The platinum wire is chosen to be the counter electrode to replace the platinum foil. It is inserted into an outer hose connected to a micro peristaltic pump, thereby achieving the local injection effect. The new cell is shown in Fig. 1b inside. From the linear voltammogram of optimized three-electrode cells (Fig. 1b), the nickel electrodeposition onset potential shifts to a lower value. Simultaneously, the current density at the same potential is enhanced with increasing potential compared with those of traditional three-electrode cell, indicating that the effect of rapid flow could promote the mass transfer and ion diffusion to facilitate the nucleation and growth process.
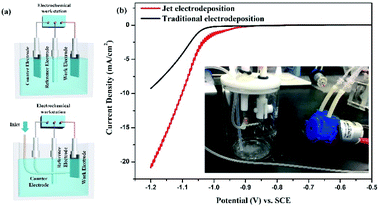 |
| | Fig. 1 Comparison of electrochemical test systems (a) three-electrode cells with different electrode distribution states; (b) linear voltammogram, inside: three-electrode test device with jet flow. | |
Simulation and analysis of nucleation and growth by molecular dynamics
Three electrodeposition conditions are simulated as follows: low potential, high potential, and high potential with jet flow. These correspond to the traditional electrodeposition with parallel distribution of two electrodes, vertical electrodeposition meaning that two electrodes distributed vertically, and jet electrodeposition with vertical electrode distribution and liquid flow, respectively. Except for the nucleation morphology of the cathode surface, the simulation area is divided into the three regions to calculate the particle number at different times to judge the influence of different environmental states on the diffusion of Ni2+ ions.
Traditional electrodeposition. In the traditional parallel distribution of two electrodes, the model uses the diffusion of ions to carry out the random movement, whereas the electric field only adopts a lower potential (0.1 V setting). The simulation results are shown in Fig. 2a–c. When t = 1 s, the surface of the cathode begins to deposit a layer of dense cluster particles. Although the sizes of each cluster vary from one another, the overall trend demonstrates a uniform coating morphology. In the range of solution, the particle numbers in the range of 35–50 nm (number: 46) and 15–35 nm (number: 42) are larger than that of 0–15 nm (number: 12), suggesting that under the control of the solution diffusion, the ion distribution around the surface of the electrode is less, and the Ni2+ ions are mostly concentrated at the inner solution. When t = 2 s, clusters grow on the surface of the electrode, indicating the start of the coalescence of particles. However, the ion concentration is further reduced to the value of 8, indicating that the rate of ion supplement is inferior to that of consumption. When the time increase to 3 s, the overall morphology of cathode still remains to be a coating. Meanwhile, the ion concentration in the range of 0–15 nm begins to be supplied, maintaining the value of 9. The particle number in the range of 15–35 nm is supplemented to about 45. This result illustrates that the metal ions around the electrode surface always remains at a low concentration and only relies on the diffusion movement of the solution, further leading to a sluggish electrodeposition. As shown in Fig. 2d, the deposition heights at three time periods are counted and agree with the above analysis. Furthermore, the above model is repeated to simulate for three times. The result is shown in Fig. S2† with error bar to demonstrate the accuracy of the model.
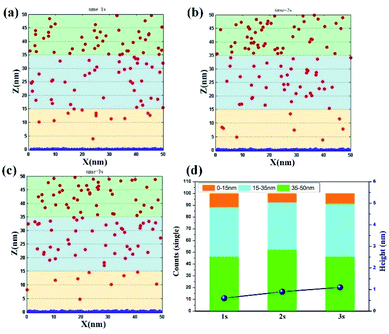 |
| | Fig. 2 Deposition morphology with time in traditional electrodeposition with the potential of 0.1 V. (a) 1 s; (b) 2 s; (c) 3 s; (d) data statistics. | |
Vertical electrodeposition. By further increasing the potential to a high value of 0.5 V, the influence of electromigration on the ion movement is promoted. The results of ion movement and electrode morphology at different time period are obtained, as shown in Fig. 3a–c. At t = 1 s, the size of clusters on the electrode surface is obviously larger than that of traditional electrodeposition, but the whole morphology still tends to be flat. In the region of 0–15 nm, the ion number increases to the value of 15, and the ion number decreases to 39, thereby corresponding to the range of 15–35 nm. This finding presents that the increase of potential could directly promote the effect of electromigration and drive Ni2+ ions to reach around the electrode surface. When t = 2 s, the clusters on the electrode surface further increase, and the average size at this time exceeds the size of the clusters at 3 s in traditional electrodeposition. The number of ions in the region of 15–35 nm is also supplemented to reach the value of 46. At the same time, the value of 14 on the electrode surface remains unchanged in the region of 0–15 nm, thereby verifying that ions in the solution are also supplemented in the rapid deposition process. When t = 3 s, the surface morphology of the electrode begins to grow in the vertical direction, indicating that the volume of the bottom clusters reaches the set value at this time. This phenomenon further proves that the deposition rate improves effectively through strong electromigration. Meanwhile, the number of ions near the electrode surface reaches the value of 18, illustrating that electromigration could induce the ion motion and maintain the ion concentration under fast nucleation and growth process. By conducting a visual comparison of deposition height at different time periods (Fig. 3d), the result at 3 s is found to be twice that at 1 s, which further reveals that rapid electrodeposition efficiency could be achieved at a high potential. Also, the repeated simulation is shown in Fig. S3† with the consistent results.
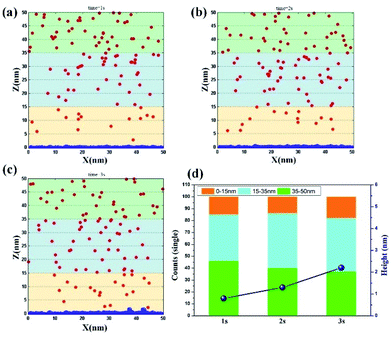 |
| | Fig. 3 Deposition morphology with time in the vertical electrodeposition with the potential of 0.5 V. (a) 1 s; (b) 2 s; (c) 3 s; (d) data statistics. | |
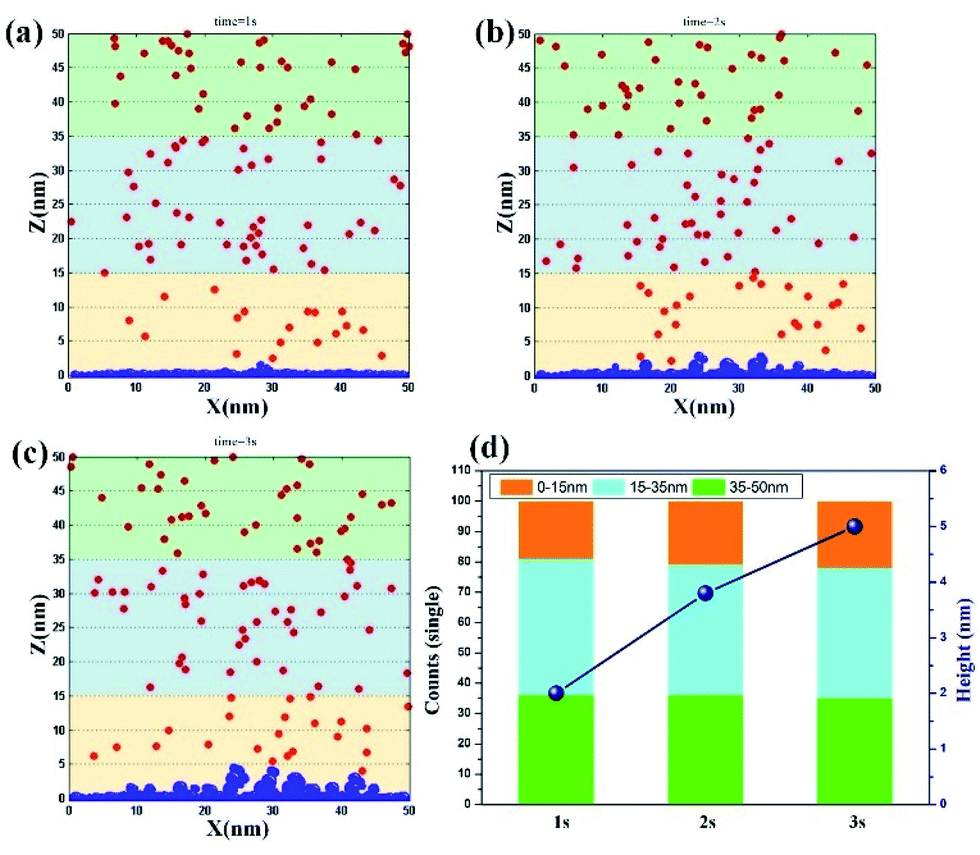
Jet electrodeposition. Fig. 4a–c show the simulation results of jet electrodeposition contributed from the synergy effect of high potential (0.5 V) and liquid flow. At t = 1 s, the vertical growth has appeared on the cathode surface, indicating that the clusters have completed the process of diffusion and coalescence in a short time and have formed the nucleation to deposit on the surface. Furthermore, the number of ions in the region of 0–15 nm reaches the value of 19 (Fig. 4d), implying that the ion concentration around the electrode surface is further increased by the influence of strong electromigration with high potential and fast convection. When t = 2 s, the dendritic structure on the cathode surface becomes obvious, which indicates that more nucleation growth points are formed at the bulge sites, thereby keeping the nucleation and growth continuous along these sites. However, the number of ions on the electrode surface at this time could remain at 20. This finding confirms that even in the rapid deposition process, the ion movement would be still promoted through electromigration and strong convection, leading to the maintenance of a high ion concentration. When the time reaches 3 s, the height of nucleation and growth reaches about 5 nm, which is twice that of 1 s, suggesting that the surface morphology is no longer a smooth structure. It tends to become dendritic with fast nucleation rate, because of the synergy effect of high potential and rapid liquid flow. Furthermore, this rapid deposition state would be maintained in the subsequent deposition process due to a stable ion centration around the cathode surface. In Fig. S4,† the accuracy of the result is further proved.
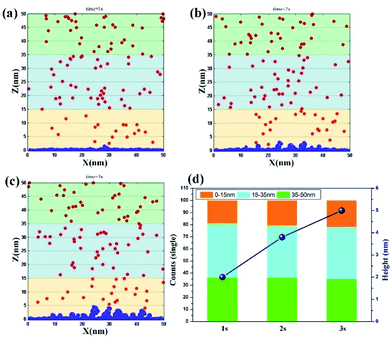 |
| | Fig. 4 Deposition morphology with time in the jet electrodeposition with the potential of 0.5 V. (a) 1 s; (b) 2 s; (c) 3 s; (d) data statistics. | |
Morphology and element characteristic
Traditional electrodeposition. Fig. 5a–c show the morphology in traditional electrodeposition with parallel distribution of electrode and the potential of 0.1 V. In the initial deposition period of 1 s (Fig. 5a), the ITO electrode keeps the primary morphology, and other structures nearly appear. Very few nucleation points exist on the surface of ITO. When the deposition continues to be at 2 s (Fig. 5b), the surface morphology of ITO changes significantly. The number of nucleation increases, and the volume also enlarges relatively. At t = 3 s (Fig. 5c), the coating morphology appears on the surface of ITO, but it does not completely cover the primary morphology of ITO. This finding indicates that the amount of nucleation points increases continually, leading to coalescence and nucleation. Finally, a smooth coating is formed, which is consistent with the simulation results of traditional electrodeposition. Form EDS result (Fig. S5†) shows that oxygen element is obtained on the surface due to air oxidation, but the amount is tiny.
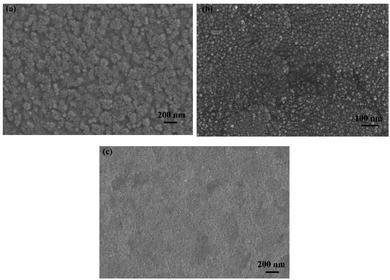 |
| | Fig. 5 Change of morphology in traditional electrodeposition (a) 1 s; (b) 2 s; (c) 3 s. | |
Vertical electrodeposition. Two electrodes are distributed vertically to realize a local high potential (0.5 V) region on the surface of cathode; this distribution corresponds to the simulation process of vertical electrodeposition. The morphologies at different time periods are shown in Fig. 6. At the electrodeposition time of 1 s (Fig. 6a), a mass of nucleation points is distributed and grown uniformly on the surface of ITO; the amount of which exceeds the amount of nucleation in the traditional electrodeposition. After deposition for 2 s (Fig. 6b), the nucleation points continue to agglomerate, grow, and uniformly cover the surface of ITO, indicating that the nucleation rate is promoted greatly. When the electrodeposition time reaches 3 s (Fig. 6c), the primeval morphology of ITO could not be observed, and the volume of new points is larger than that of the above moment, leading to a rough and bulging structure. This result demonstrates that Ni2+ ions could be affected through stronger electromigration, resulting in a driving force that promotes the diffusion motion and coalescence. Finally, rapid nucleation and growth are realized. According to EDS (Fig. S6†) analysis, the content of oxygen element does not further increase, indicating that the oxygen element from the cathode electrodeposited at high potential is still caused by air oxidation.
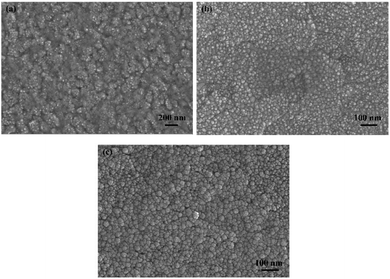 |
| | Fig. 6 Change of morphology in vertical electrodeposition (a) 1 s; (b) 2 s; (c) 3 s. | |
Jet electrodeposition. Under the jet condition with the potential of 0.5 V, the nucleation sites are generated and covered uniformly on the surface of ITO at the initial stage (t = 1 s), as shown in Fig. 7a. At the electrodeposition time of 2 s (Fig. 7b), the volume of nucleation increases obviously, and the morphology appears a hemispherical covering structure, suggesting that the nucleation and growth has reached a high rate with the fast flow and high potential. At 3 s (Fig. 7c), the volume of nucleation expands further, and the trend of morphology shows the development of the dendritic structure, which is completely consistent with the above simulation results. The morphological result confirms that the rate of nucleation and growth could be effectively promoted through the synergy of high potential and fast flow, which likely leads to the generation of dendritic structure. Based on the result of EDS (Fig. S7†), the oxygen content increases obviously in jet electrodeposition. This phenomenon also shows that the anode may be accompanied by the strong oxygen evolution reaction at high potential. Under the influence of strong convection, oxygen concentration on the surface of the cathode is maintained at a high level at all times, leading to a chemical oxidation process in the deposition and the doping of the oxygen element in the nickel lattice.
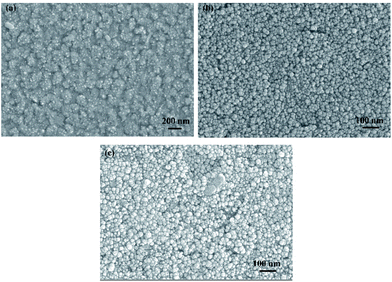 |
| | Fig. 7 Change of morphology in jet electrodeposition (a) 1 s; (b) 2 s; (c) 3 s. | |
Physical characteristic analysis
The electrodeposition microstructures of the surface of ITO under different condition are further investigated via high-resolution transmission electron microscopy (HRTEM). Fig. 8a–c show that the interplanar spacings in the surface of traditional and vertical electrodeposition is 0.202 nm, which corresponds to the (111) plane of metal Ni.16 However, the 0.208 nm for interplanar spacings corresponds to the (200) plane of NiO, as observed on the surface of jet electrodeposition. This result reveals that the jet condition could induce a core–shell structure of NiO@Ni that is decorated on the electrodeposition surface. Furthermore, amorphous structures without obvious interplanar spacings are observed in NiO, suggesting that the combined effect of jet flow and high potential promotes the rapid nucleation process, further resulting in the development of a large amount of defect structure.
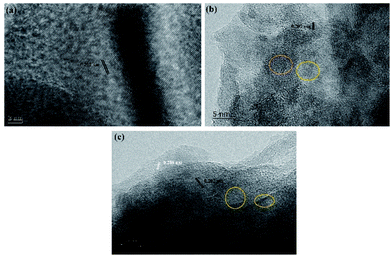 |
| | Fig. 8 HRTEM images (a) traditional electrodeposition, (b) vertical electrodeposition, and (c) jet electrodeposition. | |
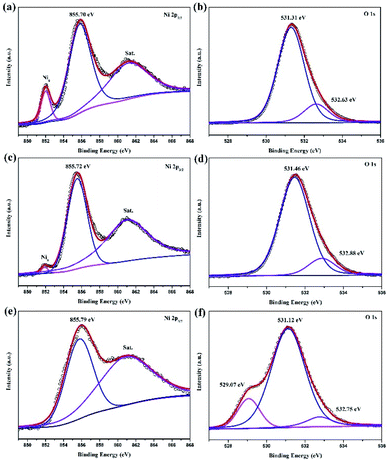
The chemical valence of the electrodeposition surface is probed via X-ray photoelectron spectroscopy (XPS). The high-resolution Ni 2p3/2 spectra are show in Fig. 9a, c and e, corresponding to traditional, vertical and jet electrodeposition, respectively. The three pairs, including metal Ni (852 eV), Ni–O (855.7 eV), and satellite, can be obtained obviously in the surface of traditional and vertical electrodeposition.17,18 However, the peak of metal Ni is weakened in vertical electrodeposition, suggesting that the high potential could lead to a degree of oxidation. Interestingly, this metal Ni peak disappears on the surface of jet electrodeposition combined with a strong oxidation process as compared with the traditional and vertical electrodeposition. Similarly, all O 1s spectra (Fig. 9b, d and f) from samples exhibit two peaks; one is assigned to the air oxidation group and the other to the hydroxyl group from H2O. Furthermore, a slightly negative shift of air oxidation from the 531.46 eV to 531.12 eV suggests the different degrees of oxidation. Meanwhile, a clearly new peak is found at 529.07 eV, corresponding to the metallic oxide,19 and this finding is in good agreement with the microstructure as a core–shell heterostructure of NiO@Ni.
 |
| | Fig. 9 XPS spectra Ni 2p3/2 (a) traditional electrodeposition, (c) vertical electrodeposition, and (e) jet electrodeposition; O 1s (b) traditional electrodeposition, (d) vertical electrodeposition, and (f) jet electrodeposition. | |
The electron structure of the sample at the jet condition is from the X-ray absorption structure (XAS). As shown in Fig. 10a, the Ni K-edge X-ray absorption near-edge structure (XANES) demonstrates that the curve of sample is located between the Ni foil and NiO, suggesting that the valence state of sample is attributed to the Ni0 and Ni2+.20 This result reveals the coexistence of NiO and Ni in the surface of sample that is electrodeposited through the jet condition, which is in accord with the above-mentioned analysis. Ni K-edge X-ray absorption fine structure (EXAFS) characterization is conducted to explore the coordination structure of Ni species. As shown in Fig. 10b, a prominent peak at 2.11 Å is assigned to the Ni–Ni bonds, and a weak signal of Ni–O bonding is located at 1.6 Å.21 This result shows that metal Ni and NiO coexist in the sample prepared via the jet electrodeposition, which is in line with HRTEM and XPS analysis.
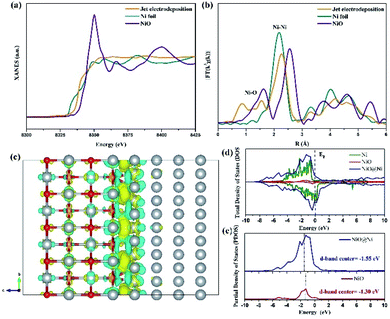 |
| | Fig. 10 (a) The Ni K-edge XANES spectra of sample of jet electrodeposition, Ni foil, and NiO. (b) The corresponding Fourier transformed EXAFS spectra of Ni. (c) The corresponding charge density difference image, where yellow and blue area represent electron accumulation and loss. (d) Total DOS results of NiO@Ni, NiO, and Ni. (e) Projected DOS for the d orbitals of Ni atoms in NiO@Ni and NiO. | |
To reveal the intrinsic contributions of the heterointerface of NiO@Ni, DFT simulation is conducted by using the atomic theoretical models. Fig. 10c shows that the optimized electron density difference is obviously obtained. The electrons transferring from NiO to Ni lattice is due to the strong electronegativity of O atoms, resulting in electron redistribution at NiO@Ni heterointerface. As shown in Fig. 10d, the total density of states (DOS) of NiO@Ni, NiO, and Ni are calculated. The NiO@Ni exhibits the strongest conductivity among the three models. Also, the d-band center of NiO@Ni (−1.55 eV) is downshifted as compared with that of NiO (−1.30 eV) (Fig. 10e). This finding indicated that the bonding strength of H on the heterointerface is weakened and is thus conductive to a rapid HER reaction.22 In addition, NiO structures as active sites could facilitate the OER process effectively, and the heterostructure of NiO@Ni leads to the rapid charge transfer, thereby resulting in an enhanced electrocatalytic performance.23
Conclusions
By the determination of the mechanism of nucleation and growth, which was influenced by the different conditions corresponding to traditional, vertical, and jet electrodeposition, we successfully reveal that the reaction rate in jet electrodeposition is higher than that of traditional electrodeposition through a linear voltammogram. Combined with a novel modelling coupling, the coarse-grained molecular dynamics with diffusion and electromigration, nickel cluster, and particle formation process at the early stage that correspond to traditional, vertical, and jet electrodeposition are simulated, respectively. Results reveal the influence of liquid flow and strong electromigration on rapid nucleation and growth kinetics. The HRTEM micrographs and characteristic analysis indicate that the oxygen element is induced into the surface in jet electrodeposition to form a heterostructure of NiO@Ni, which is further proved with the favourable electrical conductivity and adsorption by DFT simulation. This work provides vital insights into the nickel nucleation and growth process of jet electrodeposition, thereby offering a theoretical and experimental foundation.
Experimental
Reagents and materials
The Watts solution used as the electrodeposition solution was composed of nickel sulfate (NiSO4·6H2O), nickel chloride (NiCl2·6H2O) and boric acid (H3BO3) was. All the reagents were AR grade and not further purified, which were purchased from Shanghai Aladdin Biochemical Technology Co., Ltd.
Electrochemical tests and characterizations
All electrochemical tests were taken using a CHI 760E workstation in the three-electrode cell. ITO conductive glass (10 mm × 15 mm, Wuhu Jinghui Electronics Co., Ltd.) was selected as the working electrode. The surface morphology of ITO was shown in Fig. 11. (It could be seen that the surface roughness and flatness of the ITO were favourable to provide a reliable support for the nucleation deposition of nickel.) Pt foil and saturated calomel electrode (SCE) were employed as the counter and reference electrodes, respectively. The linear voltammogram test is from −1.2 V to −0.5 V vs. SCE with the scan speed of 5 mV s−1. Before the test, ITO was washed in isopropyl alcohol, ethanol and deionized water by ultrasonic for 15 min, respectively, and dried in a vacuum at 60 °C. The solution was stirred further to ensure homogeneous dispersion.
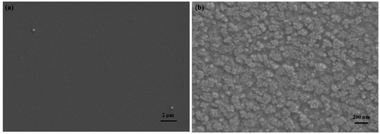 |
| | Fig. 11 Morphology of ITO conductive glass (a) macroscopic; (b) microcosmic. | |
Field-emission scanning electron microscope (SEM) and high-resolution transmission electron microscope (HRTEM) were adopted to examine the morphology and microstructure characteristics of electrodeposition samples. The chemical states and element distribution in the as-prepared samples were investigated by X-ray photoelectron spectroscopy (XPS, Kratos, XSAM-800 spectrometer) and X-ray energy disperse spectrometry (EDS Oxford X-Max). Ni K-edge X-ray absorption spectra (XAS) was obtained at 1W1B station in Beijing Synchrotron Radiation Facility (P. R. China) operated at 2.5 GeV with a maximum current of 250 mA.
Coarse-grained molecular dynamic analysis
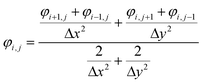
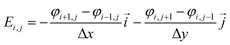
The dynamic deposition process is simulated with the two-dimensional view within a 50 nm × 50 nm domain area. The top boundary is assumed to be anode with an applied positive potential, and the bottom boundary is setting to be cathode with zero potential. Solvents and anions are neglected. The 100 particles are randomly distributed around the top boundary. The length of the simulated domains along the x, z directions are Lx and Lz. The finite difference method (eqn (1)) is used to calculate the distribution of potential field in the simulated domain,24 which is given as| |
 | (1) |
In this domain, the motion of Ni2+ are treated as Brownian controlled via the co-effect of electric field, diffusion and convection.25 Therefore, the equation of motion shows the form as
| |
 | (2) |
where,
r(
t + Δ
t) −
r(
t) represents Δ
r, meaning to the motion distance within Δ
t.
u is the migration rate, which determined by Einstein's relation (
u =
D0/(
F/
RT)).
![[g with combining right harpoon above (vector)]](https://www.rsc.org/images/entities/i_char_0067_20d1.gif)
represents a random two-dimensional unit vector.
E is the electric field intensity corresponding to
t.
D0 is the diffusion coefficient caused by the concentration of solution.
D1 is the diffusion coefficient caused by convection.
Based on the potential field, the distribution of electric field is given by
| |
 | (3) |
And, the particles could be driven in the simulation area, meanwhile, the motion trail is also obtained through eqn (2).
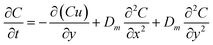
To further solve the diffusion motion, the diffusion coefficient of each part in simulation area would be calculated by monitoring the change of solution concentration in corresponding part. When the particle moves to each part, the diffusion coefficient corresponding to this part would be adopted. Firstly, the relationship between concentration and diffusion coefficient under the combined action of forced convection and diffusion is expressed by Fick's second law:
| |
 | (4) |
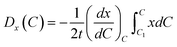
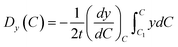
Therefore, the diffusion coefficient in simulation area could be calculated via
| |
 | (5) |
| |
 | (6) |
When the particles move to the cathode surface, the surface diffusion and mobility are mainly controlling factor. After the particle contacting the surface, the tiny clusters generate and move randomly along the surface. In order to minimize the surface energy, the atoms and clusters aggregate with each other. Further, the surface diffusion decreases with an increase of the cluster size. When reaching a setting size, the clusters would form crystal nuclei and deposit on the cathode surface. The surface diffusion coefficient D of one cluster is expressed as
where,
D0 is the surface diffusion coefficient of an adatom.
Nadatoms is the number of adatoms forming the cluster.
α is the relative mobility of clusters, which is chosen as 5.
26 We set that the diffusion motion of the particles (adatoms and clusters) is controlled by a diffusion equation, and the center
r of each particle is updated through
| |
 | (8) |
where,

and
φr = 2π
N with uniform random numbers
N ∈ (0, 1). When the particles and clusters reach the set boundary condition,
, where the
xi and
yi are the components of
r. And, the volume and mass of new particle after coalescence is updated
via 
and
Mnew =
mi +
mj, meanwhile, the new center of particle is calculated through
| |
 | (9) |
Finally, according to the updating of the simulation time step, the simulation of deposition morphology with the time of about 3 s is completed. This influence of substrate is ignored. The initial model under potential field and flow field is shown in Fig. S1.†
DFT calculation
All calculations were carried out by using the projector augmented wave method in the framework of the density functional theory (DFT), as implemented in the Vienna ab initio Simulation Package (VASP). The generalized gradient approximation (GGA) and Perdew–Burke–Ernzerhof (PBE) exchange functional was used.27 The plane-wave energy cutoff was set to 500 eV, and the Monkhorst–Pack method was employed for the Brillouin zone sampling.28 The convergence criterions of energy and force calculations were set to 10−5 eV per atom and 0.01 eV Å−1, respectively. The Ni/NiO interface model was built from the 2 × 5 Ni(111) and 3 × 4 NiO(001) supercells with lattice mismatch less than 5%.29 Removing one O atom from each atomic layer of NiO in the Ni/NiO interface model, the O vacancy defective Ni/NiO interface model was constructed. A vacuum region of 15 Å is applied to avoid interactions between the neighbouring configurations.
Author contributions
Conceptualization, Fan Zhang, Fei Wang; methodology, Fan Zhang and Shenggui Liu; writing, Fan Zhang; supervision, Fei Wang.
Conflicts of interest
We have no conflicts of interest to declare. All co-authors have seen and agree with the contents of the manuscript.
Acknowledgements
The authors wish to thank the following for their financial support: major basic research project of Natural Science Foundation of Shandong Province (Grant No. ZR2020ZD04), Major Research Project of Shandong Province (Grant No. 2018GGX103050).
Notes and references
- V. Torabinejad, M. Aliofkhazraei, S. Assareh, M. H. Allahyarzadeh and A. Sabour Rouhaghdam, J. Alloys Compd., 2017, 691, 841 CrossRef CAS.
- B. Subramanian, S. Mohan and S. Jayakrishnan, J. Appl. Electrochem., 2007, 37, 219 CrossRef CAS.
- P. Baghery, M. Farzam, A. B. Mousavi and M. Hosseini, Surf. Coat. Technol., 2010, 204, 3804 CrossRef CAS.
- W. Zhang, Z. Yu, Z. Chen and M. Li, Mater. Lett., 2012, 67, 327 CrossRef CAS.
- J. Zhou, N. Chen, Y. Ge, H. Zhu, X. Feng, R. Liu, Y. Ma, L. Wang and W. Hou, Sci. China Mater., 2018, 61, 243 CrossRef CAS.
- L. Wang, Y. Li, X. Yin, Y. Wang, A. Song, Z. Ma, X. Qin and G. Shao, ACS Sustainable Chem. Eng., 2017, 5, 7993 CrossRef CAS.
- L. Elias and A. Chitharanjan Hegde, Electrochim. Acta, 2016, 219, 377 CrossRef CAS.
- J. Xiao, H. Tan, Y. Wu, J. Chen and C. Zhang, Surf. Coat. Technol., 2020, 385, 125430 CrossRef CAS.
- J. Li, H. Yu, Q. Sun, Y. Liu, Y. Cui and Y. Lu, Appl. Surf. Sci., 2010, 256, 5046 CrossRef CAS.
- F. Zhang, Z. Yao, O. Moliar, X. Tao and C. Yang, J. Alloys Compd., 2020, 830, 153785 CrossRef CAS.
- C. Wang, L. Shen, M. Qiu, Z. Tian and W. Jiang, J. Alloys Compd., 2017, 727, 269 CrossRef CAS.
- X. Liu, L. Shen, M. Qiu, Z. Tian, Y. Wang and K. Zhao, Surf. Coat. Technol., 2016, 305, 231 CrossRef CAS.
- M. palomar-Pardave, B. R. Scharifker, E. M. Arce and M. Romero-Romo, Electrochim. Acta, 2005, 50, 4736 CrossRef CAS.
- A. Gupta and C. Srivastava, J. Electroanal. Chem., 2020, 861, 113964 CrossRef CAS.
- H. Zargarnezhad and A. Dolati, Electrochim. Acta, 2017, 236, 1 CrossRef CAS.
- A. Aryanfar, D. Brooks, B. V. Merinov, W. A. Goddard, A. J. Colussi and M. R. Hoffmann, J. Phys. Chem. Lett., 2014, 5, 1721 CrossRef CAS PubMed.
- X. Kong, P. E. Rudnicki, S. Choudhury, Z. Bao and J. Qin, Adv. Funct. Mater., 2020, 30, 1910138 CrossRef CAS.
- M. H. Mamme, C. Köhn, J. Deconinck and J. Ustarroz, Nanoscale, 2018, 10, 7194 RSC.
- J. F. Kresse, Phys. Rev. B: Condens. Matter Mater. Phys., 1996, 54, 11169 CrossRef PubMed.
- P. E. Blöchl, Phys. Rev. B: Condens. Matter Mater. Phys., 1994, 50, 17953 CrossRef PubMed.
- S. Dudarev, Phys. Rev. B: Condens. Matter Mater. Phys., 1998, 57, 1505 CrossRef CAS.
- Y. Zeng, Y. Meng, Z. Lai, X. Zhang, M. Yu, P. Fang, M. Wu, Y. Tong and X. Lu, Adv. Mater., 2017, 29, 1702698 CrossRef PubMed.
- Y. Jiao, W. Hong, P. Li, L. Wang and G. Chen, Appl. Catal., B, 2019, 244, 732 CrossRef CAS.
- B. Zhang, K. Jiang, H. Wang and S. Hu, Nano Lett., 2018, 19, 530 CrossRef PubMed.
- B. Wang, C. Tang, H. Wang, X. Chen, R. Cao and Q. Zhang, Adv. Mater., 2019, 31, 1805658 CrossRef PubMed.
- G. Chen, T. Ma, Z. Liu, N. Li, Y. Su, K. Davey and S. Qiao, Adv. Funct. Mater., 2016, 26, 3314 CrossRef CAS.
- H. Sun, Z. Ma, Y. Qiu, H. Liu and G. Gao, Small, 2018, 14, 1800294 CrossRef PubMed.
- D. Ji, J. Sun, L. Tian, A. Chinnappan, T. Zhang, W. A. D. M. Jayathilaka, R. Gosh, C. Baskar, Q. Zhang and S. Ramakrishna, Adv. Funct. Mater., 2020, 30, 1910568 CrossRef CAS.
- J. Chen, J. Liu, J. Q. Xie, H. Ye, X. Z. Fu, R. Sun and C. P. Wong, Nano Energy, 2019, 56, 225 CrossRef CAS.
Footnotes |
| † Electronic supplementary information (ESI) available. See https://doi.org/10.1039/d1ra08926a |
| ‡ These authors contributed equally to this work and should be considered as the co-first authors. |
|
| This journal is © The Royal Society of Chemistry 2022 |
Click here to see how this site uses Cookies. View our privacy policy here. 
 Open Access Article
 This Open Access Article is licensed under a Creative Commons Attribution-Non Commercial 3.0 Unported Licence
 *a
*a


 and φr = 2πN with uniform random numbers N ∈ (0, 1). When the particles and clusters reach the set boundary condition,
  , where the xi and yi are the components of r. And, the volume and mass of new particle after coalescence is updated via
  and Mnew = mi + mj, meanwhile, the new center of particle is calculated through
 × 5 Ni(111) and 3 × 4 NiO(001) supercells with lattice mismatch less than 5%.29 Removing one O atom from each atomic layer of NiO in the Ni/NiO interface model, the O vacancy defective Ni/NiO interface model was constructed. A vacuum region of 15 Å is applied to avoid interactions between the neighbouring configurations.