DOI:
10.1039/D2RA00364C
(Paper)
RSC Adv., 2022,
12, 7157-7163
The corrosion behavior of 304 stainless steel in NaNO3–NaCl–NaF molten salt and vapor
Received
18th January 2022
, Accepted 15th February 2022
First published on 1st March 2022
Abstract
Corrosion behavior of 304 stainless steel in molten NaNO3–NaCl–NaF salt and NaNO3–NaCl–NaF vapor has been studied at 450 °C. The results showed that the samples suffered weight loss, and surface oxides, i.e. Fe2O3 and FeCr2O4 characterized by XRD, were formed after corrosion. The surface oxide layer was about 1.1 μm in thickness after corrosion in molten NaNO3–NaCl–NaF salt, which was relatively homogeneous and dense. Whereas, the distribution of surface oxides was not even, and a shedding phenomenon was observed after corrosion molten NaNO3–NaCl–NaF vapor. This is mainly attributed to the existence of NO2 and NO in the molten NaNO3–NaCl–NaF vapor determined by thermogravimetric infrared spectroscopy, which affected the adherence between oxides and the matrix. Additionally, the corrosion rate of 304 stainless steel in molten NaNO3–NaCl–NaF salt is almost close to that in solar salt, which demonstrates that the synergy influence of Cl− and F− on the rate of 304 stainless steel is not significant. This work not only enriches the database of molten salt corrosion, but provides references for the selection of alloy and molten salt in the CSP.
1. Introduction
Solar salt (NaNO3–KNO3: 60–40 wt%) and Hitec salt (NaNO3–KNO3–NaNO2: 7–53–40 wt%) have been generally regarded as the commercial salts in concentrating solar power (CSP) due to good thermo-physical properties and low cost.1–3 However, the low fusion enthalpy, i.e. 113 J g−1 for solar salt and 60 J g−1 for Hitec salt,4 is a crucial limitation for practical application, which can result in low storage energy density and large container volume when storing the same capacity of energy. It is indispensable to develop a new NaNO3-based molten salt system with high fusion enthalpy. NaNO3–NaCl–NaF is considered as one of the promising candidate thermal energy storage (TES) media due to its superior thermophysical properties, especially relatively high fusion enthalpy 210.0 J g−1, and lower cost.5 Unfortunately, the corrosion behavior of structural materials in the NaNO3–NaCl–NaF system has not been reported until now, which is crucial to select the appropriate structural materials in practice.
Slusser et al.6 investigated the corrosion behavior of nickel- and iron-based alloys in NaNO3–KNO3 (60–40 wt%, solar salt) at 510–750 °C through static immersion tests. Result showed the alloys suffered serious corrosion attack above 650 °C due to the decomposition of nitrate salt. Goods et al.7 determined the corrosion experiment of 304 SS and 316 SS in solar salt, of which result demonstrated that corrosion rate of 304 SS and 316 SS is 6–15 μm year−1 at 570 °C and carbon steel A36 is 1–4 μm year−1 at 316 °C, respectively. Gomes et al.8 examined the corrosion issue of 316L SS and 321H SS in solar salt at 550 °C for 3000 h, and the corrosion rate is 8.6 μm year−1 for 316L SS and 9 μm year−1 for 321H SS, respectively. Fernández et al.9 studied the corrosion issue of A516, T11 and T22 in NaNO3–KNO3–NaNO2 (7–53–40 wt%, Hitec salt) at 390 °C for 2000 h, and the result indicated that these materials exhibited excellent corrosion resistance against Hitec salt. Fernández et al.9 also determined the corrosion behavior of 304 SS, 430 SS and low-Cr alloy steel T22 in NaNO3–KNO3–Ca(NO3)2 (7–45–48 wt%, named as Hitec XL) at 390 °C. The result manifested that 304 SS and 430 SS have better corrosion resistance than low-Cr alloy steel T22. Xie et al.10 investigated the corrosion issue of 310S SS, 316L SS, 321 SS and pure metals in NaNO3–KNO3–LiNO3, and the result showed 310S SS, 316L SS and 321 SS had better corrosion resistance against NaNO3–KNO3–LiNO3 than that of pure metals. In addition, the effect of impurity Cl− on the corrosion behavior of carbon steel A516 Gr70![[thin space (1/6-em)]](https://www.rsc.org/images/entities/char_2009.gif) 11 and carbon steel A51612 in solar salt were investigated. The experimental result showed that the corrosion rate of carbon steel increased with increasing Cl− content of solar salt, and the content of Cl− in solar salt should be strictly controlled in practice. The above results demonstrated that the austenitic SS exhibited a good compatibility with NaNO3-based molten salt and can be considered as one of the candidate structural materials in NaNO3-based molten salt for CSP. Thus, the austenitic 304 SS was chosen as the investigated object for investigating the corrosion behavior in molten NaNO3–NaCl–NaF salt herein, and the synergy influence of Cl− and F− in the molten NaNO3–NaCl–NaF salt on the corrosion behavior of 304 SS is uncertain and will be our major research work herein.
11 and carbon steel A51612 in solar salt were investigated. The experimental result showed that the corrosion rate of carbon steel increased with increasing Cl− content of solar salt, and the content of Cl− in solar salt should be strictly controlled in practice. The above results demonstrated that the austenitic SS exhibited a good compatibility with NaNO3-based molten salt and can be considered as one of the candidate structural materials in NaNO3-based molten salt for CSP. Thus, the austenitic 304 SS was chosen as the investigated object for investigating the corrosion behavior in molten NaNO3–NaCl–NaF salt herein, and the synergy influence of Cl− and F− in the molten NaNO3–NaCl–NaF salt on the corrosion behavior of 304 SS is uncertain and will be our major research work herein.
In the present work, the corrosion behavior of austenitic 304 SS in molten NaNO3–NaCl–NaF (288.2 °C & 94.0–1.8–4.2 wt%) salt and NaNO3–NaCl–NaF (288.2 °C & 94.0–1.8–4.2 wt%) vapor was experimental determined by the static immersion test under the air environment condition. After corrosion, the weight loss and annual corrosion rate of the 304 SS in molten NaNO3–NaCl–NaF salt and NaNO3–NaCl–NaF vapor were accordingly calculated, respectively. The element content, crystal structure, surface and cross section micro-morphology were characterized by inductively coupled plasma-optical emission spectroscopy (ICP-OES), X-Ray Diffraction (XRD), scanning electron microscopy with energy dispersive spectrometer (SEM + EDS). Furtherly, thermogravimetry-infrared (TG-IR) was used to analyze the released substance of molten NaNO3–NaCl–NaF vapor at high temperature in order to deeply explore the corrosion mechanism. To the best of our knowledge, the corrosion behavior of 304 SS in the molten NaNO3-based vapor is firstly investigated. The result not only clarifies the synergy influence of Cl− and F− on the corrosion behavior of 304 SS in molten NaNO3-based salt, but provides guidance and reference for the selection of structural materials in the CSP.
2. Experiment
2.1 Materials
Table 1 lists the composition of the 304 SS used in the present work. Before the corrosion, 304 SS was cut into a size of 15.0 × 10.0 × 2.0 mm3 using the wire cutting machine, and a circular hole with 2 mm diameter was drilled at a distance of 3 mm from the upper end of the 304 SS to facilitate the hanging of samples. The 304 SS samples were ultrasonically cleaned three times to remove the oil on the surface using deionized water and absolute ethanol,13 respectively. Then, the 304 SS samples were ground down to 3000 grit with SiC paper, subsequently 0.05 μm Al2O3 paste was used to polish the samples. Successively, the 304 SS samples were washed ultrasonically by the absolute ethanol and deionized water, and stored in the glove box with high-purity Ar gas.14 Also, the high purity nickel crucible was used as the container due to its high chemical inertness toward the molten NaNO3-based salt, which was cleaned ultrasonically in the absolute ethanol and deionized water for 5–10 minutes,15 then dried in the oven to remove the residual water, finally stored in the aforementioned glove box.
Table 1 Chemical compositions (wt%) of the 304 SS tested in the present work
| Alloy |
Fe |
Cr |
Ni |
S |
Mn |
Si |
C |
P |
N |
| 304 SS |
Bal. |
19.00 |
10.00 |
0.015 |
2.00 |
0.75 |
0.080 |
0.035 |
0.10 |
The NaNO3, NaCl and NaF were bought from the Sinopharm Chemical Regent Co. (Shanghai, China), and the purity is higher than 99.5 wt%. NaNO3–NaCl–NaF (288.2 °C & 94.0–1.8–4.2 wt%) were prepared in advance by means of the same preparation procedure as ref. 16 and stored in the glove box with high-purity Ar gas, where the content of moisture and oxygen is below 1 mg kg−1 and 5 mg kg−1, respectively. Inductively coupled plasma-optical emission spectroscopy (ICP-OES) was employed to detect the impurity content: Fe < 2.94 μg kg−1, Cr < 1.60 μg kg−1, Ni < 2.18 μg kg−1 and Si < 14.3 μg kg−1.
2.2 Methods
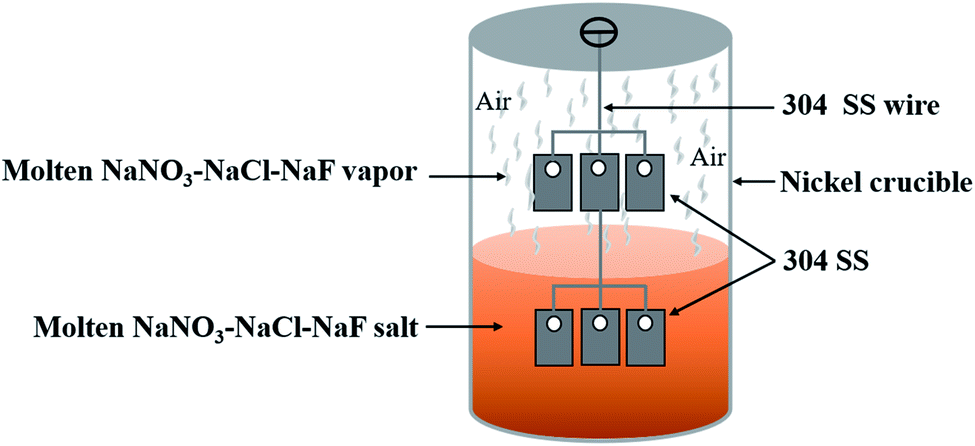
The static corrosion test was employed to investigate the corrosion behavior of 304 SS in NaNO3–NaCl–NaF (288.2 °C & 94.0–1.8–4.2 wt%) system. Two 304 SS samples were hung in series using the 304 SS wire over the hole of the crucible lid. Appropriate quality of the NaNO3–NaCl–NaF was placed into the nickel crucible to ensure the below alloy was completely immersed into the molten NaNO3–NaCl–NaF salt during the experiment, whereas the other alloy was always suspended above the molten salt. Three parallel samples were employed in the present work. The detailed schematic diagram of experimental set-up is displayed in Fig. 1. In order to ensure the experimental stability of the molten NaNO3–NaCl–NaF vapor in the crucible, the hole of the crucible lid and the joint between the crucible cover and the crucible were sealed up using high-temperature glue and cured for 12 h. After that, the experimental set-up is transferred to the high-temperature resistance furnace under the air condition, and high-temperature resistance furnace was heat up 450 °C at the rate of 6 °C min−1, and the experiment was maintained at this temperature for 130 h. Subsequently, the samples were retrieved, cleaned and dried by the same experimental procedures above. The samples will be furtherly characterized.
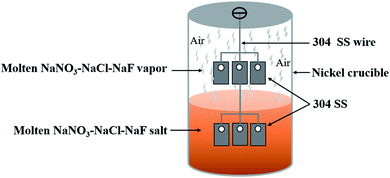 |
| | Fig. 1 Schematic of the corrosion experiment set-up. | |
2.3 Characterization
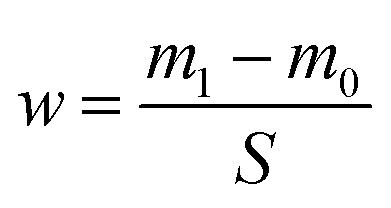
The 304 SS samples are weighed before and after the corrosion experiment using an electronic balance with an accuracy of 0.1 mg. The weight change of 304 SS sample was calculated by the eqn (1).17,18| |
 | (1) |
wherew is the mass change (mg cm−2) of the 304 SS sample after corrosion, m0 and m1 are the mass of 304 SS before and after corrosion, S is the surface area of 304 SS.
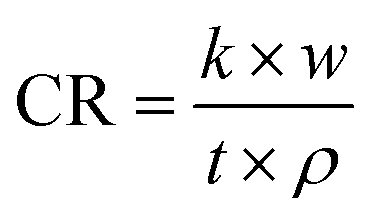
Calculate the annual corrosion rate of 304 SS sample by formula (2):
| |
 | (2) |
Among them, CR is the annual corrosion rate of 304 SS sample (μm year−1), k is a constant 8.76 × 10⁴, w is the mass change of the 304 SS sample per unit area before and after corrosion, t is the corrosion time of the sample, and ρ is 304 SS alloy density.
ICP-OES (Arcos Sop, Spectro) was used to analyze the content of impurities in the molten salt, and TG-IR (PerkinElmer TGA 8000-Spectrum two-Clarus SQ8T) was employed to detect the volatile gas of molten salt at high temperature, and XRD (Bruker D8 Advance) was used to characterize the crystal structure of 304 SS samples. The micro-morphology and element distribution of the 304 SS sample were characterized by SEM (Zeiss Merlin compact) and EDS (Oxford Instruments X-Max, 80 mm2), respectively.
3. Results
3.1 Mass change
According to the eqn (1) and (2), the weight change and annual corrosion rate of 304 SS in the molten NaNO3–NaCl–NaF salt and NaNO3–NaCl–NaF vapor were obtained and shown in Table 2. 304 SS experienced a significant weight loss under the two different corrosion conditions as displayed in Table 2. According to the ref. 8, the result indicates that the corrosion of the alloy rather than oxidation dominantly influenced the corrosion behavior of 304 SS after exposed 130 h to molten NaNO3–NaCl–NaF salt and NaNO3–NaCl–NaF vapor at 450 °C. Additionally, the weight loss 0.187 mg cm−2 of 304 SS after corroded by molten NaNO3–NaCl–NaF salt is much lower than that corroded by molten NaNO3–NaCl–NaF vapor 0.292 mg cm−2. Meanwhile, the corrosion rate of 304 SS after corrosion has the same trend as that of weight loss. Although the annual corrosion rate herein was not the true corrosion rate of 304 SS in the molten NaNO3–NaCl–NaF salt, but it can reflect the relative relation. The calculated corrosion rate 15.87 μm year−1 is almost close to that of 304 SS 15.0 μm year−1 after corroded by solar salt at 570 °C despite the different corrosion temperature.7 Additionally, the above findings also manifested that the 304 SS suffered relatively more serious corrosion attack in molten NaNO3–NaCl–NaF vapor than that in molten NaNO3–NaCl–NaF salt.
Table 2 Calculated weight change and annual corrosion rate of 304 SS after corroded by molten NaNO3–NaCl–NaF salt and NaNO3–NaCl–NaF vapor at 450 °C for 130 h
| |
NaNO3–NaCl–NaF |
NaNO3–NaCl–NaF vapor |
| w (mg cm−2) |
−0.187 |
−0.292 |
| CR (μm year−1) |
15.87 |
24.88 |
3.2 Crystalline structure
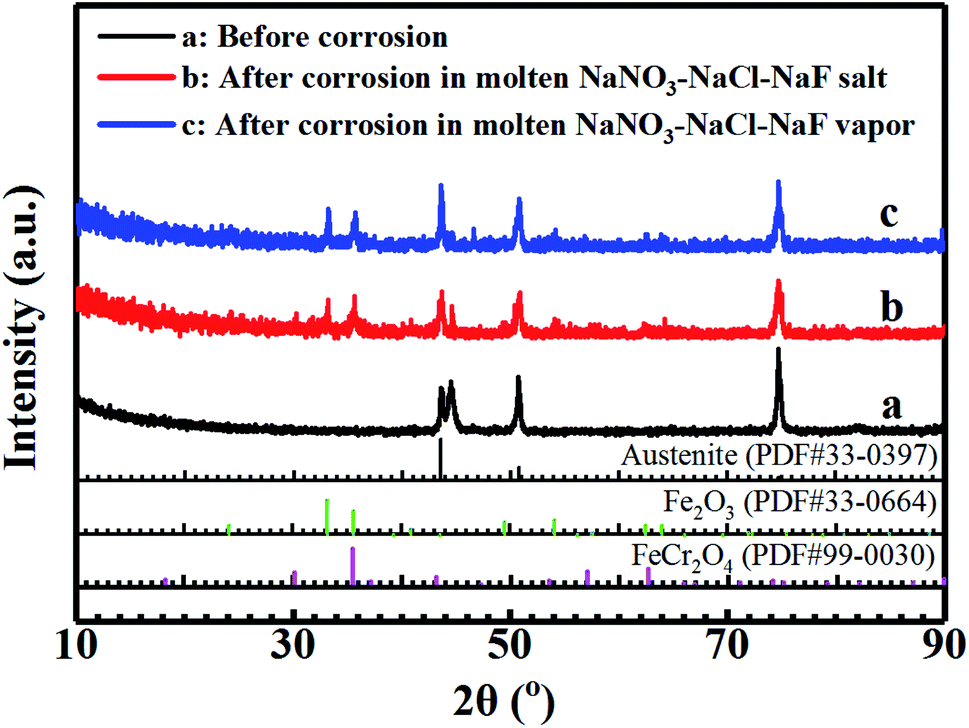
Fig. 2 shows the XRD patterns of 304 SS surface before corrosion, after corrosion in molten NaNO3–NaCl–NaF salt and molten NaNO3–NaCl–NaF vapor. Obviously, the characteristic peaks at (110), (200) and (220) were clearly observed,19 manifesting that 304 SS is face-centred cubic (fcc) structure before corrosion. Compared with the XRD pattern of 304 SS surface before corrosion, the oxides Fe2O3 and FeCr2O4 was also formed on the surface of 304 SS after corrosion except for its intrinsic face-centred cubic (fcc) characteristic peaks. Meanwhile, the surface oxides species formed are the same under the two different conditions, indicating that 304 SS may suffered the similar corrosion attack. This is attributed to the inter-reaction of element Fe and Cr and the O2 of the air, which will be discussed in the following part.
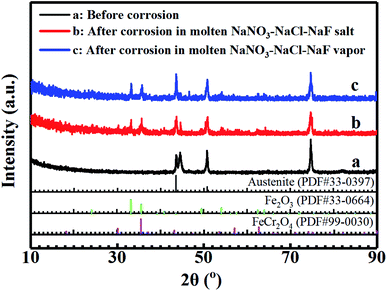 |
| | Fig. 2 XRD patterns of the surface of 304 SS sample before (a), after molten NaNO3–NaCl–NaF salt vapor corrosion (b), and after molten NaNO3–NaCl–NaF salt corrosion (c). | |
3.3 Surface micro-morphology
Fig. 3 shows the surface micro-morphology of 304 SS before corrosion and after corrosion. Before corrosion, the surface of 304 SS is relatively smooth without corrosion trails except for the pretreatment lines from the fresh sample as shown in Fig. 3(a). After corrosion in the molten NaNO3–NaCl–NaF salt, the surface micro-morphology of 304 SS is quite different from that of before corrosion. A layer of relatively uniform substance was formed on the surface of the 304 SS, which has different size marked by yellow dotted circle of Fig. 3(b) and various shapes such as circle, oval and so on. Additionally, the gully marked by the yellow dotted lines between the new substances can be significantly observed from Fig. 3(b), which indicates the new substance formed on the surface of the 304 SS is not completely dense. Fig. 3(b-1) demonstrates the local enlarge area of A1 from Fig. 3(b), where the lamelliform and solid nubbly-shape new substances and hole with 450 nm diameter were clearly seen. The result also demonstrates that the new substance formed on the surface of 304 SS is loose and inregular after corroded by molten NaNO3–NaCl–NaF salt, which may not be served as protection of alloy suffered corrosion attack of molten salt.
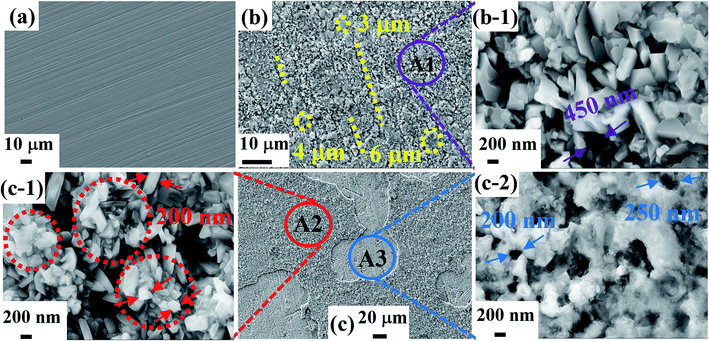 |
| | Fig. 3 Surface micro-morphology of 304 SS before corrosion (a), after corrosion in molten NaNO3–NaCl–NaF salt (b) and molten NaNO3–NaCl–NaF vapor (c). (local enlarged region of A1 (b-1), local enlarged region of A2 (c-1) and local enlarged region of A3 (c-2)). | |
 |
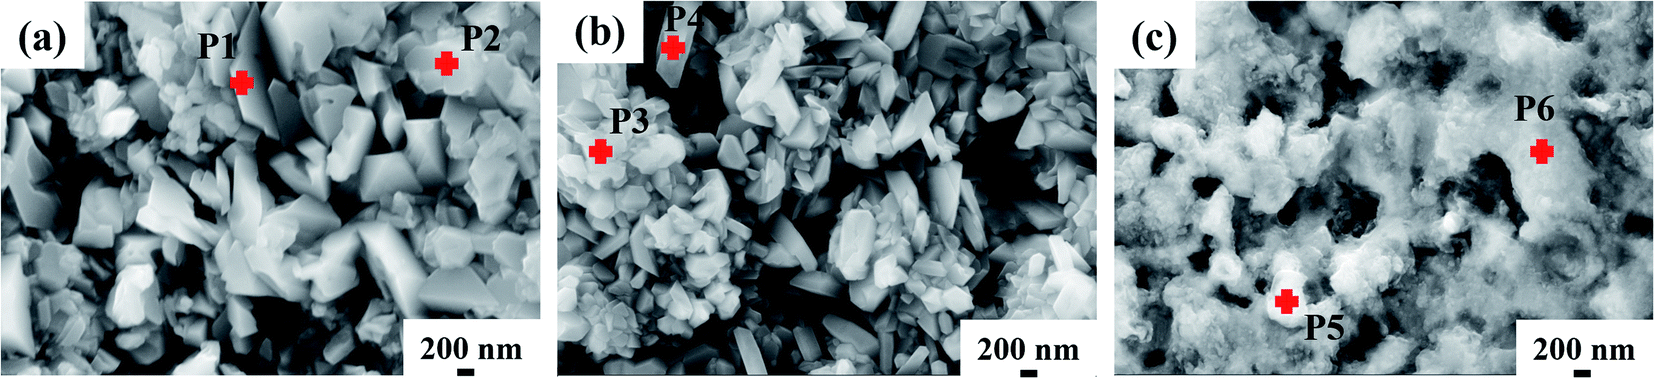
| | Fig. 4 Point analysis of surface micro-morphology of 304 SS after corrosion in molten NaNO3–NaCl–NaF salt (a) and molten NaNO3–NaCl–NaF vapor (b) and (c). (b denotes the new substance formed on the surface of 304 SS, and C refers to the area without new substance). | |
Whereas, a layer of new substance formed on the 304 SS surface and the extensive area shedding phenomenon were clearly observed from Fig. 3(c), the result manifests that the bonding force between the new substance and 304 SS matrix is poor. Fig. 3(c-1) and (c-2) were the local magnified area marked by A2 and A3, respectively. Rodlike and granulate substance with the 100–250 nm in size was significantly seen in Fig. 3(c-1). Meanwhile, the obvious agglomeration phenomenon of the new substance was also observed and marked by red dotted circle, which is very different from that of Fig. 3(b-1). In addition, the corrosion holes with the diameter in 200–250 nm were significantly seen from Fig. 3(c-2). Combining the above experimental results and related discussion, it can be suggested that 304 SS suffered more serious corrosion attack in molten NaNO3–NaCl–NaF vapor than that in molten NaNO3–NaCl–NaF salt.
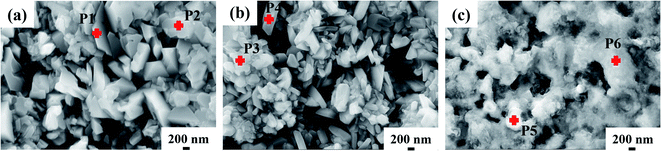
In order to verify the surface substance of 304 SS after corrosion, point scanning of Energy Dispersive X-ray Spectrometers (EDS) of SEM was used to measure the element composition of new substance formed on the surface of 304 SS. Table 3 shows the elemental composition of the new substance. After corrosion in molten NaNO3–NaCl–NaF salt, the substance formed on the surface of 304 SS is mainly composed of Fe–Cr oxides. The result is in good consistence with the data from XRD. Meanwhile, the substance formed on the surface of 304 SS is also composed of Fe–Cr oxides after corrosion in molten NaNO3–NaCl–NaF vapor, which agrees well with the result (Fe2O3 and FeCr2O4) of XRD. The area without new formed substance is mainly composed of the 304 SS matrix, where the main element Fe and Ni are depleted from the matrix compared with the 304 SS matrix before corrosion.
Table 3 Chemical composition (wt%) obtained from EDS of the sample surfaces from Fig. 4
| Element |
Fe |
Ni |
Cr |
O |
| P1 |
64.97 ± 0.25 |
— |
3.31 ± 0.10 |
27.26 ± 0.19 |
| P2 |
60.22 ± 0.27 |
— |
1.98 ± 0.09 |
31.22 ± 0.21 |
| P3 |
56.74 ± 0.26 |
— |
1.95 ± 0.08 |
32.27 ± 0.21 |
| P4 |
63.19 ± 0.24 |
— |
2.70 ± 0.09 |
28.40 ± 0.19 |
| P5 |
51.25 ± 0.31 |
12.42 ± 0.26 |
14.49 ± 0.17 |
5.59 ± 0.12 |
| P6 |
44.69 ± 0.30 |
31.60 ± 0.32 |
11.82 ± 0.16 |
6.33 ± 0.12 |
3.4 Cross-sectional micro-morphology
Fig. 5 shows the cross-sectional micro-morphology of the 304 SS sample after corrosion. A layer of film was formed on the surface of the 304 SS after corrosion. Meanwhile, the film was not completely covered on the surface of the 304 SS matrix observed from Fig. 5(a) and (b), which indicate the connecting force of the film is not strong and prone to fall off. The result is in good consistence with the data of weight loss and surface micro-morphology. Additionally, the depth of the film was quite different. After corrosion in molten NaNO3–NaCl–NaF salt, the maximum thickness of the film is 1.6 μm, and the minimum thickness is only 0.5 μm. Whereas, the film after corrosion in molten NaNO3–NaCl–NaF vapor is slightly thicker than that after corrosion in molten NaNO3–NaCl–NaF salt. The average thickness of the film is 1.8 μm, and the minimum thickness is also up to 1.0 μm.
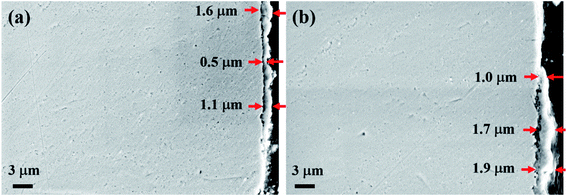 |
| | Fig. 5 Cross-sectional micro-morphology of 304 SS sample after corrosion in molten NaNO3–NaCl–NaF salt (a) and in molten NaNO3–NaCl–NaF vapor (b). | |
Fig. 6 shows the cross-sectional element distribution of 304 SS after corrosion in molten NaNO3–NaCl–NaF salt and in molten NaNO3–NaCl–NaF vapor, respectively. The film of the 304 SS cross section is mainly composed of element Fe, Cr and O, which is also verified by the composition of point P7 and P8 listed in Table 4. The result also agrees well with the result of surface micro-morphology and XRD.
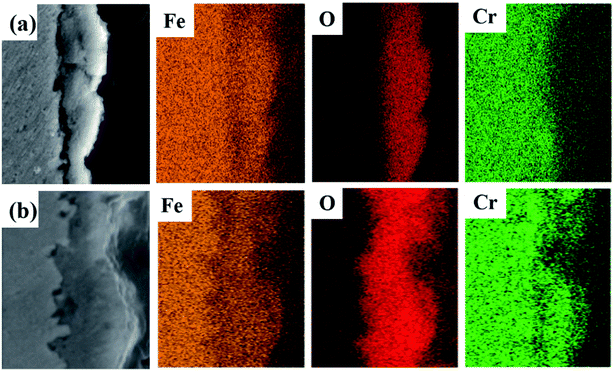 |
| | Fig. 6 Cross-section and element EDS mapping of 304 SS after corrosion in molten NaNO3–NaCl–NaF salt (a) and in molten NaNO3–NaCl–NaF vapor (b). | |
Table 4 Chemical composition (wt%) obtained from EDS of the sample cross section (Fig. 6)
| Element |
Fe |
Ni |
Cr |
O |
| P7 |
54.99 ± 0.76 |
— |
1.97 ± 0.09 |
36.32 ± 0.53 |
| P8 |
42.73 ± 0.27 |
— |
16.59 ± 0.18 |
38.55 ± 0.24 |
4. Discussion
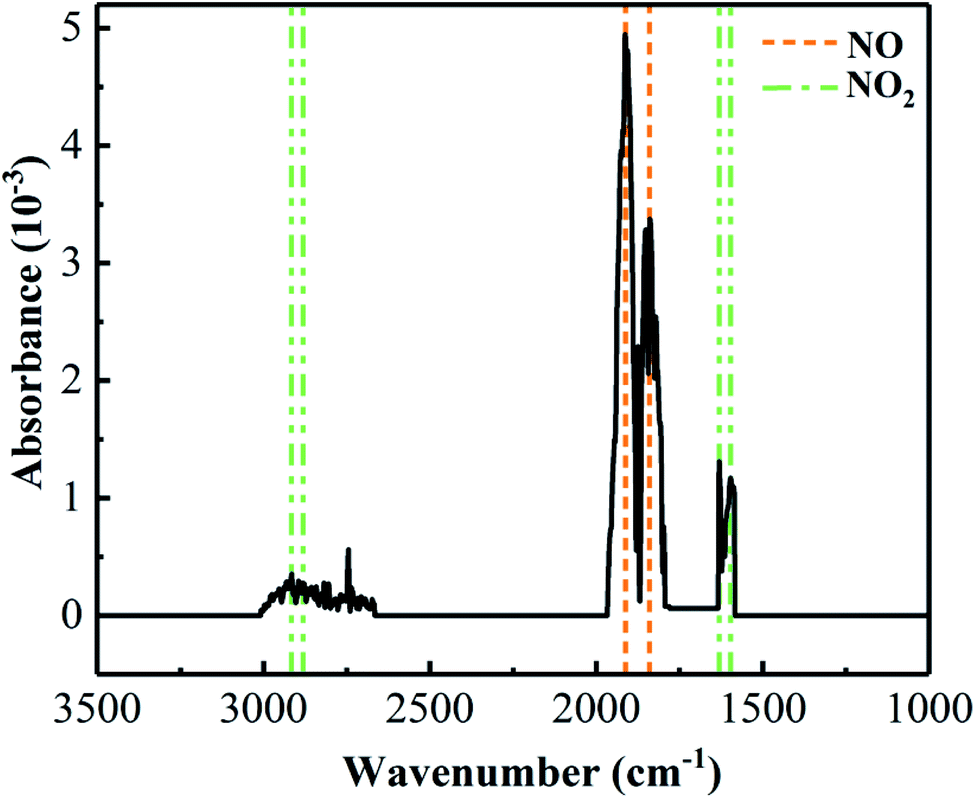
Due to the low stability of molten nitrated salt at high temperature, molten nitrate-based salt will decompose and produce complicate substances such NO, N2O, NO2, NaNO2 and so on.20 In the present work, the decomposition substances of molten NaNO3–NaCl–NaF salt are essential and important to investigate the corrosion behavior of 304 SS in the molten NaNO3–NaCl–NaF vapor. Whether high corrosive HCl and HF gas can be formed or not when the NaCl and NaF were added into NaNO3, which is quite important. Thermogravimetric infrared spectroscopy (TG-IR) was used to examine the decomposition substances of molten NaNO3–NaCl–NaF salt. Fig. 7 shows the infrared spectrum of volatile gases in molten NaNO3–NaCl–NaF salt in the range of 700 °C. The result shows that the decomposition substances NO and NO2 gas are significantly observed in Fig. 7, and not highly corrosive HCl and HF gas, which provides a direct guidance to explore the corrosion mechanism in the molten NaNO3–NaCl–NaF vapor.
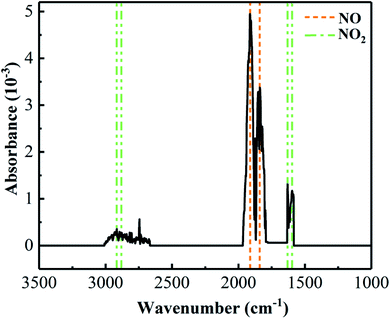 |
| | Fig. 7 Infrared spectrum of NaNO3–NaCl–NaF molten salt volatile gas from RT to 700 °C at the heating rate 10 °C min−1 under the Ar gas condition. | |
Based on the weight loss of the 304 SS, the corrosion of the 304 SS is the primary influence factor rather than its oxidation in molten NaNO3–NaCl–NaF salt and NaNO3–NaCl–NaF vapor, respectively. This is mainly attributed to the influence of the dissolved Cl− on the oxides of 304 SS matrix because of the small radius and good penetration property, where Cl− can preferentially adsorb on the oxides and replace the oxygen atoms, then recombine with the cations to form the soluble chlorides, i.e. FeCl3, FeCl2 and CrCl3, subsequently cause the corrosion of the 304 SS.8 The corresponding the reaction equations are shown as follows.
| | |
FeO + Cr2O3 → FeCr2O4
| (6) |
| | |
6Cl− + Fe2O3 → 2FeCl3 + 3O2−
| (7) |
| | |
6Cl− + Cr2O3 → 2CrCl3 + 3O2−
| (8) |
| | |
6Cl− + FeO → 2FeCl2 + 3O2−
| (9) |
whereas, the calculated corrosion rate of 304 SS in molten NaNO
3–NaCl–NaF salt (15.87 μm year
−1) is nearly close to that of 304 SS (15.0 μm year
−1) in solar salt at 570 °C.
7 The result indicates that synergy influence of Cl
− and F
− on the corrosion of 304 stainless steel is not significant. Additionally, the effect of Cl
− content in the molten NaNO
3–NaCl–NaF salt on the corrosion rate (15.87 μm year
−1) of 304 SS is much lower than that of carbon steel A516 Gr70 (1531 μm year
−1) in NaNO
3–KNO
3 (60–40 wt%) at 450 °C.
21 This is mainly attributed to the Cl
− herein is the main molten salt media and not the same as the traditionally impurity Cl
−. Meanwhile, the moisture of the molten NaNO
3–NaCl–NaF salt is relatively minuscule because of the especial protective measures for molten salt, and then content of strong corrosive HCl acid produced in molten salt is also few. Thus, the corrosion rate of the 304 SS herein is relatively lower than that the same content of impurity Cl
− in NaNO
3-molten salt, which is quite helpful to enlarge the practical application of the molten NaNO
3–NaCl–NaF salt.
The oxides Fe2O3 and FeCr2O4 formed on the surface of the 304 SS is ascribed to the reaction of element of Fe and Cr with O2 from the air, of which reaction are shown in eqn (3)–(6). This is in good agreement with the literature.8,22 In addition, the oxides on the surface of 304 SS is more uniformly distributed in molten NaNO3–NaCl–NaF salt, due to its completely submersion in molten salt, than that in molten NaNO3–NaCl–NaF vapor. Furthermore, the oxide shedding of 304 SS after exposed to molten NaNO3–NaCl–NaF vapor is caused by the NO and NO2 gas examined by TG-IR. The NO and NO2 gas can be produced by the decomposition of NaNO3 in the molten NaNO3–NaCl–NaF salt shown in the following eqn (10)–(12), which can result in a lack of adherence between 304 SS and oxides and cause the oxides shedding in serve case, subsequently causing more serious corrosion. This also assists in explaining the more serious corrosion attack in molten NaNO3–NaCl–NaF vapor.
| | |
2NaNO3 → 2NaNO2 + O2
| (10) |
| | |
4NaNO3 → 2Na2O + 4NO2 + O2
| (11) |
| | |
4NaNO2 → 2Na2O + 4NO + O2
| (12) |
The above findings indicate that the 304 SS experienced almost the same corrosion attack in molten NaNO3–NaCl–NaF salt as that in molten solar salt. The effect of Cl− and F− from the molten NaNO3–NaCl–NaF salt on the corrosion behavior of 304 SS can not be obvious compared with the traditionally point of view due to the various experimental condition. Whereas, the influence of molten NaNO3–NaCl–NaF vapor on the corrosion attack of 304 SS is more serious than that in molten NaNO3–NaCl–NaF salt, which should attract worldwide attention in practice.
5. Conclusions
Under the air condition, the corrosion behavior and mechanism of 304 SS was investigated after exposed to molten NaNO3–NaCl–NaF salt and NaNO3–NaCl–NaF vapor for 130 h at 450 °C, respectively. Compared with the relatively uniform oxide layer on the surface of the 304 SS after corrosion in molten NaNO3–NaCl–NaF salt, the oxides, i.e. Fe2O3 and FeCr2O4, are not evenly distributed on the surface of 304 SS, and even the peeling of oxides scale occur. Most importantly, the corrosion rate of 304 SS in molten NaNO3–NaCl–NaF salt is almost the same as that of solar salt, which indicates the influence of Cl− on the corrosion attack of 304 SS is not significant compared with that of the traditional standpoint. In addition, the NO and NO2 gas can produce characterized by TG-IR due to the high-temperature decomposition of NaNO3. Furtherly, the nitrate vapor will aggravate the corrosion attack of structural material, which can not be ignored in practice and should attract the considerable attention. The corrosion issue of 304 SS in nitrate vapor is studied firstly, which is quite beneficial to enrich the corrosion database. This work not only provides a different viewpoint of the effect of Cl− on the corrosion behavior of 304 SS in molten NaNO3–NaCl–NaF salt, but provides references for the choice of molten salt and structural materials in practice.
Conflicts of interest
The authors declare that they have no known competing financial interests or personal relationships that could have appeared to influence the work reported in this paper.
Acknowledgements
Supported by National Natural Science Foundation of China (52076006), Natural Science Foundation of Gansu Province (20JR5RE638), Natural Science Foundation of Qinghai Province (2021-ZJ-912) and “Transformational Technologies for Clean Energy and Demonstration”, Strategic Priority Research Program of the Chinese Academy of Sciences (XDA21080000).
References
- A. Ibrahim, H. Peng, A. Riaz, M. A. Basit, U. Basit and A. Basit, Sol. Energy Mater. Sol. Cells, 2021, 219, 110768 CrossRef CAS.
- M. Vaka, R. Walvekar, P. Jagadish, M. Khalid, N. M. Mubarak and H. Panchal, Energy Storage, 2020, 32, 101981 CrossRef.
- V. M. B. Nunes, C. S. Queirós, M. J. V. Lourenço, F. J. V. Santos and C. A. Nieto de Castro, Appl. Energy, 2016, 183, 603–611 CrossRef CAS.
- T. Bauer, N. Pfleger, F. Laing, W. Steinmann, M. Eck and S. Kaesche, Molten Salts Chemistry, 2013, pp. 415–438 Search PubMed.
- Q. Peng, J. Ding, X. Wei and G. Jiang, Thermochim. Acta, 2017, 654, 28–34 CrossRef CAS.
- J. W. Slusser, J. B. Titcomb, M. T. Heffelfinger and B. R. Dunbobbin, J. Occup. Med., 1985, 37, 24–27 CAS.
- S. H. Goods and R. W. Bradshaw, J. Mater. Eng. Perform., 2004, 13, 78–87 CrossRef CAS.
- A. Gomes, M. Navas, N. Uranga, T. Paiva, I. Figueira and T. C. Diamantino, Sol. Energy, 2019, 177, 408–419 CrossRef CAS.
- A. G. Fernández, A. Rey, I. Lasanta, S. Mato, M. P. Brady and F. J. Pérez, Mater. Corros., 2014, 65, 267–275 CrossRef.
- W. Xie, J. Ding, X. Wei, W. Wang, G. Xia and J. Xing, Energy Procedia, 2019, 158, 4897–4902 CrossRef CAS.
- C. Prieto, J. Gallardo-González, F. J. Ruiz-Cabañas, C. Barreneche, M. Martínez, M. Segarra and A. I. Fernández, Sol. Energy Mater. Sol. Cells, 2016, 157, 526–532 CrossRef CAS.
- F. J. Ruiz-Cabañas, C. Prieto, R. Osuna, V. Madina, A. I. Fernández and L. F. Cabeza, Sol. Energy Mater. Sol. Cells, 2017, 163, 134–147 CrossRef.
- A. Rami, Y. Mohammed, F. M. Ahmed, A. Turki and K. H. Mohamed, Materials, 2022, 15, 260 Search PubMed.
- H. Yin, Y. Zhou, Q. Liu, Y. Wang, Z. Tang and L. Yan, J. Alloys Compd., 2021, 887, 161387 CrossRef CAS.
- S. Gudić, V. Ladislav, K. Dario and N. Aleš, Materials, 2022, 14, 7495 CrossRef PubMed.
- Y. Wang, C. Ling, H. Yin, W. Liu, Z. Tang and Z. Li, Sol. Energy, 2020, 204, 667–672 CrossRef CAS.
- Q. Liu, H. Sun, H. Yin, L. Guo, J. Lin and Z. Tang, Corros. Sci., 2019, 160, 108174 CrossRef CAS.
- K. Wang, L. Jiang, X. Ye, J. Liang, C. Li, F. Liu and Z. Li, Nucl. Sci. Tech., 2021, 32, 140 CrossRef.
- H. Yin, J. Qiu, H. Liu, W. Liu, Y. Wang, Z. Fei, S. Zhao, X. An, J. Cheng, T. Chen, P. Zhang, G. Yu and L. Xie, Corros. Sci., 2018, 131, 355–364 CrossRef CAS.
- Z. Fei, Y. Zhang, M. Ge, Y. Wang, Y. Li, J. Cheng, B. Wei, H. Hou and H. Liu, Sol. Energy, 2019, 183, 823–828 CrossRef CAS.
- R. W. Bradshaw and W. M. Clift, Sandia Report, Sand2010-7594, United States, 2010 Search PubMed.
- D. A. Soleimani, R. N. Durham and M. C. Galetz, Sol. Energy Mater. Sol. Cells, 2016, 144, 109–116 CrossRef.
|
| This journal is © The Royal Society of Chemistry 2022 |
Click here to see how this site uses Cookies. View our privacy policy here. 
 Open Access Article
 This Open Access Article is licensed under a Creative Commons Attribution-Non Commercial 3.0 Unported Licence
 a,
Li Gao*a and
Zhongfeng Tang
a,
Li Gao*a and
Zhongfeng Tang