 Open Access Article
Blue-red emitting materials based on a pyrido[2,3-b]pyrazine backbone: design and tuning of the photophysical, aggregation-induced emission, electrochemical and theoretical properties†
Deepak M. Kapsea,
Pooja S. Singha,
Mohammed Ghadiyalib,
Sajeev Chackob and
Rajesh M. Kamble *a
*a
aDepartment of Chemistry, University of Mumbai, Santacruz (E), Mumbai 400 098, India. E-mail: kamblerm@chem.mu.ac.in
bDepartment of Physics, University of Mumbai, Santacruz (E), Mumbai 400 098, India
First published on 1st March 2022
Abstract
Pyrido[2,3-b]pyrazine-based donor–acceptor–donor (D–A–D) molecules were designed by altering donor amines and synthesized using the Buchwald–Hartwig C–N coupling reaction. Further, the tunable opto-electrochemical properties of the dyes were studied in detail. The dye possesses intramolecular charge transfer (ICT) transition (412–485 nm), which marked the D–A architecture and induces a broad range of emissions from blue to red (486–624 nm) in the solution and solid state. Some of the dyes show aggregation-induced emission (AIE) features and formation of nanoparticles in the THF/H2O mixture, as confirmed by DLS and FEG-SEM (of 7) analysis. The AIE characteristics indicate its solid/aggregate-state application in organic electronics. The molecules exhibit high thermal stability, low band gap (1.67–2.36 eV) and comparable HOMO (−5.34 to −5.97 eV) and LUMO (−3.61 to −3.70 eV) energy levels with those of reported ambipolar materials. The relationship between the geometrical structure and optoelectronic properties of the dyes, as well as their twisted molecular conformation and small singlet and triplet excitation energy difference (ΔEST = 0.01–0.23 eV) were analyzed using the DFT/TDDFT method. Thus, potential applications of the dyes are proposed for optoelectronic devices.
Introduction
The relationship between the structure and opto-electrochemical properties of small donor–acceptor (D–A) molecules has been heavily investigated in the recent past.1 Compared to polymeric materials, small D–A molecules have higher solubility in organic solvents, a defined molecular structure, and can be easily purified with reliable reproducibility. Additionally, these small D–A molecules possess intramolecular charge transfer (ICT) properties that can be exploited for tuning emission and electrochemical characteristics.1The only major drawback is the aggregation-caused quenching (ACQ) phenomenon observed in planar D–A molecules as it causes quenching of emission hindering its application in organic light-emitting diodes (OLEDs).2 However, ACQ can be overcome by simply having non-planar/twisted D–A molecules; here, the aggregation-induced emission (AIE) takes precedence through the assistance of restricted intramolecular rotation (RIR) and changes in the conformation of molecules in the aggregate state.2 Further, twisted D–A systems can have adequately separated highest occupied (HOMO) and lowest unoccupied (LUMO) molecular orbitals with small energy gaps (ΔEST) between the singlet (S1) and triplet (T1) states. This indicates an efficient reverse intersystem crossing (RISC) process for the upconversion of T1 → S1 excitons, possessing competent thermally activated delayed fluorescence (TADF) properties.3
Further, there is a scarcity of environmentally stable ambipolar materials, i.e. materials exhibiting electron and hole transport within the same molecule. This property enhances the power efficiency of devices, signifying the need for its development.4 A known route for its development is by introducing electron-withdrawing groups (perfluorinated alkyl chains, cyano and carbonyl) or a more electronegative atom than carbon in an extended p-type material.5
From the literature, D–A molecules with acceptors such as quinoxaline,6 indolo-quinoxaline,7 pyrido[2,3-b]pyrazine,8 and phenazine9 are well known, due to their excellent semiconducting and highly emissive properties with outstanding AIE and TADF characteristics. Here, the pyrido[2,3-b]pyrazine acceptor is notable for its high electron-accepting ability, due to its additional pyridine N-atoms in the fused ring mimicking quinoxaline. Hence, it is used for the fabrication of electro-conductive and ambipolar electroluminescent devices,8 while donors such as tri/diarylamines, carbazole, phenothiazine, and phenoxazine are generally used in the D–A system, as they help to tune optoelectronic properties, offering high conductivity and thermal stability.3d,10
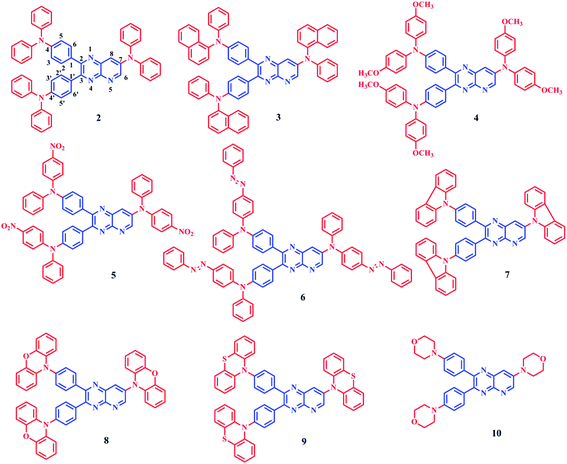
In this work, we designed and synthesized D–A–D structured dyes 2–10 having pyrido[2,3-b]pyrazine acceptor and various diarylamines/heterocyclic amine donor groups. The standard Buchwald–Hartwig coupling amination reaction11 is used for the synthesis and dyes have been characterized using spectroscopic techniques. The study presented here encompasses, tuning photophysical, aggregation-induced emission and electrochemical properties by modulating donor groups. Then, DFT and TDDFT techniques are used to understand the correlation between structure and properties; and the determination of ΔEST. The structures of dyes 2–10 are shown in Fig. 1.
Results and discussion
Synthesis and characterization
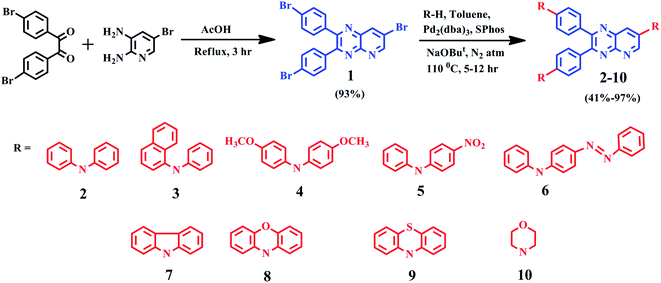
Molecule 1, was synthesized by condensing 4,4′-dibromobenzil and 5-bromo-2,3-diaminopyridine in glacial acetic acid. For dyes 2–10, the Buchwald–Hartwig coupling amination reaction11 was employed to couple electron-donating diarylamines/heterocyclic amines at 4, 4′ and 7th position of molecule 1. Products were purified by column chromatography using eluent n-hexane![[thin space (1/6-em)]](https://www.rsc.org/images/entities/char_2009.gif) :
:![[thin space (1/6-em)]](https://www.rsc.org/images/entities/char_2009.gif) chloroform with a yield of 41–97% as yellow-red solids. The identity and purity of products were confirmed by 1H, 13C NMR spectroscopy (ESI Fig. S30–S39†), FT-IR (ESI Fig. S25–S29†), MALDI-TOF mass spectrometry (ESI Fig. S20–S24†) and elemental analysis. The detailed synthesis route is shown in Scheme 1 and spectral characterization data is depicted in the experimental section.
chloroform with a yield of 41–97% as yellow-red solids. The identity and purity of products were confirmed by 1H, 13C NMR spectroscopy (ESI Fig. S30–S39†), FT-IR (ESI Fig. S25–S29†), MALDI-TOF mass spectrometry (ESI Fig. S20–S24†) and elemental analysis. The detailed synthesis route is shown in Scheme 1 and spectral characterization data is depicted in the experimental section.
Photophysical properties
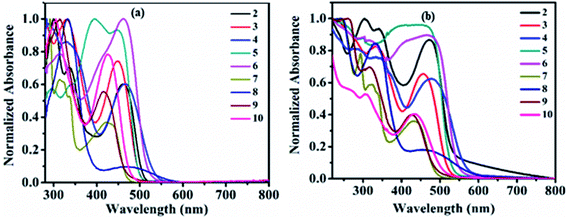
The study of the charge transfer transition and fluorescence properties of dyes 2–10 in the solid film and different polarity of solvents; toluene, tetrahydrofuran (THF), chloroform (CHL), dichloromethane (DCM), and dimethyl sulfoxide (DMSO) was conducted using UV-visible and fluorescence spectroscopy techniques. Absorption spectra of dyes 2–10 in toluene and solid films are given in Fig. 2 (for other solvents ESI Fig. S4†). Emission spectra in toluene, DCM and solid films are given in Fig. 3(a, b) and 6(a) (for other solvents ESI Fig. S5†). The relevant noteworthy photophysical data are summarized in Tables 1 and 2.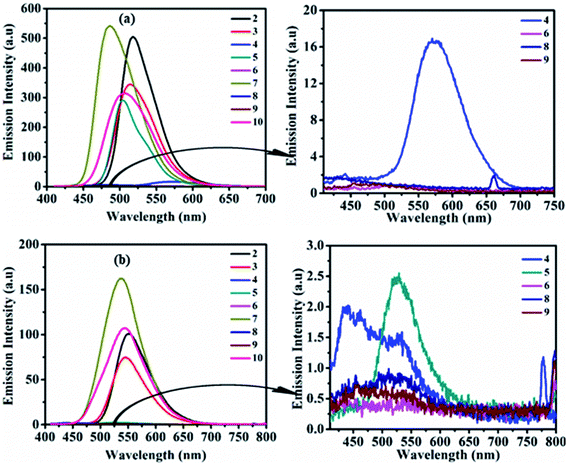 | ||
| Fig. 3 Emission spectra of 2–10 (left) and of weak/non-emissive molecules (right) in toluene (a) and DCM (b) (excitation of molecules 2–10 done at their respective ICT λmax). | ||
| Dye | λabsa,b, nm (log![[thin space (1/6-em)]](https://www.rsc.org/images/entities/char_2009.gif) εmax M−1 cm−1) εmax M−1 cm−1) |
λabs, nm | ||||
|---|---|---|---|---|---|---|
| Toluene | THF | Chloroform | DCM | DMSO | Solid film | |
| a Recorded in 10−5 M solution.b ε is extinction coefficient (L mol−1 cm−1) (in parentheses). | ||||||
| 1 | 362 (4.37) | 358 (4.32) | 365 (4.43) | 363 (4.40) | 361 (4.38) | 368 |
| 2 | 300 (4.66), 335 (4.50), 462 (4.44) | 297 (4.61), 337 (4.49), 457 (4.44) | 301 (4.72), 338 (4.60), 470 (4.51) | 299 (4.69), 337 (4.55), 464 (4.46) | 299 (4.70), 336 (4.58), 465 (4.44) | 304, 341, 476 |
| 3 | 329 (4.53), 449 (4.40) | 333 (4.49), 447 (4.39) | 330 (4.65), 458 (4.49) | 327 (4.56), 453 (4.41) | 328 (4.60), 452 (4.43) | 334, 462 |
| 4 | 284 (4.64), 329 (4.56), 465 (4.42) | 281 (4.68), 331 (4.58), 462 (4.40) | 325 (4.58), 476 (4.39) | 282 (4.70), 329 (4.57), 467 (4.42) | 280 (4.66), 331 (4.57), 464 (4.36) | 290, 340, 479 |
| 5 | 296 (4.49), 398 (4.73), 450 (4.70) | 294 (4.42), 399 (4.79), 440 (4.70) | 299 (4.50), 451(4.82) | 297 (4.50), 446 (4.82) | 298 (4.50), 440 (4.83) | 300, 464 |
| 6 | 313 (4.58), 461 (4.68) | 312 (4.51), 458 (4.68) | 317 (4.69), 472 (4.79) | 312 (4.64), 460 (4.73) | 311 (4.64), 462 (4.72) | 304, 475 |
| 7 | 291 (4.80), 314 (4.60), 423 (4.37) | 291 (4.81), 337 (4.44), 420 (4.33) | 291 (4.82), 320 (4.66), 430 (4.41) | 291 (4.85), 313 (4.65), 423 (4.41) | 292 (4.88), 320 (4.65), 412 (4.34) | 294, 322, 437 |
| 8 | 333 (4.57), 467 (3.53) | 333 (4.54), 466 (3.49) | 335 (4.65), 472 (3.65) | 332 (4.60), 464 (3.52) | 332 (4.66), 469 (3.56) | 333, 485 |
| 9 | 314 (4.43), 417 (4.17) | 312 (4.38), 416 (4.14) | 313 (4.57), 424 (4.32) | 313 (4.48), 419 (4.23) | 315 (4.47), 416 (4.12) | 317, 428 |
| 10 | 305 (4.42), 426 (4.31) | 358 (4.44), 420 (4.23) | 305 (4.47), 428 (4.37) | 306 (4.44), 428 (4.33) | 308 (4.50), 433 (4.36) | 304, 440 |
| Dye | λemia nm, (Eoptg eV)b | Stoke's shiftc, cm−1 (% ϕF)d | ||||||||
|---|---|---|---|---|---|---|---|---|---|---|
| Toluene | THF | Chloroform | DCM | DMSO | Toluene | THF | Chloroform | DCM | DMSO | |
a Recorded in 10−5 M solution.b Optical band gap estimated using offset wavelength derived from the low energy absorption band  .c Stoke's shift calculated according to the equation Δν = (1/λabs − 1/λem) × 107 (cm−1)d Percentage quantum yield (in parentheses) with reference to quinine sulfate (ϕF = 0.54 in 0.5 M H2SO4). NA: quenched emission, Bold: emission property (wavelength, Stoke's shift and quantum yield) of dyes having very low intensity. .c Stoke's shift calculated according to the equation Δν = (1/λabs − 1/λem) × 107 (cm−1)d Percentage quantum yield (in parentheses) with reference to quinine sulfate (ϕF = 0.54 in 0.5 M H2SO4). NA: quenched emission, Bold: emission property (wavelength, Stoke's shift and quantum yield) of dyes having very low intensity. |
||||||||||
| 2 | 520 (2.41) | 530 (2.40) | 550 (2.33) | 552 (2.32) | 558 (2.31) | 2414 (12.73%) | 2906 (11.30%) | 2959 (6.36%) | 3435 (3.64%) | 3584 (0.14%) |
| 3 | 515 (2.46) | 526 (2.44) | 546 (2.38) | 547 (2.37) | 553 (2.37) | 2854 (9.09%) | 3177 (11.11%) | 3519 (4.72%) | 3793 (2.36%) | 4040 (0.19%) |
| 4 | 570 (2.30) | 585 (2.26) | NA (2.19) | NA (2.24) | NA (2.24) | 3961 (0.71%) | 4551 (0.11%) | NA | NA | NA |
| 5 | 503 (2.52) | 526 (2.52) | 529 (2.49) | 531 (2.49) | NA (2.49) | 2390 (16.36%) | 3496 (0.55%) | 3517 (0.14%) | 3792 (0.04%) | NA |
| 6 | NA (2.38) | 507 (2.38) | 537 (2.35) | NA (2.34) | NA (2.31) | NA | 2226 (0.06%) | 2654 (0.16%) | NA | NA |
| 7 | 486 (2.60) | 519 (2.55) | 530 (2.52) | 538 (2.52) | 555 (2.51) | 3064 (18.18%) | 4094 (13.33%) | 4387 (9.09%) | 5053 (5.45%) | 6253 (0.34%) |
| 8 | NA (2.14) | NA (2.13) | NA (2.10) | NA (2.10) | NA (2.07) | NA | NA | NA | NA | NA |
| 9 | NA (2.64) | NA (2.48) | NA (2.45) | NA (2.44) | NA (2.42) | NA | NA | NA | NA | NA |
| 10 | 508 (2.52) | 534 (2.52) | 540 (2.45) | 542 (2.45) | 543 (2.44) | 3955 (13.63%) | 4429 (6.85%) | 4845 (5.45%) | 4914 (4.91%) | 4678 (0.46%) |
Absorption property of dyes in solvent and solid state
UV-visible absorption spectra of molecule 1 in various solvent show absorption at 358–365 nm (log![[thin space (1/6-em)]](https://www.rsc.org/images/entities/char_2009.gif) εmax = 4.32–4.43 M−1 cm−1) corresponding to n–π* and π–π* transitions originating from the π–conjugated pyrido[2,3-b]pyrazine skeleton (Fig. S1† and Table 1). Such transitions in dyes 2–10 were observed around 280–399 nm (log
εmax = 4.32–4.43 M−1 cm−1) corresponding to n–π* and π–π* transitions originating from the π–conjugated pyrido[2,3-b]pyrazine skeleton (Fig. S1† and Table 1). Such transitions in dyes 2–10 were observed around 280–399 nm (log![[thin space (1/6-em)]](https://www.rsc.org/images/entities/char_2009.gif) εmax = 4.38–4.88 M−1 cm−1). While additional transitions around 412–476 nm (log
εmax = 4.38–4.88 M−1 cm−1). While additional transitions around 412–476 nm (log![[thin space (1/6-em)]](https://www.rsc.org/images/entities/char_2009.gif) εmax = 3.49–4.83 M−1 cm−1) represent intra-molecular charge transfer (ICT) (Table 1). ICT establishes the D–A architecture in dyes 2–10, originating from electron donor peripheral amines to the acceptor pyrido[2,3-b]pyrazine backbone (Fig. 2(a) and S4†).
εmax = 3.49–4.83 M−1 cm−1) represent intra-molecular charge transfer (ICT) (Table 1). ICT establishes the D–A architecture in dyes 2–10, originating from electron donor peripheral amines to the acceptor pyrido[2,3-b]pyrazine backbone (Fig. 2(a) and S4†).
Further, the ICT absorption wavelength of dyes 2–10 is sensitive towards the solvent polarity and the relative strength of the coupled donor amines, assisting tuning of ICT wavelength (Table 1). The marginal red shift of 5–6 nm and hypochromically shifted ICT maxima in dye 4 is the result of improved donating capacity due to the presence of a strong electron-donating methoxy (–OCH3) group on diphenylamine, compared to 2 (Table 1, Fig. 2(a) and ESI Fig. S4†). Intense ICT transitions of 5 and 6 were ascribed to the electron-withdrawing nature of nitro (–NO2) and phenyldiazene (–N![[double bond, length as m-dash]](https://www.rsc.org/images/entities/char_e001.gif) N–Ph) segments on diphenylamine, enabling charge-transfer contributions towards 5 and 6 from diphenylamine.7b Further, negative inductive (−I) and resonating (−R/−M) nature of the –NO2 group in 5 decreases the electron density at the tertiary nitrogen atom of the amine by withdrawing the electron towards itself and leads to blue-shifted (17–20 nm) ICT maxima compared to 2 (Table 1, Fig. 2(a) and ESI Fig. S4†).7b
N–Ph) segments on diphenylamine, enabling charge-transfer contributions towards 5 and 6 from diphenylamine.7b Further, negative inductive (−I) and resonating (−R/−M) nature of the –NO2 group in 5 decreases the electron density at the tertiary nitrogen atom of the amine by withdrawing the electron towards itself and leads to blue-shifted (17–20 nm) ICT maxima compared to 2 (Table 1, Fig. 2(a) and ESI Fig. S4†).7b
Weak donating strength of carbazole (CBZ) in dye 7 by its rigid/locked conformation leads to blue shift in ICT maxima (λICT = 412–430 nm) compared to 2 (λICT = 457–470 nm) (Table 1, Fig. 2(a) and ESI Fig. S4†).8d,12 The oxygen and sulphur heteroatoms in rigid phenoxazine and phenothiazine offer the good electron-donating ability, leading to broader and stronger ICT as expected in dyes 8 and 9 in comparison to 7 (Fig. 2(a) and ESI Fig. S4†).3e,6b,7b,8d,13 Observed behavior indicates a greater extent of separation in HOMO–LUMO spatial distributions compared to other dyes, which is evaluated by the theoretical data (ESI Fig. S54 (below), S55 (above)†).3e,6b,7b,8d,13 Weak donor strength of aliphatic cyclic amine (morpholine) in 10 leads to blue-shifted ICT band compared to 2 (Fig. 2(a) and ESI Fig. S4†). While slightly broader and red-shifted solid film absorption maxima were found it suggested molecular aggregation in the solid-state (Table 1 and Fig. 2(b)).14
Emission property of dyes in the solvent state
Photoexcitation of molecule 1 (at absorption λmax) shows an unstructured emission (ESI Fig. S2 and S3†), while dyes 2–10 (on respective ICT λmax) display emission between blue to yellow (λ = 486–585 nm) in the solution state (Table 2, Fig. 3, ESI Fig. S5†). The absence of vibrionic structure in emission spectra of 2–10 recommends emission from relaxed ICT state.15 Analogous to absorption, the emission wavelength was also tuned by the modification of the amine segment in 2–10 (Table 2, Fig. 3, ESI Fig. S5†). Molecule 4 having strong donating –OCH3 or polar substituent show weak emission with bathochromic shift in nonpolar toluene and moderately polar THF solvent, compared to 2. While, due to the enhancement in the electron density on the tertiary nitrogen atom of diphenylamine by the electron-donating/polar –OCH3 group in 4, it restricts the rotation of the phenyl group in polar media. Hence, its emission in highly polar CHL, DCM and DMSO solvents was found almost quenched due to polar–polar solute–solvent interactions.15,16In the case of 5, strong CT character and –I/−R/−M nature of the –NO2 group on the donor amine contributes hypo and hypsochromically-shifted emission compared to 2 in nonpolar toluene and afterwards emission intensity goes on decreasing on increasing the polarity of the solvent from THF to DMSO.
The high sensitivity of this molecule (5) to solvent polarity is due to reverse charge shift from the amino group in the excited state to the –NO2 substituent leading to an enhancement in excited state dipole moment, which interacts with the polar solvent molecules and reduces the energy of the excited state hence shows weak emission in polar solvents (Table 2, Fig. 3 and ESI Fig. S5†).15 Moreover, molecule 6 shows faint emission in THF, CHL and quenched emission in rest other solvents, which could be due to cis–trans photoisomerization of azobenzene chromophores.17
Locked conformation of CBZ in 7 effects weak donating strength and a lesser degree of rotational freedom in solution state compared to diphenylamine in 2, as a result, emission band was found blue shifted (3–34 nm) (Table 2, Fig. 3, ESI Fig. S5†).8d,12,18 Further observed quenched emission in dyes 8 and 9 having phenoxazine and phenothiazine units were explained by (i) the photo-induced electron transfer (PET) process, which leads to the formation of collision complexes or exciplexes in the D–A assembly or (ii) inefficient electron delocalization of the heteroatoms in order to retain aromaticity of two benzo-fused rings of phenoxazine and phenothiazine units respectively.19 Weak donating strength of aliphatic cyclic amine (morpholine) induces 12–15 nm blue-shifted emission maxima in 10 compared to 2 (Table 2 and Fig. 3, ESI Fig. S5†).
Stoke's shift of dyes is found high as 2226–6253 cm−1 (Table 2), suggesting a change in the ground and excited state geometry and no reabsorption of the emitted photons, which is desirable for their application in optoelectronics. The optical band gap (Eoptg) of dyes were found in the range of 2.07–2.64 eV (Table 2). The quantum yield of compounds 2–10 (calculated using quinine sulfate (ϕF = 0.54 in 0.5 M H2SO4) as reference material) was found in the range of 0.04–18.18% in the solution state (Table 2). The variation in ϕF of dyes in different solvents depends on the change in the non-radiative decay rates or conformational change in the fluorophore as the excitation coefficient and radiative decay rates are independent of solvent polarity.15 The obtained high ϕF in nonpolar solvents than in highly polar DMSO solvent could be due to stabilization of ICT state causing an increase in the non-radiative decay rate in the higher-polarity solvents.15 Further observed low quantum efficiency could be due to an increase in non-radiative decay rate by the rotation of the amino group in dyes, which provides a rapid deactivation pathway to the ground state.15
Solvatochromic effect
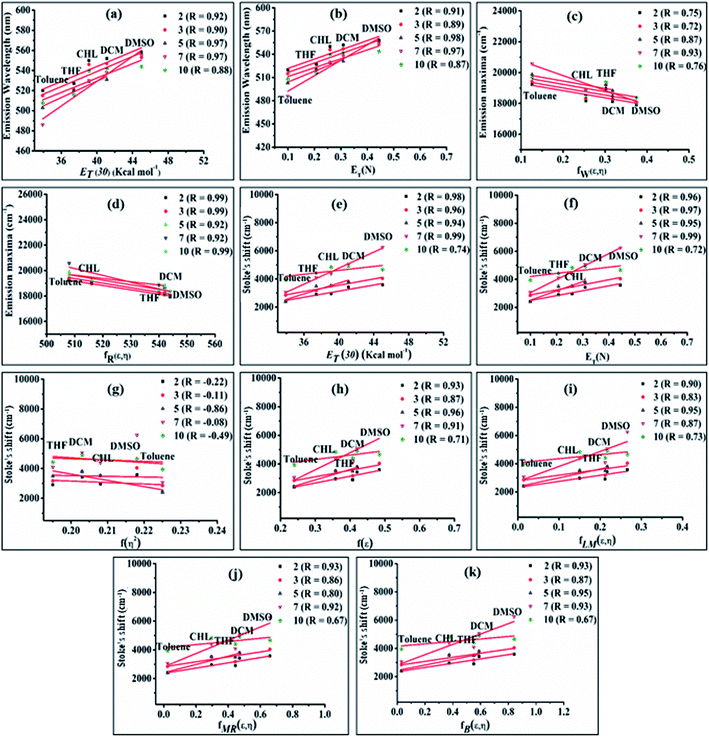
The emission properties of dyes 2, 3, 5, 7 and 10 are found to be sensitive toward the polarity of the solvent (Table 2 and Fig. 4). The solvatochromic effect on these dyes was assessed using the Reichardt polarity parameters ET (30) and Reichardt–Dimroth ENT,20 Weller's ,21 Rettig's
  ,22 Lorentz–Lorenz
  , Kirkwood–Bauer–Magat
  , Lippert–Mataga (fLM(ε,η) = f(ε) − f(η2))23 McRae
  24 and Bakshiev's
  25 function plots (Fig. 5).
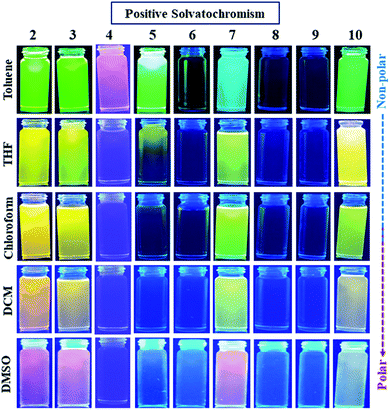 | ||
| Fig. 4 Emission images of 2–10 showing a positive solvatochromic effect in varying polarity of solvents under UV (365 nm) lamp. | ||
The bathochromic shift or good linear correlation of emission wavelength of dyes with increasing value of ET (30) and ENT function of solvents suggests the existence of a positive solvatochromic effect in the dyes (Fig. 5(a and b)).15,20 Herein, polar solvent solvate the excited state of charge transfer by stabilizing enhanced dipole moment of the excited state than the ground state and subsequently show red-shifted emission and decreases emission intensity with a reduction in the energy gap.15,20
A further possibility of occurrence of the TICT state in polar media and dependency of absorption and emission maxima on solvent polarity during charge transfer are accessed by a good linear correlation of emission wavelength of dyes with Weller and Rettig's functions (Fig. 5(c and d)).21,22
Additionally, Stoke's shift of these dyes was found to vary linearly with the ENT and ET (30) gives evidence of the occurrence of positive solvatochromism (Fig. 5(e and f)).15,20 The independence of solvents refractive index (η) in the determination of the ground and excited-state properties of the molecules are demonstrated by nonlinear solvent polarizability plots, i.e. plot of Stoke's shift of dyes vs. f(η2) of various solvents (Fig. 5(g)). Besides prominence of solvent dielectric polarizability on the ground and excited-state photophysical properties of molecules are revealed by a good linear correlation in the plot of Stoke's shift vs. f(ε) or the solvent polarity plot (Fig. 5(h)).15
Additionally, the obtained good linear correlation in the Lippert–Mataga plot, i.e. the plot of Stoke's shift vs. fLM(ε,η) marked the presence of general solvent effect and the presence of positive solvatochromic behaviour with charge transfer characteristics in these dyes (Fig. 5(i)).15,23 In addition, positive solvatochromism and CT characteristics were also established by the linearity of Stoke's shifts with improved Lippert–Mataga functions, i.e. McRae (fMR(ε,η)) and Bakhshiev (fB (ε,η)) functions (Fig. 5(j and k)).15,24,25
Emission property of dyes in the solid-state
As solid/aggregate state emission is desirable for practical application of D–A molecules. Herein dyes 2–10 (except 6), emit at λmax = 531–624 nm and cover green to red emission range in solid-state (Fig. 6). Dyes 2 (553 nm), 3 (551 nm), 5 (548 nm), and 7 (531 nm) shows good solid-state emission, while 4 (601 nm), 8 (624 nm), 9 (607 nm) and 10 (550 nm) are weakly emissive (Fig. 6). Whereas photoisomerization of azobenzene chromophore present in dyes 6 make it nonemissive in solid-state (Fig. 6).17,26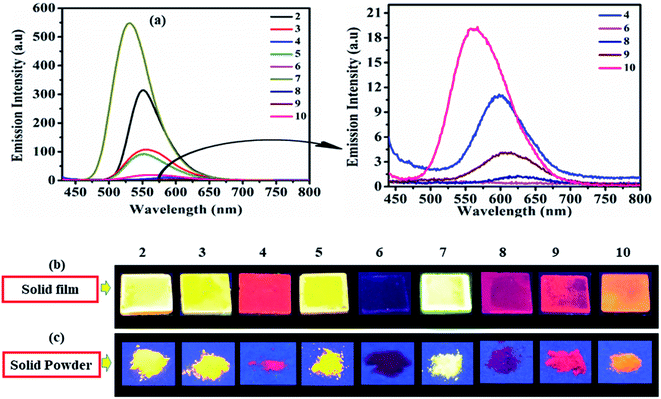 | ||
| Fig. 6 Emission spectra of 2–10 (left) and of weak/non-emissive molecules (right) in solid film (a), emission images in solid film (b) and solid powder (c) of 2–10 under UV (365 nm) lamp. | ||
Optimized geometries and ground state geometrical parameters (dihedral angle) of dyes suggest all aromatic rings rotate to some degree between each other and hence attain non-planar/twisted spatial conformation at their lowest energy states (ESI Tables S11–S20, Fig. S41–S50†). However twisting patterns in molecules 2–10 vary in accordance with their variation in the dihedral angle between D and A units (ESI Tables S11–S20 and Fig. S41–S50†). Non-planar conformation of dyes prevents close packing and π–π interactions, resulting in more or less emission in the solid-state (Fig. 6).18,27
As literature manifests, solid-state emission is one of the main criteria for the existence of AIE properties.2 Consequently, it is assumed that the good solid-state emissions of D–A–D pairs 2, 3, 5 and 7 may exhibit AIE properties. Thus, to evaluate and understand the aggregation-based emission enhancement/quenching phenomenon, we studied the AIE characteristics of dyes, as depicted in the following section.
Aggregation-induced emission
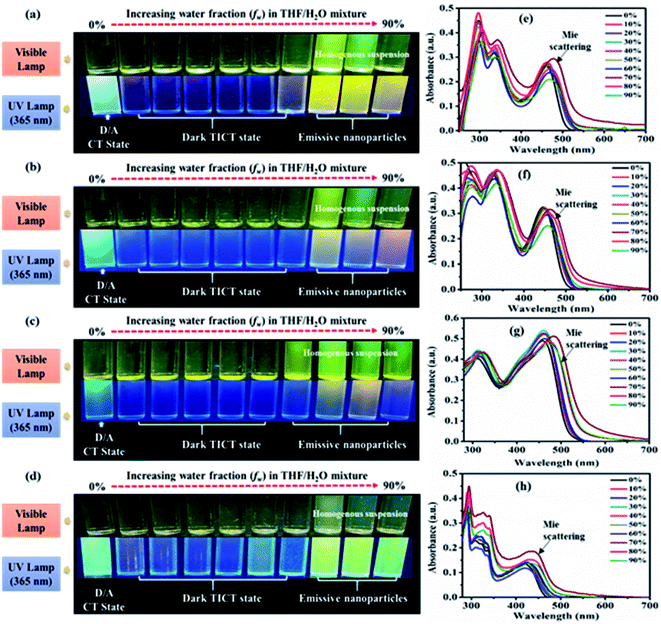
AIE characteristics of the dyes were analyzed by using a series of 10−5 M THF/water mixtures with varying (0–90) percentages of water fraction (fw). Preliminary observation of changes in a series of THF/water mixture of dyes was done under visible and 365 nm UV illumination (Fig. 7(a–d), ESI Fig. S18†).In the visible light, all dyes show formation aggregated homogenous suspension (except 10) at high fw due to the immiscibility of dyes in water. Homogeneous suspensions are with no precipitate of aggregates hence called nanoparticles (Fig. 7(a–d), ESI Fig. S18†).2c In addition under 365 nm UV illumination dyes 2, 3, 4, 5 and 7 exhibit increased emission at aggregated or high fw solution than the previously quenched isolated (less fw) media designated possibility of AIE phenomenon (Fig. 7(a–d), ESI Fig. S18(a)†). While in the case of 6, 8, 9 and 10 quenched emissions in an aggregate state marked AIE inactivity or ACQ effect of dyes (ESI Fig. S18(b–e)†). Furthermore, aggregation-based effects in the dyes 2–10 were evaluated using UV-Vis (Fig. 7(e and f), ESI Fig. S6†) and fluorescence spectroscopy (Fig. 8(a–d), ESI Fig. S7†).
UV-visible spectra of all the dyes at low fw in THF/water mixtures reveal an identical CT λmax with decreasing absorbance (Fig. 7(e and f), ESI Fig. S6†). While at high fw (∼60%/70%) showed an increase in the absorption intensity with extended wavelength or level-off tail characteristics in the visible spectral region (Fig. 7(e and f), ESI Fig. S6†). Such level-off tails are called “Mie-scattering” which are often associated with the formation of nanoparticles due to the hydrophobic environment created inside a mixture.2,28 Also increased absorbance at high fw specifies better conjugation in the nanoparticles as compared to their counterparts of isolated species.2
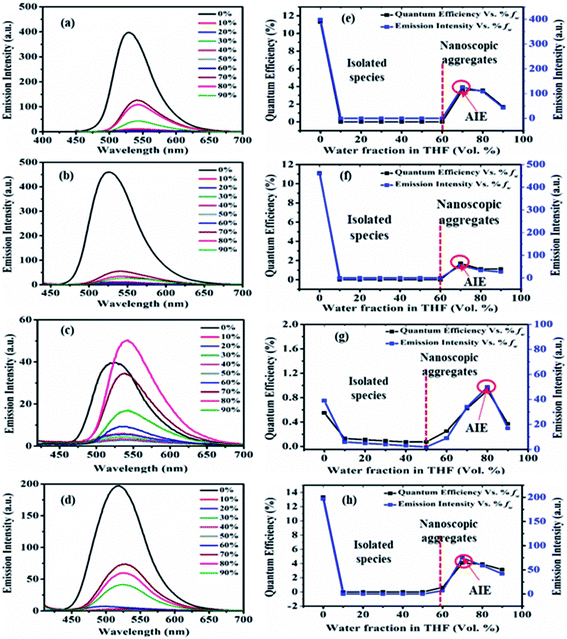
The emission in pure THF media of the dyes 2, 3, 5 and 7 are a result of CT transition (Fig. 8). The gradual addition of water (10–60%) into THF solutions of 2, 3 and 7, results in adversely quenched emission (Fig. 8(a, b, d, e, f and h)). This could be ascribed by: (i) the solvatochromic effect due to increased polarity inside the mixture (ii) conformation changes and the conversion of CT to TICT state, usually associated with non-radiative quenching process leading to ‘dark state’.2a–c,15 Further addition of high fw (70%) creates a hydrophobic environment due to insolubility of dyes in water leading to the formation of emissive nanoparticles inside the THF/H2O mixture (Fig. 8(a, b, d, e, f and h)). The formation of nanoparticles at 70% fw considerably restricts the intramolecular rotation (RIR), which limits the ICT effect, blocks the non-radiative channel and boosts up the emission intensity in an aqueous mixture.2,15 Hence entitles AIE effect in dyes 2, 3 and 7.
Also, nearly matching solid film emission wavelength with the aggregate emission formed at 70% fw depicts the formation of emissive nanoparticles at higher water fw and AIE activity.2,15 However, the extent of AIE activity in 3 is comparatively weaker than in 2 and 7. Moreover, at 80% and 90% fw decrease in emission could be due to different physical constraints of the molecules, changes in morphological structure, random molecular packing, and the variable size of particles formed in the aggregate state.2a–c,15
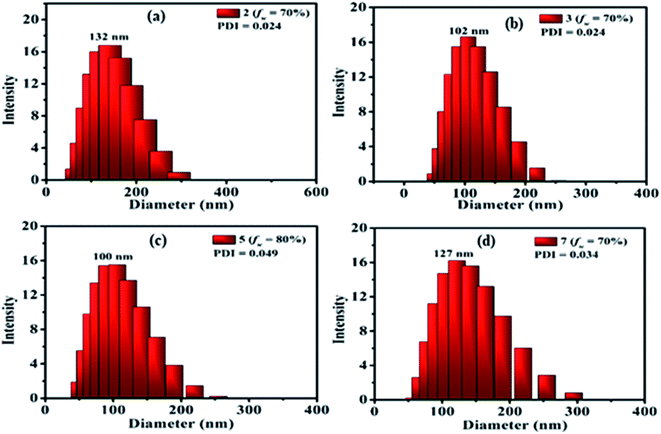
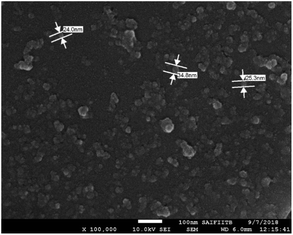
The presence of nanoparticles and their hydrodynamic average size in THF/H2O homogeneous suspensions of dyes were confirmed by the dynamic light scattering (DLS) data (Fig. 9, ESI Fig. S9–S17†). The low polydispersity indices (PDI) (except 10) obtained from DLS also confirmed the homogeneity of the homogeneous suspensions (Fig. 9, ESI Fig. S9–S17†). The hydrodynamic average size of nanoparticles formed in 70–90% fw of the THF/H2O mixture of the dyes 2 (132, 327, 328 nm), 3 (102, 165, 290 nm) and 7 (127, 156, 266 nm), suggested size-dependent emission behavior upon aggregation (Fig. 9(a, b and d), ESI Fig. S9, S10, S14†). Also, the FEG-SEM image of nanoparticles formed in 70% fw of THF–H2O mixture of 7 shows a circular morphology, with a mean diameter of about 24–35 nm (Fig. 10).
In the case of dye 5, emissions get quenched with the addition of water from 10% to 50% fw. Afterward, gradual enhancement in the emission with the addition of 60% to 80% fw could be due to the hydrogen bond-assisted AIE effect in dye 5 (Fig. 8(c and g)).2a–c,15 H-bonds between water molecules and –NO2 group effectively stiffen the conformation of dye and contribute to the RIM processes leading to AIE activity.2a–c,15 Similarly dye 4 also shows slight emission enhancement at 70–90% fw compared to quenched emission at 10–60% fw. However, the strength of emission was quite weak, designating a very feeble AIE effect (ESI Fig. S7(a), S8(a)†). Besides, similar to dyes 2, 3 and 7; a variation in the emission intensity with the size of nanoparticles formed in aggregated media of 4 (70–90% fw are 131, 464, 662 nm) (ESI Fig. S11†) and 5 (60–90% fw are 694, 164, 100, 204 nm) (Fig. 9(c) and ESI Fig. S12†) was observed. While dye 10 shows a subsequent decrease in emission with the gradual addition of water suggesting the ACQ phenomenon (ESI Fig. S7(e) and S8(b)†). Also observed higher PDI value at high fw in THF solvent of 10, attribute a very broad or multiple particle size distribution due to fast agglomeration of molecules in that media and hence evident the ACQ effect (Fig. S17†).3d,29
Furthermore, the quantum efficiency in 2, 3 and 7 decreases from 10% to 60% fw, after that, a rise in ϕF at 70% fw designates the AIE effect (Fig. 8(e, f and h)). Similarly, the case of 4 (ESI Fig. S8(a)†) and 5 (Fig. 8(g)) shows a rise in quantum efficiency from 70–90% fw and 60–90% fw, compared to the values at low fw suggesting the AIE effect. But the obtained very low ϕF at high fw of dyes 4 and 5 compared to 2, 3 and 7 further demonstrate a very weak AIE effect. While molecule 10 shows a decrease in ϕF at high water fraction proposing the ACQ phenomenon (ESI Fig. S8(b)†).
In the case of dye 6 nonemissive nature at the aggregate state and AIE inactivity could be due to the inability of the molecule to restrain photoisomerization of the azo (–N![[double bond, length as m-dash]](https://www.rsc.org/images/entities/char_e001.gif) N–) core at the aggregate state.17,26 While AIE inactivity in molecules 8 and 9 could be justified by the covalent locking of donor phenyl ring by oxygen and sulphur, respectively. Here, the RIR process does not work in the aggregate state as its donor phenyl ring rotations are already locked by the “O/S” bridges, and hence its emission at high fw is not enhanced and AIE inactivity for these dyes are observed.2a,7b,30 While the formation of nanoparticles in a homogenous suspension (at high fw) is evident by the presence of Mie-scattering in absorption spectra (ESI Fig. S6 (b–d)†) as well as from the hydrodynamic average size obtained from DLS data (SI Fig. S13, S15, S16†). The hydrodynamic average size of nanoparticles formed in 70–90% fw of the THF/H2O mixture for the dye 6 are 200, 206, 402 nm; for 8 are 128, 140, 215, 336 nm and for 9 are 135, 130, 218, 377 nm (ESI Fig. S13, S15, S16†). Thus, tuning of donor amines alters the aggregation-based AIE property in dyes 2–10.
N–) core at the aggregate state.17,26 While AIE inactivity in molecules 8 and 9 could be justified by the covalent locking of donor phenyl ring by oxygen and sulphur, respectively. Here, the RIR process does not work in the aggregate state as its donor phenyl ring rotations are already locked by the “O/S” bridges, and hence its emission at high fw is not enhanced and AIE inactivity for these dyes are observed.2a,7b,30 While the formation of nanoparticles in a homogenous suspension (at high fw) is evident by the presence of Mie-scattering in absorption spectra (ESI Fig. S6 (b–d)†) as well as from the hydrodynamic average size obtained from DLS data (SI Fig. S13, S15, S16†). The hydrodynamic average size of nanoparticles formed in 70–90% fw of the THF/H2O mixture for the dye 6 are 200, 206, 402 nm; for 8 are 128, 140, 215, 336 nm and for 9 are 135, 130, 218, 377 nm (ESI Fig. S13, S15, S16†). Thus, tuning of donor amines alters the aggregation-based AIE property in dyes 2–10.
Electrochemical properties
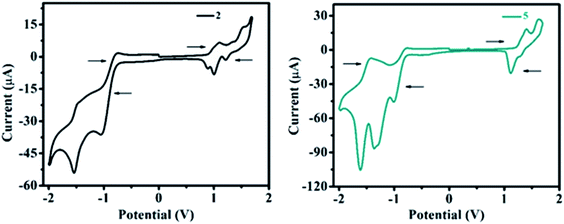
The redox behavior and associated HOMO and LUMO energy levels of 1–10 were studied using cyclic voltammetry (CV). Redox behavior of 2 and 5 are shown in Fig. 11 (for other ESI Fig. 19†) and the relevant electrochemical data are presented in Table 3. Cyclic voltammogram of 1 shows no oxidation peak (ESI Fig. S19†), however, the C–N linkage in 2–10 induces oxidation potential and established strong D–A interaction. As a result, on the anodic sweep, three/two quasi-reversible waves in the range of 0.79–1.62 V are observed for 2–10 (Fig. 11, ESI Fig. 19 and Table 3†). This is attributed to the oxidation of diarylamine/heterocyclic amines coupled with pyrido[2,3-b]pyrazine moiety.| Dye | Epeakoxia | Epeakredb | HOMOc | LUMOd | EECge |
|---|---|---|---|---|---|
| a Epeakoxi oxidation peak potential (V).b Epeakred reduction peak potential (V).c HOMO energy level calculated from EHOMO = − [Epeakoxi − Eredox (Fc/Fc+) + 5.1] eV.d LUMO energy level calculated from ELUMO = −[Epeakred − Eredox (Fc/Fc+) + 5.1] eV.e EECgcalculated from EECg = [HOMO − LUMO] eV.f HOMO energy of 1 calculated from HOMO (eV) = −(Eoptg − LUMO) eV (HOMO = −[3.01 − (−3.66)] eV = −6.67 eV). | |||||
| 1 | — | −1.02, −1.33 | −6.67f | −3.66 | 3.01 |
| 2 | 1.10, 1.33, 1.52 | −1.05, −1.53 | −5.63 | −3.66 | 1.97 |
| 3 | 1.15, 1.52 | −1.05, −1.52 | −5.72 | −3.65 | 2.07 |
| 4 | 0.79, 1.01, 1.49 | −1.05, −1.65 | −5.34 | −3.67 | 1.67 |
| 5 | 1.30, 1.40, 1.62 | −1.00, −1.36, −1.61 | −5.87 | −3.70 | 2.17 |
| 6 | 1.14, 1.62 | −1.06, −1.45, −1.72 | −5.72 | −3.63 | 2.09 |
| 7 | 1.41, 1.62 | −1.10, −1.34 | −5.97 | −3.61 | 2.36 |
| 8 | 0.82, 0.98, 1.58 | −1.04, −1.32 | −5.41 | −3.65 | 1.76 |
| 9 | 0.79, 0.95, 1.51 | −1.03, −1.73 | −5.35 | −3.66 | 1.69 |
| 10 | 1.03, 1.37, 1.58 | −1.02, −1.63 | −5.62 | −3.67 | 1.95 |
Further, the oxidation potential was found strongly dependent on the donation tendency of the donor group, consequently, the oxidation potentials of 2–10 decrease with increasing donor strength as 4 ≈ 9 > 8 > 10 > 2 > 6 > 3 > 5 > 7 (Table 3). Lower oxidation peak potentials witnessed for molecules 4, 8, 9 (Table 3) are attributed to the presence of the electron-rich –OCH3 group on the diarylamine moiety in 4 and propensity of phenoxazine (in 8) and phenothiazine (in 9) to exhibit larger charge separation with the pyrido-pyrazine acceptor segment (ESI Fig. S54 (below), S55 (above)†) by the formation of stable radical cations and anions, leading to a strong donating effect with lower oxidation potentials as explained by the PET process.19 However, rigid (cyclic) CBZ substituent on 7 leads to higher oxidation potential than other derivatives (Table 3), which signifies weak donating strength of CBZ amine.
On the other hand, two quasi-reversible waves were observed for 1–10 on the cathodic sweep (Fig. 11 and ESI Fig. S19†) corresponding to the reduction of pyrido[2,3-b]pyrazine segment. The extra reduction potential observed for 5 and 6 may be due to the reduction of the electron-withdrawing –NO2 group (in 5) and –N![[double bond, length as m-dash]](https://www.rsc.org/images/entities/char_e001.gif) N– group (in 6) (Table 3).
N– group (in 6) (Table 3).
In order to monitor interfacial charge transport kinetics of materials in optoelectronic devices, the highest occupied and lowest unoccupied molecular orbitals (HOMO and LUMO) of 2–10 were calculated from the first oxidation and reduction potentials obtained in a cyclic voltammogram. Calculated HOMO (−5.34 to −5.97 eV) and LUMO (−3.61 to −3.70 eV) energy levels (Table 3) of 2–10 were found comparable with the reported ambipolar materials.31 Ambipolar propensity of 2–10 with low band gap (1.67 eV to 2.36 eV) signify the injection of both holes and electron transporting characteristics within a molecule. Further, the HOMO–LUMO energy value and corresponding band gap were found to be altered in accordance with their substituted donor group (Table 3). As a result, compound 4 exhibits a lower band gap (1.67 eV) than other derivatives indicating the influence of a strong electron-donating group (–OCH3) on a diarylamine moiety (Table 3). Whereas, the CBZ substituted derivative 7 shows a higher band gap (2.36 eV) than other molecules due to the weak electron-donating nature of rigid carbazole (Table 3). Thus, lower band gap and balanced dual charge transport properties of 2–10 make them promising ambipolar materials for organic electronics.
Thermal properties
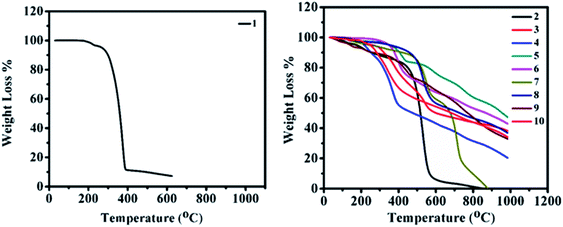
In order to improve the device performance, good thermal stability and high decomposition temperatures (above 80 °C) are required.32 The thermogravimetric analysis (TGA) of 2–10 was carried out at the temperature range of 30–1000 °C with a constant heating rate of 10 °C min−1 under inert (nitrogen) gas conditions and a melting point of 2–10 were determined by the open capillary method. Thermograms of 2–10 are displayed in Fig. 12 (right), revealing the high thermal stability of materials with no weight loss at low temperatures. Correspondingly, for 2–10, weight losses between 5% and 10% were found in the range of 140–350 °C and 250–460 °C, respectively. The order of thermal stability of 2–10 is 8 (350 (460)) > 5 (350 (405)) > 6 (350 (378)) > 3 (260 (320)) > 10 (250 (285)) > 7 (240 (440)) > 4 (220 (250)) > 2 (180 (260)) > 9 (140 (260)) (paranthesis: 5(10)% decomposition temperature). Thus, high thermal stabilities and decomposition temperatures of 2–10 reveal prospective usage in organic electronics.Theoretical investigation
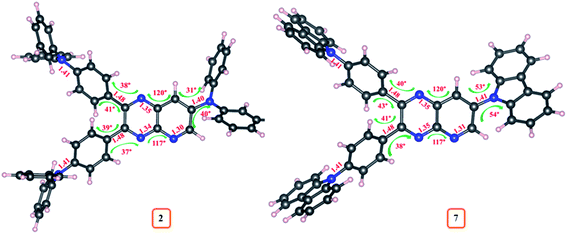
The density functional theory (DFT) and time-dependent DFT (TDDFT) simulations of 1–10 were performed in order to investigate the relationship between geometrical structure and optoelectronic properties of the dyes. The ground state (S0) and excited state (S1 and T1) geometries of these emitters were optimized with Gaussian 03 software at the B3LYP/6-311++g** level and detailed parameters (the dihedral/bond angle and bond length) are listed in ESI Table S11–S20.† The estimated bond lengths for S0, S1 and T1 geometries of dyes 2–10 were found lower compared to molecule 1, suggesting push–pull interaction (ESI Tables S11–S20†) (Fig. 13).While changing the donor in 2–10, a slight variation in bond lengths was observed (ESI Tables S12–S20†). Moreover, the dihedral angle between D and A (pyrido[2,3-b]pyrazine) from S0 geometries of 2–10 were found in the range of 30°–80° and the bond angle in between pyrido[2,3-b]pyrazine acceptor was ∼120° suggesting twisted molecular conformation of dyes (ESI Tables S12–S20†). Further significantly altered dihedral angle with different donor moieties is evident, recommending a difference in twisting pattern between D–A structure of 2–10. The comparative variation in S0 geometrical parameters of dyes 2 and 7 is marked on its optimized structure and shown in Fig. 14. Besides, compared to S0 geometries of 2–10, the structures at S1 and T1 experienced significant changes as referred by larger Δ(S1–S0)/Δ(T1–S0) dihedral angles (ESI Tables S12–S20†).
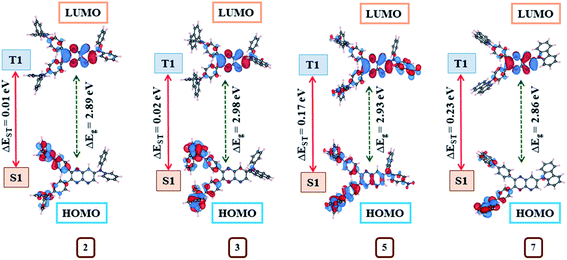
Further, the exploration of molecular orbitals (HOMO and LUMO) distribution are important factors towards computing ΔEST and designing effective TADF materials.3 Consequently, molecular orbitals distribution on the optimized structures at S0, S1 and T1 state (Fig. 14, ESI Fig S51–S55†) and the singlet (ES1), triplet (ET1) energies with corresponding ΔEST (Table 4) for 1–10 were evaluated by the B3LYP/6–311++g** basis set. The positive and negative wave function distribution on HOMO/LUMO orbitals is represented by red and blue colours, respectively. At S0, the state molecule 1 shows HOMO fully residing all over the moiety and LUMO on pyrido[2,3-b]pyrazine acceptor and partial on phenyl ring leading to larger ΔEST = 0.48 eV (Table 4) due to maximum HOMO–LUMO orbitals overlap (ESI Fig. S51†). While in the case of dyes 2–10, large dihedral angles between the various donor and pyrido[2,3-b]pyrazine planes causes separated HOMO and LUMO electron cloud distributions (ESI Fig S51–S55†) which contributes to achieving a reduced ΔEST (0.01–0.23 eV) value compared to 1 (Table 4).
| Dye | λmax (nm) | Ea (eV) | Ip (eV) | EHOMO (eV) | ELUMO (eV) | Eg (eV) | μg (Debye) | ES1 (eV) | ET1 (eV) | ΔEST (eV) | ||||
|---|---|---|---|---|---|---|---|---|---|---|---|---|---|---|
| Toluene | THF | CHL | DCM | DMSO | ||||||||||
| 1 | 388.9 | 394.0 | 392.4 | 394.5 | 396.7 | 1.64 | 7.91 | −6.70 | −3.00 | 3.70 | 1.52 | 23.93 | 23.45 | 0.48 |
| 2 | 517.2 | 534.0 | 528.8 | 535.6 | 542.9 | 1.15 | 6.03 | −5.16 | −2.27 | 2.89 | 2.65 | 6.67 | 6.66 | 0.01 |
| 3 | 503.0 | 519.9 | 514.5 | 521.5 | 529.1 | 1.13 | 6.01 | −5.17 | −2.19 | 2.98 | 2.16 | 7.94 | 7.92 | 0.02 |
| 4 | 544.7 | 568.0 | 560.6 | 570.3 | 580.8 | 0.84 | 5.64 | −4.81 | −2.02 | 2.79 | 3.53 | 8.64 | 8.53 | 0.11 |
| 5 | 505.8 | 523.8 | 517.9 | 525.7 | 534.5 | 2.16 | 6.81 | −5.98 | −3.05 | 2.93 | 6.28 | 8.50 | 8.33 | 0.17 |
| 6 | 541.3 | 555.3 | 551.0 | 556.7 | 562.8 | 1.90 | 6.09 | −5.35 | −2.63 | 2.72 | 3.11 | 9.56 | 9.44 | 0.12 |
| 7 | 497.2 | 496.1 | 496.6 | 495.9 | 494.9 | 1.68 | 6.59 | −5.74 | −2.88 | 2.86 | 1.84 | 6.88 | 6.65 | 0.23 |
| 8 | 700.7 | 686.4 | 691.4 | 684.8 | 676.9 | 1.83 | 6.05 | −5.14 | −3.05 | 2.09 | 1.58 | 7.28 | 7.27 | 0.01 |
| 9 | 597.2 | 590.8 | 593.1 | 589.9 | 585.9 | 1.81 | 6.24 | −5.34 | −3.02 | 2.32 | 2.64 | 7.59 | 7.57 | 0.02 |
| 10 | 457.9 | 473.6 | 468.6 | 475.1 | 482.3 | 0.88 | 6.49 | −5.40 | −2.15 | 3.25 | 2.05 | 4.85 | 4.78 | 0.07 |
HOMO in 2, 3, 8 and 9 are mainly localized on its donor diphenylamine (4, 4′ position), naphthylphenylamine (4, 4′ position), phenoxazine (4′ position), phenothiazine (4′ position) respectively and slightly extended to phenyl bridge (ESI Fig. S51, S52, S54 and S55†). While their LUMO is confined on pyrido[2,3-b]pyrazine acceptor and partial on the phenyl bridge (ESI Fig. S51, S52, S54 and S55†). The observed less overlapping between HOMO and LUMO wave function for these dyes is consistent with the principle that the ΔEST value of a molecule decreases as the overlap diminishes.3 Consequently, very less ΔEST values (0.01, 0.02, 0.01, 0.02 eV) were estimated for these dyes (Table 4).
In the case of 4, HOMO resides on the 4, 4′ position of the donor extended to the phenyl bridge and pyrido[2,3-b]pyrazine planes as well as partially on the 7th position of the donor. Besides LUMO is mainly confined to pyrido[2,3-b]pyrazine acceptor and partial on phenyl ring (ESI Fig. S52†). Subsequently, dye 4 shows slightly greater overlapping and larger ΔEST (0.11 eV) (Table 4). Similarly, observed higher HOMO/LUMO orbital overlap is the cause of larger ΔEST in 5 (0.17 eV) 6 (0.12 eV) and 7 (0.23 eV) (Table 4, ESI Fig. S53 and S54†). Also, the computed ΔEST value for dye 7 (0.23 eV) and 8 (0.01 eV) are comparable to reported experimental values (0.39 and 0.09 eV, respectively).8d Further the electron cloud on HOMO in dye 10 is confined on donor morpholine (4, 4′ position), extending to the phenyl bridge and pyrido[2,3-b]pyrazine planes while its LUMO is again on acceptor and partial on phenyl ring (ESI Fig. S55†). As a result, it shows moderate overlapping compared to other dyes and as expected from the orbital distributions, ΔEST was found at 0.07 eV (Table 4).
In addition, no direct overlap between the highest occupied and lowest unoccupied natural transition orbitals at S1 and T1 state designate dominant excited state CT property (Fig. 14, ESI Fig S51–S55†) and lower ΔEST values (0.01–0.23 eV) (Table 4) in 2–10.3 Further, CT absorption and other transitions of 2–10, were evaluated by simulated absorption spectra in various solvents and gas phases using the TDDFT method (Fig. 15, ESI Fig. S40(b–e)†).
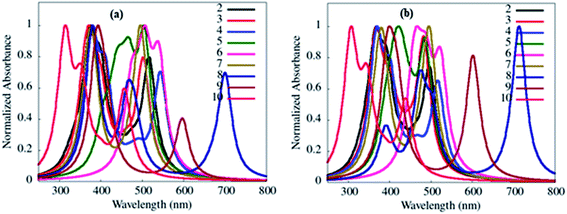 | ||
| Fig. 15 Simulated absorption transition spectra of 2–10 in toluene (a) and gas phase (b) obtained from the B3LYP/6-311++g** basis set. | ||
The absorption wavelengths, oscillator strength (f) and the vertical electronic transitions of 1–10 in gas and in various solvents are given in ESI Tables S1–S10.† As desired, among various types of transition possesses by dyes 2–10, the long-wavelength (λmax) transitions originated from HOMO → LUMO or HOMO −2 → LUMO transitions (ESI Tables S2–S10†), and it is often referred to as the CT transition.33 This CT transition is clear evidence for the presence of D–A architecture in 2–10.33
Further, simulated absorption spectra of 2–10 (Fig. 15(a), ESI Fig. S40(b–e), Tables S2–S10†) on increasing the polarity of solvent (toluene to DMSO) also show variation in the absorption λmax (Table 4) analogous to experimental data (Table 1, Fig. 2, ESI Fig. S4†), suggesting dipole moment changes in the electronic ground-state by the solvent.15 While self-interaction error in TDDFT arising from the electron transfer in CT state are the causes of red-shifted theoretical absorption transitions than the experimental one.34
The computed HOMO and LUMO energy values for 2–10 are −4.81 to −5.98 eV and −2.02 to −3.05 eV, respectively (Table 4). In the dyes 2–10, C–N coupling between donor amines and acceptor helps to suppress HOMO–LUMO gaps (Eg) (2.09 to 3.25 eV) compared to 1 (3.70 eV) (Table 4). Moreover computed low band gap in 2–10 (Table 4) indicate good hole and electron transporting nature. While observed deviation in experimental and theoretical HOMO–LUMO energies and band gap most likely designate self-interaction error in the orbital energies from the ground-state DFT calculation and or the role of solvent interaction with the molecules.34
Besides, IP and EA values shown in Table 4 were estimated by the differences in the total energies of the neutral and cationic/anionic species, respectively. The lowest IP and EA values estimated for 4 in comparison to other compounds reveals strong donating capability due to the presence of –OCH3 group present on the diphenylamine donor segment (Table 4). While higher IP and EA values were obtained for molecule 5 than those for other dyes indicating strong accepting capability due to the presence of the –NO2 group present on the diphenylamine donor segment (Table 4). Small ground state dipole moment exhibited by all dye (except 5) implies that the dipole vectors cancel one another out due to their opposite directions. The large dipole moment obtained for 5 (6.28) (Table 4) was due to the presence of the polar –NO2 substituent on diphenylamine. The Cartesian coordinates of optimized structures, Mulliken and Lowdin charges of 1–10 are given in ESI Tables S21–S30.†
Conclusion
D–A–D structured pyrido[2,3-b]pyrazine amines (2–10) were synthesized by the Buchwald–Hartwig amination reaction and investigated for the effect of peripheral amines on their opto-electrochemical and theoretical properties. C–N coupling in dyes offers significant charge transfer (ICT) property and established D–A building in 2–10. Dyes emit blue–red emissions in solution and solid-state due to the excited CT state. The emission property of dyes was found sensitive towards solvent media used and shows positive solvatochromism. Dyes 2, 3, 4, 5 and 7 possess AIE characteristics and hence could be used as solid-state emissive materials in organic electronics. Dyes 2–10 show the formation of nanoparticles at high fw in the THF/H2O mixture as confirmed from DLS and FEG-SEM. In addition, the C–N linkage in dyes controls the oxidation potential, which leads to a reduction in HOMO–LUMO energy band gaps (1.67 to 2.36 eV) and the energy values are comparable with reported ambipolar materials. The thermal stabilities of dyes are found good. Further, the DFT/TDDFT method helps to understand: (i) the extent of push–pull (D–A) interaction in the dyes (ii) degree of twisting on the basis of the dihedral angle between all the aromatic rings in the dyes (iii) tuning of the optoelectrochemical properties was based on the relative strength of donor (iv) correlation of distribution of electron cloud depended on HOMO and LUMO orbital and ΔEST. Computed small ΔEST revealed possible TADF characteristics of dyes. Thus, experimental and theoretical results indicate that these molecules have the potential to be used in various optoelectronic applications.Experimental section
Chemicals and materials
Sigma Aldrich and Alfa Aesar were the commercial sources of all materials and reagents used. HPLC and spectroscopic grade organic solvents were dried using standard procedures and handled in a moisture-free atmosphere. SD fine silica gel (60–120 mesh) with eluent n-hexane and chloroform were used for the column chromatography experiment. The progress of reactions and purity of the compounds were checked using thin-layer chromatography (TLC) on silica gel coated glass plates, visualized using UV light (365 nm) and an iodine chamber.Instrumentation and methods
UV-visible spectra of all compounds were recorded in 10−5 mol L−1 solutions in a 1 cm path length quartz cuvette and a solid film on a SHIMADZU UV-2401PC at room temperature. The solid films of 2–10 were prepared on quartz glass plate substrate using a spin coater (Holmarc HO-TH-05) at 1000 rpm for 2 min with approximately 6 mg mL−1 of sample in chloroform solvent. The emission spectra were measured using a SHIMADZU RF-5301PC fluorescence spectrophotometer. The fluorescence quantum yields of dyes 2–10 were calculated using quinine sulfate (ϕf = 0.54 in 0.5 M H2SO4). AIE study was conducted using 10−5 mol L−1 THF/H2O solutions with different percentages of water fractions using a similar UV-visible and fluorescence spectrophotometer. Hydrodynamic particle sizes were obtained from DLS analysis using a Zetasizer (7.12)-MAL1180779. The exact nanoparticles size and morphology of dye 7 were determined by FEG-SEM analysis using the JSM-7600F instrument. Cyclic voltammetry (CV) studies were carried out on a computer-controlled PalmSens3 potentiostat or galvanostat instrument. The CV measurement was carried out with a scan rate of 100 mV s−1 at room temperature in anhydrous dichloromethane (DCM) solution using tetrabutylammonium hexafluorophosphate (TBHP) (0.1 M) as a supporting electrolyte. The cell assembly was set up with a three-electrode system as non–aqueous Ag/AgCl (reference) electrode, platinum (Pt) wire (counter electrode) and carbon glassy (working) electrode. The potential of the Ag/AgCl reference electrode was calibrated using the ferrocene/ferrocenium redox couple with the known oxidation potential of +5.1 eV. The thermogravimetric analysis (TGA) was performed using a Metler Toledo instrument (TG) under nitrogen atmosphere. 1H and 13C NMR spectra were recorded using CDCl3 on a Varian UltraShield spectrometer with tetramethylsilane (TMS) as an internal reference at a working frequency of 400 MHz and 100 MHz, respectively. Fourier transform infrared (FT-IR) spectra were recorded using solid powder samples on a PerkinElmer Frontier 91579. Mass spectrometric measurements were recorded using MALDI-TOF (Bruker) and elemental analysis was performed on an EA Euro-elemental analysis instrument. Melting points were recorded in silicon oil bath using the ANALAB melting point apparatus.Synthetic procedures
Light yellow solid, eluent n-hexane![[thin space (1/6-em)]](https://www.rsc.org/images/entities/char_2009.gif) :
:![[thin space (1/6-em)]](https://www.rsc.org/images/entities/char_2009.gif) chloroform: 40
chloroform: 40![[thin space (1/6-em)]](https://www.rsc.org/images/entities/char_2009.gif) :
:![[thin space (1/6-em)]](https://www.rsc.org/images/entities/char_2009.gif) 60, yield: 2.00 g (93%), m. p.: 190 °C, FT-IR (solid, νmax/cm−1): 3030, 2922 (Ar.
60, yield: 2.00 g (93%), m. p.: 190 °C, FT-IR (solid, νmax/cm−1): 3030, 2922 (Ar. ![[double bond, length as m-dash]](https://www.rsc.org/images/entities/char_e001.gif) C–H str), 1585, 1486 (Ar. –C
C–H str), 1585, 1486 (Ar. –C![[double bond, length as m-dash]](https://www.rsc.org/images/entities/char_e001.gif) C str), 1325 (C–N str), 1062 (Ar. –C–H bend), 817 (C–Br); 1H NMR (400 MHz, CDCl3): δ (ppm) = 9.17 (s, 1H, ArH), 8.65 (d, 1H, ArH, J = 2.4 Hz), 7.55–7.41 (m, 8H, ArH), 7.26 (s, 1H, ArH (1H due to residual CHCl3 in CDCl3)). MALDI-TOF: mass calcd for C19H10Br3N3 [M+]: 520.01, found: 519.60; elemental anal. calcd for C19H10Br3N3: C 43.88, H 1.94, N 8.08%, found: C 43.84, H 2.02, N 8.00%.
C str), 1325 (C–N str), 1062 (Ar. –C–H bend), 817 (C–Br); 1H NMR (400 MHz, CDCl3): δ (ppm) = 9.17 (s, 1H, ArH), 8.65 (d, 1H, ArH, J = 2.4 Hz), 7.55–7.41 (m, 8H, ArH), 7.26 (s, 1H, ArH (1H due to residual CHCl3 in CDCl3)). MALDI-TOF: mass calcd for C19H10Br3N3 [M+]: 520.01, found: 519.60; elemental anal. calcd for C19H10Br3N3: C 43.88, H 1.94, N 8.08%, found: C 43.84, H 2.02, N 8.00%.
General synthetic procedure for 2–10
A mixture of compound 1 (0.2 g, 0.385 mmol) and various diarylamine/heterocyclic amines (1.3 mmol) were dissolved in anhydrous toluene (30 mL) with catalyst Pd2(dba)3 (20 mg, 0.02 mmol), reagent SPhos (20 mg, 0.04 mmol) and base t-BuONa (150 mg, 1.50 mmol). The reaction mixture was heated at 110 °C under the nitrogen atmosphere for 5–12 hours with continuous stirring. The progress of the reaction mixture was continuously monitored through the TLC method. Afterwards, the mixture was cooled to room temperature and extracted with chloroform (3 × 50 mL) followed by water washing (3 × 50 mL). All the organic layers were combined and dried over anhydrous Na2SO4 and evaporated to afford the crude product, which was further purified by silica gel column chromatography (eluent![[thin space (1/6-em)]](https://www.rsc.org/images/entities/char_2009.gif) :
:![[thin space (1/6-em)]](https://www.rsc.org/images/entities/char_2009.gif) n-hexane
n-hexane![[thin space (1/6-em)]](https://www.rsc.org/images/entities/char_2009.gif) :
:![[thin space (1/6-em)]](https://www.rsc.org/images/entities/char_2009.gif) chloroform) to obtain yellow-red solids.
chloroform) to obtain yellow-red solids.
![[thin space (1/6-em)]](https://www.rsc.org/images/entities/char_2009.gif) :
:![[thin space (1/6-em)]](https://www.rsc.org/images/entities/char_2009.gif) chloroform: 30
chloroform: 30![[thin space (1/6-em)]](https://www.rsc.org/images/entities/char_2009.gif) :
:![[thin space (1/6-em)]](https://www.rsc.org/images/entities/char_2009.gif) 70, yield: 140 mg (46.66%), m. p.: 145 °C. FT-IR (solid, νmax/cm−1): 3034 (Ar.
70, yield: 140 mg (46.66%), m. p.: 145 °C. FT-IR (solid, νmax/cm−1): 3034 (Ar. ![[double bond, length as m-dash]](https://www.rsc.org/images/entities/char_e001.gif) C–H str), 1585, 1486 (Ar. –C
C–H str), 1585, 1486 (Ar. –C![[double bond, length as m-dash]](https://www.rsc.org/images/entities/char_e001.gif) C str), 1332 (C–N str), 1266, 1165, 1066, 692 (Ar. –C–H bend); 1H NMR (400 MHz, CDCl3): δ (ppm) = 8.92 (s, 1H, ArH), 7.88 (s, 1H, ArH), 7.56–6.99 (m, 39H, ArH) (1H extra due to residual CHCl3 in CDCl3); 13C NMR (100 MHz, CDCl3): δ (ppm) = 154.988, 149.324, 147.737, 147.018, 139.090, 131.386, 130.720, 130.236, 129.794, 125.729, 125.273, 123.662, 122.280, 122.071, 121.414; MALDI-TOF: mass calcd for C55H40N6 [M+]: 784.95, found: 785.23; elemental anal. calcd for C55H40N6: C 84.16, H 5.14, N 10.71%, found: C 84.23, H 5.10, N 10.65%.
C str), 1332 (C–N str), 1266, 1165, 1066, 692 (Ar. –C–H bend); 1H NMR (400 MHz, CDCl3): δ (ppm) = 8.92 (s, 1H, ArH), 7.88 (s, 1H, ArH), 7.56–6.99 (m, 39H, ArH) (1H extra due to residual CHCl3 in CDCl3); 13C NMR (100 MHz, CDCl3): δ (ppm) = 154.988, 149.324, 147.737, 147.018, 139.090, 131.386, 130.720, 130.236, 129.794, 125.729, 125.273, 123.662, 122.280, 122.071, 121.414; MALDI-TOF: mass calcd for C55H40N6 [M+]: 784.95, found: 785.23; elemental anal. calcd for C55H40N6: C 84.16, H 5.14, N 10.71%, found: C 84.23, H 5.10, N 10.65%.![[thin space (1/6-em)]](https://www.rsc.org/images/entities/char_2009.gif) :
:![[thin space (1/6-em)]](https://www.rsc.org/images/entities/char_2009.gif) chloroform: 50
chloroform: 50![[thin space (1/6-em)]](https://www.rsc.org/images/entities/char_2009.gif) :
:![[thin space (1/6-em)]](https://www.rsc.org/images/entities/char_2009.gif) 50, yield: 164 mg (45.68%), m. p.: 155 °C. FT-IR (solid, νmax/cm−1): 3037 (Ar.
50, yield: 164 mg (45.68%), m. p.: 155 °C. FT-IR (solid, νmax/cm−1): 3037 (Ar. ![[double bond, length as m-dash]](https://www.rsc.org/images/entities/char_e001.gif) C–H str.), 1587, 1493 (Ar. –C
C–H str.), 1587, 1493 (Ar. –C![[double bond, length as m-dash]](https://www.rsc.org/images/entities/char_e001.gif) C str), 1357 (C–N str), 1264, 1175, 1072, 772, 694 (Ar. –C–H bend); 1H NMR (400 MHz, CDCl3): δ (ppm) = 9.18 (s, 1H, ArH), 8.99 (s, 1H, ArH), 8.69 (s, 1H, ArH), 7.98–7.80 (m, 29H, ArH), 7.57–7.46 (m, 10H, ArH), 6.85–6.81 (m, 4H, ArH); 13C NMR (100 MHz, CDCl3): δ (ppm) = 156.368, 155.194, 152.548, 149.483, 143.036, 140.873, 134.207, 131.785, 131.567, 129.419, 127.265, 126.794, 124.149, 119.631, 116.512, 116.291, 116.024, 108.866; MALDI-TOF: mass calcd for C67H46N6 [M+]: 935.12, found: 934.74; elemental anal. calcd for C67H46N6: C 86.05, H 4.96, N 8.99%, found: C 85.99, H 5.05, N 8.93%.
C str), 1357 (C–N str), 1264, 1175, 1072, 772, 694 (Ar. –C–H bend); 1H NMR (400 MHz, CDCl3): δ (ppm) = 9.18 (s, 1H, ArH), 8.99 (s, 1H, ArH), 8.69 (s, 1H, ArH), 7.98–7.80 (m, 29H, ArH), 7.57–7.46 (m, 10H, ArH), 6.85–6.81 (m, 4H, ArH); 13C NMR (100 MHz, CDCl3): δ (ppm) = 156.368, 155.194, 152.548, 149.483, 143.036, 140.873, 134.207, 131.785, 131.567, 129.419, 127.265, 126.794, 124.149, 119.631, 116.512, 116.291, 116.024, 108.866; MALDI-TOF: mass calcd for C67H46N6 [M+]: 935.12, found: 934.74; elemental anal. calcd for C67H46N6: C 86.05, H 4.96, N 8.99%, found: C 85.99, H 5.05, N 8.93%.![[thin space (1/6-em)]](https://www.rsc.org/images/entities/char_2009.gif) :
:![[thin space (1/6-em)]](https://www.rsc.org/images/entities/char_2009.gif) chloroform: 20
chloroform: 20![[thin space (1/6-em)]](https://www.rsc.org/images/entities/char_2009.gif) :
:![[thin space (1/6-em)]](https://www.rsc.org/images/entities/char_2009.gif) 80, yield: 154 mg (41.09%), m. p.: 140 °C. FT-IR (solid, νmax/cm−1): 3057 (Ar.
80, yield: 154 mg (41.09%), m. p.: 140 °C. FT-IR (solid, νmax/cm−1): 3057 (Ar. ![[double bond, length as m-dash]](https://www.rsc.org/images/entities/char_e001.gif) C–H str), 2920 (Aliph. –C–H str), 1587, 1505, 1440 (Ar. –C
C–H str), 2920 (Aliph. –C–H str), 1587, 1505, 1440 (Ar. –C![[double bond, length as m-dash]](https://www.rsc.org/images/entities/char_e001.gif) C str), 1348 (C–N str), 1242, 1010, 827 (Ar. –C–H bend); 1H NMR (400 MHz, CDCl3): δ (ppm) = 8.86 (s, 1H, ArH), 8.74 (s, 2H, ArH), 7.57–6.86 (m, 32H, ArH) (1H extra due to residual CHCl3 in CDCl3), 3.86 (s, 18H, ArH, –OCH3); 13C NMR (100 MHz, CDCl3): δ (ppm) = 158.722, 150.717, 143.914, 139.908, 139.202, 132.358, 131.896, 129.554, 127.898, 125.998, 117.513, 116.546, 115.177, 114.697, 55.828; MALDI-TOF: mass calcd for C61H52N6O6 [M+]: 965.10, found: 965.09; elemental anal. calcd for C61H52N6O6: C 75.91, H 5.43, N 8.71%, found: C 75.83, H 5.50, N 8.74%.
C str), 1348 (C–N str), 1242, 1010, 827 (Ar. –C–H bend); 1H NMR (400 MHz, CDCl3): δ (ppm) = 8.86 (s, 1H, ArH), 8.74 (s, 2H, ArH), 7.57–6.86 (m, 32H, ArH) (1H extra due to residual CHCl3 in CDCl3), 3.86 (s, 18H, ArH, –OCH3); 13C NMR (100 MHz, CDCl3): δ (ppm) = 158.722, 150.717, 143.914, 139.908, 139.202, 132.358, 131.896, 129.554, 127.898, 125.998, 117.513, 116.546, 115.177, 114.697, 55.828; MALDI-TOF: mass calcd for C61H52N6O6 [M+]: 965.10, found: 965.09; elemental anal. calcd for C61H52N6O6: C 75.91, H 5.43, N 8.71%, found: C 75.83, H 5.50, N 8.74%.![[thin space (1/6-em)]](https://www.rsc.org/images/entities/char_2009.gif) :
:![[thin space (1/6-em)]](https://www.rsc.org/images/entities/char_2009.gif) chloroform: 30
chloroform: 30![[thin space (1/6-em)]](https://www.rsc.org/images/entities/char_2009.gif) :
:![[thin space (1/6-em)]](https://www.rsc.org/images/entities/char_2009.gif) 70, yield: 232 mg (65.72%), m. p.: 212 °C. FT-IR (solid, νmax/cm−1): 3058 (Ar.
70, yield: 232 mg (65.72%), m. p.: 212 °C. FT-IR (solid, νmax/cm−1): 3058 (Ar. ![[double bond, length as m-dash]](https://www.rsc.org/images/entities/char_e001.gif) C–H str), 1581, 1488 (Ar. –C
C–H str), 1581, 1488 (Ar. –C![[double bond, length as m-dash]](https://www.rsc.org/images/entities/char_e001.gif) C str./–NO2 str), 1304 (C–N str), 1171, 1108, 836, 749, 692 (Ar. –C–H bend); 1H NMR (400 MHz, CDCl3): δ (ppm) = 9.03 (s, 1H, ArH), 8.20 (d, 2H, ArH, J = 8.8 Hz), 8.09–8.05 (m, 7H, ArH), 7.67–7.02 (m, 28H, ArH) (1H extra due to residual CHCl3 in CDCl3); 13C NMR (100 MHz, CDCl3): δ (ppm) = 153.807, 152.782, 147.737, 145.508, 143.005, 141.080, 134.067, 131.842, 131.254, 130.625, 128.065, 127.777, 126.782, 126.484, 125.845, 125.190, 121.688, 120.137; MALDI-TOF: mass calcd for C55H37N9O6 [M+]: 919.94, found: 920.17; elemental anal. calcd for C55H37N9O6: C 71.81, H 4.05, N 13.70%, Found C 71.77, H 4.12, N 13.65%.
C str./–NO2 str), 1304 (C–N str), 1171, 1108, 836, 749, 692 (Ar. –C–H bend); 1H NMR (400 MHz, CDCl3): δ (ppm) = 9.03 (s, 1H, ArH), 8.20 (d, 2H, ArH, J = 8.8 Hz), 8.09–8.05 (m, 7H, ArH), 7.67–7.02 (m, 28H, ArH) (1H extra due to residual CHCl3 in CDCl3); 13C NMR (100 MHz, CDCl3): δ (ppm) = 153.807, 152.782, 147.737, 145.508, 143.005, 141.080, 134.067, 131.842, 131.254, 130.625, 128.065, 127.777, 126.782, 126.484, 125.845, 125.190, 121.688, 120.137; MALDI-TOF: mass calcd for C55H37N9O6 [M+]: 919.94, found: 920.17; elemental anal. calcd for C55H37N9O6: C 71.81, H 4.05, N 13.70%, Found C 71.77, H 4.12, N 13.65%.![[thin space (1/6-em)]](https://www.rsc.org/images/entities/char_2009.gif) :
:![[thin space (1/6-em)]](https://www.rsc.org/images/entities/char_2009.gif) chloroform: 10
chloroform: 10![[thin space (1/6-em)]](https://www.rsc.org/images/entities/char_2009.gif) :
:![[thin space (1/6-em)]](https://www.rsc.org/images/entities/char_2009.gif) 90, yield: 192 mg (45.60%), m. p.: 151 °C. FT-IR (solid, νmax/cm−1): 3036 (Ar.
90, yield: 192 mg (45.60%), m. p.: 151 °C. FT-IR (solid, νmax/cm−1): 3036 (Ar. ![[double bond, length as m-dash]](https://www.rsc.org/images/entities/char_e001.gif) C–H str), 1586, 1489 (Ar. –C
C–H str), 1586, 1489 (Ar. –C![[double bond, length as m-dash]](https://www.rsc.org/images/entities/char_e001.gif) C str), 1334 (C–N str), 1257, 1138, 1063, 686 (Ar. −C–H bend); 1H NMR (400 MHz, CDCl3): δ (ppm) = 9.03 (s, 1H, ArH), 7.91–7.86 (m, 11H, ArH), 7.54–7.11 (m, 40H, ArH); 13C NMR (100 MHz, CDCl3): δ (ppm) = 152.723, 149.771, 149.199, 148.377, 148.214, 147.870, 146.370, 145.353, 141.992, 131.714, 131.433, 131.289, 131.088, 130.968, 130.900, 130.388, 129.734, 129.127, 129.076, 126.274, 126.217, 126.133, 126.065, 124.888, 124.716, 124.373, 124.144, 123.537, 123.158, 123.098, 122.805, 122.612; MALDI-TOF: mass calcd for C73H52N12 [M+]: 1097.27, found: 1097.31; elemental anal. calcd for C73H52N12: C 79.91, H 4.78, N 15.32%, found: C 79.82, H 4.88, N 15.27%.
C str), 1334 (C–N str), 1257, 1138, 1063, 686 (Ar. −C–H bend); 1H NMR (400 MHz, CDCl3): δ (ppm) = 9.03 (s, 1H, ArH), 7.91–7.86 (m, 11H, ArH), 7.54–7.11 (m, 40H, ArH); 13C NMR (100 MHz, CDCl3): δ (ppm) = 152.723, 149.771, 149.199, 148.377, 148.214, 147.870, 146.370, 145.353, 141.992, 131.714, 131.433, 131.289, 131.088, 130.968, 130.900, 130.388, 129.734, 129.127, 129.076, 126.274, 126.217, 126.133, 126.065, 124.888, 124.716, 124.373, 124.144, 123.537, 123.158, 123.098, 122.805, 122.612; MALDI-TOF: mass calcd for C73H52N12 [M+]: 1097.27, found: 1097.31; elemental anal. calcd for C73H52N12: C 79.91, H 4.78, N 15.32%, found: C 79.82, H 4.88, N 15.27%.![[thin space (1/6-em)]](https://www.rsc.org/images/entities/char_2009.gif) :
:![[thin space (1/6-em)]](https://www.rsc.org/images/entities/char_2009.gif) chloroform: 50
chloroform: 50![[thin space (1/6-em)]](https://www.rsc.org/images/entities/char_2009.gif) :
:![[thin space (1/6-em)]](https://www.rsc.org/images/entities/char_2009.gif) 50, yield: 188 mg (62.87%), m. p.: >300 °C. FT-IR (solid, νmax/cm−1): 3051 (Ar.
50, yield: 188 mg (62.87%), m. p.: >300 °C. FT-IR (solid, νmax/cm−1): 3051 (Ar. ![[double bond, length as m-dash]](https://www.rsc.org/images/entities/char_e001.gif) C–H str), 1593, 1448 (Ar. –C
C–H str), 1593, 1448 (Ar. –C![[double bond, length as m-dash]](https://www.rsc.org/images/entities/char_e001.gif) C str), 1326 (C–N str), 1226, 1161, 745 (Ar. –C–H bend); 1H NMR (400 MHz, CDCl3): δ (ppm) = 9.60 (s, 1H, ArH), 8.85 (s, 1H, ArH), 8.25–8.00 (m, 8H, ArH), 7.77–7.28 (m, 24H, ArH); 13C NMR (100 MHz, CDCl3): δ (ppm) = 155.798, 154.924, 153.425, 140.424, 140.112, 139.511, 137.141, 131.709, 127.115, 126.247, 124.751, 124.139, 122.030, 121.420, 120.848, 109.709; MALDI-TOF: mass calcd for C55H34N6 [M+]: 778.90, found: 779.21; elemental anal. calcd for C55H34N6: C 84.81, H 4.40, N 10.79%, Found C 84.75, H 4.34, N 10.88%.
C str), 1326 (C–N str), 1226, 1161, 745 (Ar. –C–H bend); 1H NMR (400 MHz, CDCl3): δ (ppm) = 9.60 (s, 1H, ArH), 8.85 (s, 1H, ArH), 8.25–8.00 (m, 8H, ArH), 7.77–7.28 (m, 24H, ArH); 13C NMR (100 MHz, CDCl3): δ (ppm) = 155.798, 154.924, 153.425, 140.424, 140.112, 139.511, 137.141, 131.709, 127.115, 126.247, 124.751, 124.139, 122.030, 121.420, 120.848, 109.709; MALDI-TOF: mass calcd for C55H34N6 [M+]: 778.90, found: 779.21; elemental anal. calcd for C55H34N6: C 84.81, H 4.40, N 10.79%, Found C 84.75, H 4.34, N 10.88%.![[thin space (1/6-em)]](https://www.rsc.org/images/entities/char_2009.gif) :
:![[thin space (1/6-em)]](https://www.rsc.org/images/entities/char_2009.gif) chloroform: 40
chloroform: 40![[thin space (1/6-em)]](https://www.rsc.org/images/entities/char_2009.gif) :
:![[thin space (1/6-em)]](https://www.rsc.org/images/entities/char_2009.gif) 60, yield: 244 mg (76.97%), m. p.: 202 °C. FT-IR (solid, νmax/cm−1): 3054 (Ar.
60, yield: 244 mg (76.97%), m. p.: 202 °C. FT-IR (solid, νmax/cm−1): 3054 (Ar. ![[double bond, length as m-dash]](https://www.rsc.org/images/entities/char_e001.gif) C–H str), 1591, 1482 (Ar. –C
C–H str), 1591, 1482 (Ar. –C![[double bond, length as m-dash]](https://www.rsc.org/images/entities/char_e001.gif) C str), 1334 (C–N str), 1267, 1032, 735, 620 (Ar. –C–H bend); 1H NMR (400 MHz, CDCl3): δ (ppm) = 9.26 (s, 1H, ArH), 8.70 (s, 1H, ArH), 7.91 (dd, 7H, ArH, J = 8 Hz), 6.86–6.56 (m, 25H, ArH); 13C NMR (100 MHz, CDCl3): δ (ppm) = 157.491, 156.283, 144.587, 143.970, 133.779, 132.973, 132.638, 131.190, 130.949, 123.559, 123.454, 123.414, 123.319, 123.141, 121.780, 116.420, 115.699, 113.913, 113.263, 113.136; MALDI-TOF: mass calcd for C55H34N6O3 [M+]: 826.90, found: 827.23; elemental anal. calcd for C55H34N6O3: C 79.89, H 4.14, N 10.16%, found: C 79.80, H 4.20, N 10.21%.
C str), 1334 (C–N str), 1267, 1032, 735, 620 (Ar. –C–H bend); 1H NMR (400 MHz, CDCl3): δ (ppm) = 9.26 (s, 1H, ArH), 8.70 (s, 1H, ArH), 7.91 (dd, 7H, ArH, J = 8 Hz), 6.86–6.56 (m, 25H, ArH); 13C NMR (100 MHz, CDCl3): δ (ppm) = 157.491, 156.283, 144.587, 143.970, 133.779, 132.973, 132.638, 131.190, 130.949, 123.559, 123.454, 123.414, 123.319, 123.141, 121.780, 116.420, 115.699, 113.913, 113.263, 113.136; MALDI-TOF: mass calcd for C55H34N6O3 [M+]: 826.90, found: 827.23; elemental anal. calcd for C55H34N6O3: C 79.89, H 4.14, N 10.16%, found: C 79.80, H 4.20, N 10.21%.![[thin space (1/6-em)]](https://www.rsc.org/images/entities/char_2009.gif) :
:![[thin space (1/6-em)]](https://www.rsc.org/images/entities/char_2009.gif) chloroform: 10
chloroform: 10![[thin space (1/6-em)]](https://www.rsc.org/images/entities/char_2009.gif) :
:![[thin space (1/6-em)]](https://www.rsc.org/images/entities/char_2009.gif) 90, yield: 191 mg (56.67%), m. p.: 170 °C. FT-IR (solid, νmax/cm−1): 3056 (Ar.
90, yield: 191 mg (56.67%), m. p.: 170 °C. FT-IR (solid, νmax/cm−1): 3056 (Ar. ![[double bond, length as m-dash]](https://www.rsc.org/images/entities/char_e001.gif) C–H str), 1582, 1458 (Ar. –C
C–H str), 1582, 1458 (Ar. –C![[double bond, length as m-dash]](https://www.rsc.org/images/entities/char_e001.gif) C str), 1342 (C–N str), 1231, 1168, 829, 739 (Ar. –C–H bend); 1H NMR (400 MHz, CDCl3): δ (ppm) = 9.05 (s, 1H, ArH), 8.12–8.00 (m, 1H, ArH), 7.55–7.28 (m, 33H, ArH (1H extra due to residual CHCl3 in CDCl3)); 13C NMR (100 MHz, CDCl3): δ (ppm) = 152.803, 150.086, 143.695, 140.976, 133.797, 133.695, 132.588, 132.121, 131.848, 131.457, 129.614, 127.109, 123.621, 116.184, 111.883, 109.831; MALDI-TOF: mass calcd for C55H34N6S3 [M+]: 875.09, found: 875.19; elemental anal. calcd for C55H34N6S3: C 75.49, H 3.92, N 9.60%, found: C 75.55, H 3.88, N 9.66%.
C str), 1342 (C–N str), 1231, 1168, 829, 739 (Ar. –C–H bend); 1H NMR (400 MHz, CDCl3): δ (ppm) = 9.05 (s, 1H, ArH), 8.12–8.00 (m, 1H, ArH), 7.55–7.28 (m, 33H, ArH (1H extra due to residual CHCl3 in CDCl3)); 13C NMR (100 MHz, CDCl3): δ (ppm) = 152.803, 150.086, 143.695, 140.976, 133.797, 133.695, 132.588, 132.121, 131.848, 131.457, 129.614, 127.109, 123.621, 116.184, 111.883, 109.831; MALDI-TOF: mass calcd for C55H34N6S3 [M+]: 875.09, found: 875.19; elemental anal. calcd for C55H34N6S3: C 75.49, H 3.92, N 9.60%, found: C 75.55, H 3.88, N 9.66%.![[double bond, length as m-dash]](https://www.rsc.org/images/entities/char_e001.gif) C–H str), 2848 (Aliph. –C–H str), 1595, 1447 (Ar. –C
C–H str), 2848 (Aliph. –C–H str), 1595, 1447 (Ar. –C![[double bond, length as m-dash]](https://www.rsc.org/images/entities/char_e001.gif) C str), 1372 (C–N str), 1233, 1110, 925, 825, 597 (Ar. –C–H bend); 1H NMR (400 MHz, CDCl3): δ (ppm) = 8.97 (d, 1H, ArH, J = 2.4 Hz), 7.64–7.28 (m, 9H, ArH (1H extra due to residual CHCl3 in CDCl3)), 6.61 (d, 1H, ArH, J = 8.4 Hz), 3.94 (t, 12H, ArH, J = 4.4 Hz), 3.42 (t, 4H, –CH2, J = 4.3 Hz), 3.26 (t, 8H, –CH2, J = 4.5 Hz); 13C NMR (100 MHz, CDCl3): δ (ppm) = 158.109, 150.246, 147.480, 132.899, 131.541, 130.878, 129.455, 116.750, 115.820, 103.591, 66.560, 48.280; MALDI-TOF: mass calcd for C31H34N6O3 [M+]: 538.64, found: 539.06; elemental anal. calcd for C31H34N6O3: C 69.12, H 6.36, N 15.60%, found: C 69.04, H 6.42, N 15.65%.
C str), 1372 (C–N str), 1233, 1110, 925, 825, 597 (Ar. –C–H bend); 1H NMR (400 MHz, CDCl3): δ (ppm) = 8.97 (d, 1H, ArH, J = 2.4 Hz), 7.64–7.28 (m, 9H, ArH (1H extra due to residual CHCl3 in CDCl3)), 6.61 (d, 1H, ArH, J = 8.4 Hz), 3.94 (t, 12H, ArH, J = 4.4 Hz), 3.42 (t, 4H, –CH2, J = 4.3 Hz), 3.26 (t, 8H, –CH2, J = 4.5 Hz); 13C NMR (100 MHz, CDCl3): δ (ppm) = 158.109, 150.246, 147.480, 132.899, 131.541, 130.878, 129.455, 116.750, 115.820, 103.591, 66.560, 48.280; MALDI-TOF: mass calcd for C31H34N6O3 [M+]: 538.64, found: 539.06; elemental anal. calcd for C31H34N6O3: C 69.12, H 6.36, N 15.60%, found: C 69.04, H 6.42, N 15.65%.Author contributions
Rajesh M. Kamble: conceptualization, investigation, visualization, resources, supervision, writing – review and editingDeepak M. Kapse and Pooja S. Singh: data curation, investigation, writing – original draft
Mohammed Ghadiyali and Sajeev Chacko: formal/theoretical (computational) analysis
Conflicts of interest
The authors declare no conflict of interest.Acknowledgements
The authors are greatly thankful to Micro-Analytical Laboratory, Department of Chemistry, University of Mumbai for providing Instrumental facilities, National NMR center and Department of Chemistry, IIRBS Kerala for providing NMR services, TIFR-Mumbai for MALDI-TOF and SAIF-IIT Bombay for FEG-SEM characterization.References
- (a) M. Madhu, R. Ramakrishnan, V. Vijay and M. Hariharan, Chem. Rev., 2021, 121, 8234 CrossRef CAS PubMed; (b) J. Chen, Y. Chen, L.-W. Feng, C. Gu, G. Li, N. Su, G. Wang, S. M. Swick, W. Huang, X. Guo, A. Facchetti and T. J. Marks, EnergyChem, 2020, 2, 100042 CrossRef; (c) M. Poddar, G. Sivakumar and R. Misra, J. Mater. Chem. C, 2019, 7, 14798 RSC; (d) E. Ravindran and N. Somanathan, J. Mater. Chem. C, 2017, 5, 7436 RSC.
- (a) J. Mei, Y. Hong, J. W. Y. Lam, A. Qin, Y. Tang and B. Z. Tang, Adv. Mater., 2014, 26, 5429 CrossRef CAS PubMed; (b) J. Mei, N. L. C. Leung, R. T. K. Kwok, J. W. Y. Lam and B. Z. Tang, Chem. Rev., 2015, 115, 11718 CrossRef CAS PubMed; (c) J. Luo, Z. Xie, J. W. Y. Lam, L. Cheng, H. Chen, C. Qiu, H. S. Kwok, X. Zhan, Y. Liu, D. Zhu and B. Z. Tang, Chem. Commun., 2001, 1740 RSC; (d) Y. Chen, J. W. Y. Lam, R. T. K. Kwok, B. Liu and B. Z. Tang, Mater. Horiz., 2019, 6, 428 RSC.
- (a) Z. Yang, Z. Mao, Z. Xie, Y. Zhang, S. Liu, J. Zhao, J. Xu, Z. Chi and M. P. Aldred, Chem. Soc. Rev., 2017, 46, 915 RSC; (b) T. Huang, W. Jiang and L. Duan, J. Mater. Chem. C, 2018, 6, 5577 RSC; (c) X. Yin, Y. He, X. Wang, Z. Wu, E. Pang, J. Xu and J. Wang, Front. Chem., 2020, 8, 725 CrossRef CAS PubMed; (d) P. S. Singh, P. M. Badani and R. M. Kamble, J. Photochem. Photobiol., A, 2021, 419, 113457 CrossRef CAS; (e) P. S. Singh, M. Ghadiyali, S. Chacko and R. M. Kamble, J. Lumin., 2022, 242, 118568 CrossRef CAS.
- (a) K. Zhou, H. Dong, H. L. Zhang and W. Hu, Phys. Chem. Chem. Phys., 2014, 16, 22448 RSC; (b) J. Zaumseil and H. Sirringhaus, Chem. Rev., 2007, 107, 1296 CrossRef CAS PubMed.
- (a) Y. Sakamoto, T. Suzuki, M. Kobayashi, Y. Gao, Y. Fukai, Y. Inoue, F. Sato and S. Tokito, J. Am. Chem. Soc., 2004, 126, 8138 CrossRef CAS PubMed; (b) Z. Liang, Q. Tang, J. Xu and Q. Miao, Adv. Mater., 2011, 23, 1535 CrossRef CAS PubMed.
- (a) P. Ledwon, R. Motyka, K. Ivaniuk, A. Pidluzhna, N. Martyniuk, P. Stakhira, G. Baryshnikov, B. F. Minaev and H. Agren, Dyes Pigm., 2020, 173, 108008 CrossRef CAS; (b) P. S. Singh, S. Chacko and R. M. Kamble, New J. Chem., 2019, 43, 6973 RSC; (c) D. N. Kanekar, S. Chacko and R. M. Kamble, Dyes Pigm., 2019, 167, 36–50 CrossRef CAS; (d) S. S. Mahadik, D. R. Garud, R. V. Pinjari and R. M. Kamble, J. Mol. Struct., 2022, 1248, 131541 CrossRef CAS.
- (a) D. Dong, D. Fang, H. Li, C. Zhu, X. Zhao, J. Li, L. Jin, L. Xie, L. Chen, J. Zhao, H. Zhang and W. Huang, Chem.–Asian J., 2017, 12, 920 CrossRef CAS PubMed; (b) P. S. Singh, P. M. Badani and R. M. Kamble, New J. Chem., 2019, 43, 19379 RSC.
- (a) H. Zhao, Y. Wei, J. Zhao and M. Wang, Dyes Pigm., 2009, 81, 245 CrossRef; (b) T. Huang, D. Liu, J. Jiang and W. Jiang, Chem. - Eur. J., 2019, 25, 10926 CrossRef CAS PubMed; (c) S. S. Mahadik, D. R. Garud, A. P. Ware, S. S. Pingale and R. M. Kamble, Dyes Pigm., 2021, 184, 108742 CrossRef CAS; (d) B. Sk, S. Sharma, A. James, S. Kundu and A. Patra, J. Mater. Chem. C, 2020, 8, 12943 RSC.
- (a) Z. Zheng, Q. Dong, L. Gou, J.-H. Su and J. Huang, J. Mater. Chem. C, 2014, 2, 9858 RSC; (b) D. N. Kanekar, S. Chacko and R. M. Kamble, New J. Chem., 2020, 44, 3278 RSC.
- (a) P. Agarwala and D. Kabra, J. Mater. Chem. A, 2017, 5, 1348 RSC; (b) F. Baraket, B. Pedras, E. Torres, M. J. Brites, M. Dammak and M. N. Berberan-Santos, Dyes Pigm., 2020, 175, 108114 CrossRef CAS; (c) P. Ledwon, Org. Electron., 2019, 75, 105422 CrossRef CAS.
- (a) A. S. Guran and S. L. Buchwald, J. Am. Chem. Soc., 1994, 116, 7901 CrossRef; (b) F. Paul, J. Patt and J. F. Hartwig, J. Am. Chem. Soc., 1994, 116, 5969 CrossRef CAS.
- S. Xue, W. Liu, X. Qiu, Y. Gao and W. Yang, J. Phys. Chem. C, 2014, 118, 18668 CrossRef CAS.
- S. A. Jenekhe, L. Lu and M. M. Alam, Macromolecules, 2001, 34, 7315 CrossRef CAS.
- L. Zhao, X. Ren and X. Yan, CCS Chem., 2021, 3, 678 CrossRef.
- J. R. Lakowicz, Principles of Fluorescence Spectroscopy, University of Maryland School of Medicine Baltimore, Maryland, USA, 3rd edn, 2006 Search PubMed.
- K. M. Franziska and J. J. M. Thomas, Sci. China Chem., 2018, 61, 909 CrossRef.
- L. Xue, Y. Pan, S. Zhang, Y. Chen, H. Yu, Y. Yang, L. Mo, Z. Sun, L. Li and H. Yang, Crystals, 2021, 11, 840 CrossRef CAS.
- Z. Ning, Z. Chen, Q. Zhang, Y. Yan, S. Qian, Y. Cao and H. Tian, Adv. Funct. Mater., 2007, 17, 3799 CrossRef CAS.
- (a) J. Daub, R. Engl, J. Kurzawa, S. E. Miller, S. Schneider, A. Stockmann and M. R. Wasielewski, J. Phys. Chem. A, 2001, 105, 5655 CrossRef CAS; (b) A. P. Kulkarni, P. Wu, T. W. Kwon and S. A. Jenekhe, J. Phys. Chem. B, 2005, 109, 19584 CrossRef CAS PubMed; (c) D. W. Cho, M. Fujitsuka, A. Sugimoto, U. C. Yoon, P. S. Mariano and T. Majima, J. Phys. Chem. B, 2006, 110, 11062 CrossRef CAS PubMed.
- (a) C. Reichardt, Angew. Chem., Int. Ed. Engl., 1979, 18, 98 CrossRef; (b) C. Reichardt, Chem. Rev., 1994, 94, 2319 CrossRef CAS.
- A. Weller, Angew. Phys. Chem., 1956, 60, 1144 CAS.
- W. Rettig, Angew. Chem., Int. Ed. Engl., 1986, 25, 971 CrossRef.
- E. Lippert, Z. Elektrochem., 1957, 61, 962 CAS.
- E. G. McRae, J. Phys. Chem., 1957, 61, 562 CrossRef CAS.
- N. G. Bakhshiev, Opt. Spectrosc., 1962, 13, 24 Search PubMed.
- R. P. Paitandi, R. S. Singh, B. K. Dwivedi, V. D. Singh and D. S. Pandey, Dalton Trans., 2018, 47, 3785 RSC.
- Z. J. Ning, Y. C. Zhou, Q. Zhang, D. G. Ma, J. J. Zhang and H. Tian, J. Photochem. Photobiol., A, 2007, 192, 8 CrossRef CAS.
- H. Li, Z. Chi, X. Zhang, B. Xu, S. Liu, Y. Zhang and J. Xu, Chem. Commun., 2011, 47, 11273 RSC.
- M. Danaei, M. Dehghankhold, S. Ataei, F. H. Davarani, R. Javanmard, A. Dokhani, S. Khorasani and M. R. Mozafari, Pharmaceutics, 2018, 10, 57 CrossRef PubMed.
- J. Shi, N. Chang, C. Li, J. Mei, C. Deng, X. Luo, Z. Liu, Z. Bo, Y. Q. Dong and B. Z. Tang, Chem. Commun., 2012, 48, 10675 RSC.
- (a) H. Xia, D. Liu, X. Xua and Q. Miao, Chem. Commun., 2013, 49, 4301 RSC; (b) L. Wang, X. Zhang, H. Tian, Y. Lu, Y. Geng and F. Wang, Chem. Commun., 2013, 49, 11272 RSC.
- M.-X. Yu, J.-P. Duan, C.-H. Lin, C.-H. Cheng and Y.-T. Tao, Chem. Mater., 2002, 14, 3958 CrossRef CAS.
- Y. Zhu, A. P. Kulkani, P.-T. Wu and S. A. Jenekhe, Chem. Mater., 2008, 20, 4200 CrossRef CAS.
- A. Elangovan, K.-M. Kao, S.-W. Yang, Y.-L. Chen, T.-I. Ho and Y. O. J. Su, J. Org. Chem., 2005, 70, 4460 CrossRef CAS PubMed.
- H. Kasai, H. S. Nalwa, H. Oikawa, S. Okada, H. Matsuda, N. Minami, A. Kakuta, K. Ono, A. Mukoh and H. N. H. Nakanishi, Jpn. J. Appl. Phys., 1992, 31, L1132 CrossRef CAS.
- M. J. Frisch, G. W. Trucks, H. B. Schlegel, G. E. Scuseria, M. A. Robb, J. R. Cheeseman, J. A. Montgomery Jr, T. Vreven, K. N. Kudin, J. C. Burant, J. M. Millam, S. S. Iyengar, J. Tomasi, V. Barone, B. Mennucci, M. Cossi, G. Scalmani, N. Rega, G. A. Petersson, H. Nakatsuji, M. Hada, M. Ehara, K. Toyota, R. Fukuda, J. Hasegawa, M. Ishida, T. Nakajima, Y. Honda, O. Kitao, H. Nakai, M. Klene, X. Li, J. E. Knox, H. P. Hratchian, J. B. Cross, V. Bakken, C. Adamo, J. Jaramillo, R. Gomperts, R. E. Stratmann, O. Yazyev, A. J. Austin, R. Cammi, C. Pomelli, J. W. Ochterski, P. Y. Ayala, K. Morokuma, G. A. Voth, P. Salvador, J. J. Dannenberg, V. G. Zakrzewski, S. Dapprich, A. D. Daniels, M. C. Strain, O. Farkas, D. K. Malick, A. D. Rabuck, K. Raghavachari, J. B. Foresman, J. V. Ortiz, Q. Cui, A. G. Baboul, S. Clifford, J. Cioslowski, B. B. Stefanov, G. Liu, A. Liashenko, P. Piskorz, I. Komaromi, R. L. Martin, D. J. Fox, T. Keith, M. A. Al-Laham, C. Y. Peng, A. Nanayakkara, M. Challacombe, P. M. W. Gill, B. Johnson, W. Chen, M. W. Wong, C. Gonzalez, and J. A. Pople. Gaussian 03, Revision C.02. Gaussian, 2 Inc., Wallingford, CT, 2004 Search PubMed.
- K. Ks and K. D. Jordan, J. Phys. Chem., 1994, 98, 10089 CrossRef.
- P. J. Stephens, F. J. Devlin, C. F. Chabalowski, M. J. Frisch and A. b. initio, J. Phys. Chem., 1994, 98, 11623 CrossRef CAS.
- H. Ilona, H. Peter and P. Andras, J. Comput. Chem., 2004, 25, 1522 CrossRef PubMed.
- M. Koichi and I. Fujio, J. Appl. Crystallogr., 2008, 41, 653 CrossRef.
- R. S. Mulliken, J. Chem. Phys., 1955, 23, 1833 CrossRef CAS.
- P.-O. Lowdin, J. Chem. Phys., 1953, 21, 374 CrossRef CAS.
Footnote |
| † Electronic supplementary information (ESI) available: 1H, 13C, FT-IR and MALDI-TOF spectra of 1–10; UV-visible absorption and emission spectra of 1 and 2–10 in other solvents, AIE spectrum and DLS plot; cyclic voltammogram, DFT/TDDFT calculation data along with molecular orbital diagram, optimized structure and computed geometrical parameters at S0, S1 and T1 state are available. See DOI: 10.1039/d2ra00128d |
| This journal is © The Royal Society of Chemistry 2022 |

