 Open Access Article
Effect of artemisinin sustained-release algaecide on the growth of Microcystis aeruginosa and the underlying physiological mechanisms
Wenlu Sanga,
Cunhao Dua,
Xiaguo Liub,
Lixiao Ni *a,
Shiyin Lic,
Jiawei Xud,
Xuqing Chene,
Jian Xue and
Chu Xua
aKey Laboratory of Integrated Regulation and Resource Development on Shallow Lakes, MOE, School of Environment, Hohai University, Nanjing 210098, China. E-mail: nilixiao@hhu.edu.cn
bJiangsu Environmental Protection Group Suzhou Co., Ltd, Suzhou 215000, China
cSchool of Environment, Nanjing Normal University, Nanjing 210097, China
dCollege of Water Conservancy and Hydropower Engineering, Hohai University, 1 Xikang Road, Nanjing 210098, China
eCyanobacteria Management Office, Wuxi 214071, China
First published on 30th May 2022
Abstract
The aim of the study was to determine the effect of phycobiliprotein and esterase activity of Microcystis aeruginosa cells on the effect of artemisinin slow-release algaecide. We analyzed the sustained stress of artemisinin slow-release algaecide and the associated changes in density, phycobiliprotein, and esterase activity in Microcystis aeruginosa (M. aeruginosa) and monitored changes in the physical and chemical properties of the algae during the process. The results showed that the cumulative release concentration of artemisinin sustained-release algaecide in different media was similar. When the total amount of artemisinin was kept at 5.00–5.30 mg L−1, the effect of artemisinin on algal cells and the release amount of slow-release algicides reached a dynamic balance, and the equilibrium concentration could inhibit the growth of M. aeruginosa. Artemisinin slow-release algaecide slowly released artemisinin and inhibited the content of phycobiliprotein in M. aeruginosa. The esterase activity recovered after 15 days and continued to increase. Artemisinin showed no harmful effect on M. aeruginosa and increased the metabolic activity of algal cells. M. aeruginosa may undergo programmed cell death, keeping the cell membrane structure intact. The use of micro-nano materials can increase the effect of allelochemicals on Microcystis aeruginosa. The slow release of allelopathic active substances from the algae inhibitor reduces the algal density of Microcystis aeruginosa cells. However, the enhanced metabolic activity of algal cells may be due to artemisinin causing PCD in Microcystis cells, keeping the cell membrane structure intact, thereby preventing algal cell rupture and release of a large amount of algal toxins.
1. Introduction
Algal blooms are occurring globally due to climate change and an abundance of nutrients in the water, threatening the sustainability of freshwater ecosystems. If the number of cyanobacteria (particularly M. aeruginosa) increases significantly, water quality and human health will suffer significantly. Algal blooms not only produce unpleasant odors, reduce water body transparency, and reduce dissolved oxygen content, but they also release toxins and specific organic matter, resulting in biodiversity loss and ecological damage.1,2In recent years, technology for removing algae from surface water has been divided into three categories: physical technology, chemical technology, and biological technology. However, these technologies have difficult-to-control limitations and, to varying degrees, environmental risks, which limit their widespread adoption.3–5 Since the discovery of the allelopathic effects of aquatic plants on algae, the inhibition of algae growth and reproduction by allelopathic substances has piqued the public's interest, and its high efficiency and environmental friendliness have made it a research hotspot.6–8 Algal growth is inhibited by allelopathic substances extracted from various plants.9–11 However, they release allelopathic active substances slowly to sustain release and low-dose algae inhibition without posing an ecological risk. To address this issue, artemisinin was embedded in a sodium alginate/chitosan microcapsule system to create a slow-release algaecide.12,13 In this system, a polymer carrier material is physically or chemically combined with the drug, and the drug is slowly released into the water body via penetration and diffusion, imposing a continuous allelopathic effect on the algae and inhibiting their growth.14–16
Artemisinin can effectively inhibit the growth of algal cells, and it is converted into a sustained-release algaecide by microcapsule technology, which can improve the longevity of the algaecide inhibitor and hence, make it cost-effective. Previous studies only investigated the algal inhibition effect of artemisinin and some algal inhibition mechanism, but a detailed discussion on the cumulative effect of the sustained release of algal inhibitors was lacking.17 In addition, there is currently no study on the combination of nanotechnology to make the particle size smaller, more effective in contact with algae, and its effect on the physiological function of Microcystis aeruginosa. In this study, the high activity and dispersivity of micronanomaterials were used to increase the binding amount of allelochemicals to M. aeruginosa, and the allelochemicals were released slowly to achieve long-term release and low dose algal inhibition without ecological risk. Further, the changes in algal density, phycobiliprotein, and esterase activity of M. aeruginosa under the continuous stress of artemisinin sustained-release algaecide and the physicochemical changes in the algae were monitored. To determine the problems of slow-release microparticles prepared from allelochemicals, such as swelling and precipitation, low entrapment rate, and difficulty in contacting algal cells, and the continuous stress of artemisinin slow-release algicide, the density of M. aeruginosa cells decreased, but the metabolism of algal cells decreased. The enhanced activity may be due to algaecide causing programmed cell death (PCD) in M. aeruginosa, keeping the cell membrane structure intact, thereby preventing the release of a large amount of algal toxins due to cell rupture. This might provide a theoretical basis for the application of slow-release algaecide in water bodies.
2. Materials and methods
2.1. Culture of M. aeruginosa
The strains of M. aeruginosa were supplied by the Freshwater Algae Culture Collection of the Institute of Hydrobiology (FACHB-905, China) and cultured in the laboratory at Hohai University using sterilized BG-11 medium. The algae were cultivated in 250 mL flasks with 200 mL sterilized culture media at 25 °C under 40–60 μmol per photons per m2 per s (14 h light/10 h dark). The Erlenmeyer flasks were shaken three times a day to ensure that the algae mixed and grew evenly.2.2. Algaecide preparation
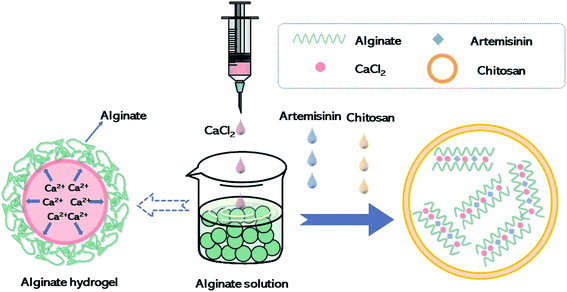
Artemisinin (purity > 99%) was purchased from Nanjing Zelang Medical Technology. Artemisinin sustained-release algaecide was prepared according to the optimal technological conditions obtained by conducting the orthogonal experiment. Fig. 1 depicts the algaecide preparation process. CaCl2 solution (6 mg L−1) was slowly dropped into sodium alginate solution (1 mg L−1) to make the pre-gel. A suitable amount of chitosan (0.6 mg L−1) was dissolved in a 1% (v/v) acetic acid aqueous solution and added dropwise to the pregel along with artemisinin, and chitosan colloid was formed spontaneously under mild conditions (low rate mixing). The algaecide was obtained after centrifuging the particles for 30 min at a speed of 12![[thin space (1/6-em)]](https://www.rsc.org/images/entities/char_2009.gif) 000 rpm.
000 rpm.
2.3. Algal inhibition experiment
The algal (M. aeruginosa) inhibition experiment was conducted according to the ISO8692-2004 standard (ISO, 8692-2004). The initial algal density was 2 × 10⁶ cells per mL. According to the previous studies of the research group, the optimal inhibition concentrations of pure artemisinin and sustained-release algaecide were determined to be 16.0 mg L−1 and 0.540 g L−1, respectively.18,19 In this experiment, a blank control group, a pure artemisinin group (16.0 mg L−1), and an artemisinin sustained-release algaecide group (0.540 g L−1) were set up. Each group was cultured in triplicate for 40 days. The content of phycobiliprotein in the algal solution was determined by the enzyme labeling method every five days, and the pH and the DO value of the algal solution were determined by a multi-parameter water quality analyzer. Additionally, five parallel groups of algaecide were set up to observe the algal inhibition effect of the residual solution. When the particles were fully swelled, the application of artemisinin sustained-release algaecide was stopped on the 5th, 10th, and 35th day of the experiment.The inhibition ratio (IR) was calculated by the following equation:
| IR = (N0 − N)/N0 × 100% | (1) |
2.4. Analysis of the concentration of the accumulated artemisinin
The algal culture conditions were the same as above. Three groups, including a distilled water group, a blank culture solution (BG-11) group, and an M. aeruginosa group (the initial algal density was 2 × 10⁶ cells per mL) were set up, and the same dose of artemisinin sustained-release algaecide (0.540 g L−1) was added to the three groups. The dose applied was the optimal inhibitory concentration obtained in the preliminary experiment. The artemisinin content in the solution was measured using an ultraviolet spectrophotometer at 292 nm every day for the first 16 days and every five days after 40 days of continuous culture. The standard curve formula for artemisinin concentration (y) and absorbance (x) was y = 17.842x + 0.0363, and the correlation coefficient R2 was 0.9996.2.5. Determination of phycobiliprotein content
The phycobiliprotein content was determined according to the method described in a study by Wu et al.20 The algal solution (30.0 mL) was centrifuged at 10![[thin space (1/6-em)]](https://www.rsc.org/images/entities/char_2009.gif) 000 rpm for 5 min, and 5.0 mL of PBS (0.05 M, pH = 7.0) was added to the concentrated algal cell after discarding the supernatant. After repeated freezing and thawing for 3–4 times at −20 °C (refrigerator) and 37 °C (water bath), the cells were crushed in an ice bath at 600 W and treated with ultrasound for 2 s followed by a gap of 2 s, total for 6 min. After centrifugation for 10 min at 12
000 rpm for 5 min, and 5.0 mL of PBS (0.05 M, pH = 7.0) was added to the concentrated algal cell after discarding the supernatant. After repeated freezing and thawing for 3–4 times at −20 °C (refrigerator) and 37 °C (water bath), the cells were crushed in an ice bath at 600 W and treated with ultrasound for 2 s followed by a gap of 2 s, total for 6 min. After centrifugation for 10 min at 12![[thin space (1/6-em)]](https://www.rsc.org/images/entities/char_2009.gif) 000 rpm, the supernatant was taken, and its absorbance was measured at OD620, OD650, and OD565 nm using an automatic microplate reader. The components of phycobiliprotein were estimated by the following formulae:
000 rpm, the supernatant was taken, and its absorbance was measured at OD620, OD650, and OD565 nm using an automatic microplate reader. The components of phycobiliprotein were estimated by the following formulae:| Phycocyanin: PC (mg mL−1) = (OD620 − 0.7 × OD650)/7.38 | (2) |
| Allophycocyanin: APC (mg mL−1) = (OD650 − 0.19 × OD620)/5.65 | (3) |
| Phycoerythrin: PE (mg mL−1) = (OD565 − 2.8 × PC − 1.34AP)/1.27 | (4) |
2.6. FDA staining and esterase activity assay
FDA (Sigma, F-7378) was dissolved in acetone to obtain a 1 mM solution and kept in a brown bottle at −18 °C. Samples were collected every 5 d in the 30 day culture period. From each of the 12 flasks (treated and control samples), 5 mL of samples were obtained by centrifugation at 4000 rpm for 5 min. The harvested cells were resuspended in phosphate-buffered saline (PBS) (0.2 M, pH 7.4). Then, 0.5 mL of sample was placed in a PCR tube and stained with FDA; the final concentration was 25 μM. The solution was kept on ice for 8 min in the dark. The FDA fluorescence used to estimate the hydrolysis ratio of esterase was detected by the FL 1 detector (515–545 nm) through flow cytometry (FCM, BD FACSverse). The data were expressed as the mean fluorescence intensity (MFI) and stained cell percentages.332.7. Quality control and statistical analysis
All experiments were carried out in triplicate, and the results were expressed as averages. All of the chemicals used were of the highest analytical grade. All glassware and plastics were washed and soaked in 10% HNO3 for at least 24 hours before use, then thoroughly washed with tap water and rinsed three times with Milli-Q water. All solutions were prepared and diluted with Milli-Q water. SPSS 22.0, OriginPro 2016, and Flowjo 7.6 were used for statistical analysis. All data were first log-transformed to meet the requirement of normality for ANOVA and then analyzed using one-way ANOVA, where p < 0.05 represented significant differences and p < 0.01 represented extremely significant differences.3. Results and discussion
3.1. Algaecide morphology, distribution and particle size
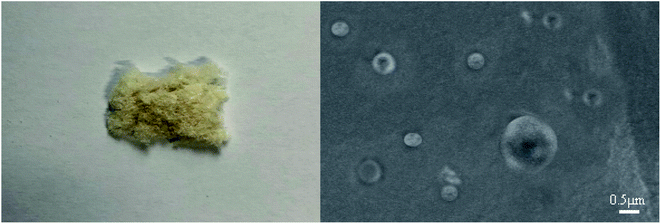
After washing, the suspension was centrifuged at high speed and freeze-dried to prepare the algaecide. Fig. 2 depicts the finished product's appearance and scanning electron microscope.After washing, the sample suspension was centrifuged at high speed and freeze-dried. Fig. 2 depicts the algaecide's appearance and scanning electron microscope (SEM), which shows a light yellow fluffy substance. Algaecide has a particle size of about 500 nm and a smooth and spherical surface. Following high-speed centrifugation and freeze-drying, many particles will congregate, affecting particle size. The occurrence of micron algaecide size may result from tiny algaecide agglomeration.
3.2. Accumulation of artemisinin from sustained-release algaecide in different media
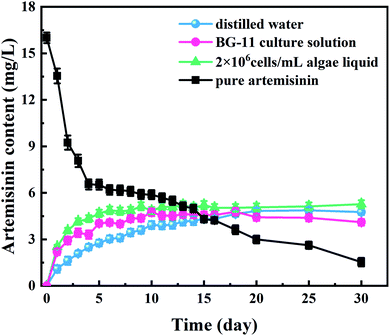
The curves of artemisinin accumulated from algaecide sustained-release microspheres in different media and the pure production group are shown in Fig. 3. The BG-11 and the algae liquid group experienced a surge in artemisinin accumulation, while the distilled water group experienced a gradually increasing trend from day 1 to day 5. Five days after the start of the experiments, although the accumulation ratio of the BG-11 and the algae liquid group decreased, the accumulation curves of the sustained-release algaecide in the three different solutions showed an increasing trend before stabilizing between 5.0 and 5.3 mg L−1 on day 10. Interestingly, a slight change occurred in the curves of the BG-11 group that were lower than those of the distilled water group from the 18th day, which eventually stabilized at 4.20 mg L−1.3.3. Algal growth inhibition
The inhibitory effect of pure artemisinin and artemisinin sustained-release algaecide on the growth of M. aeruginosa (logarithmic growth phase) is shown in Fig. 4. In the blank group, the density of M. aeruginosa increased continuously, and the algae grew well. The growth ratio slowed down and entered a stable growth period after 25 days. The action of pure artemisinin and its algaecide inhibited the growth of M. aeruginosa.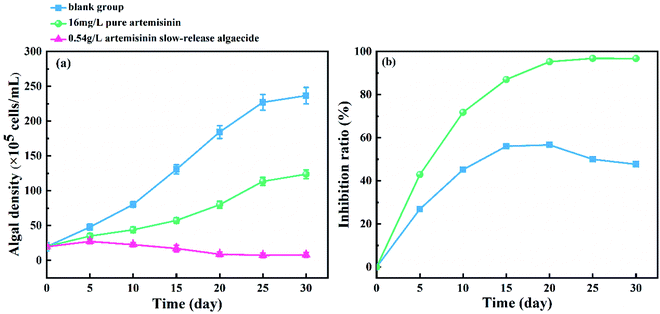 | ||
| Fig. 4 Effect of pure artemisinin and its sustained-release algaecide on (a) cell density and (b) inhibition ratio of M. aeruginosa. | ||
In the pure artemisinin group, the inhibition ratio showed an increasing trend before peaking at 56.0% on the 15th day, with algal growth significantly inhibited. The inhibition ratio then reached a plateau from the 15th day to 20th day. The inhibition ratio decreased while the growth ratio of algae increased as artemisinin was consumed from the 20th day. At the end of the experiment (the 30th day), the algal density of the pure production group was 1.89 × 10⁷ cells per mL.
The content of artemisinin in the algal fluid increased rapidly five days before the experiment (Fig. 3), but the inhibitory effect on M. aeruginosa was weak, and the algal density still increased (Fig. 4).
3.4. Effect of the residual solution containing artemisinin on cell density and inhibition ratio of M. aeruginosa
The effect of the remaining solution on M. aeruginosa density and inhibition ratio after stopping the application of slow-release algaecide is shown in Fig. 5 Within 10 to 75 days of the experiment, the algal density of the three remaining solutions was significantly lower than that of the blank group (p < 0.01). In the blank group, M. aeruginosa grew well, and the algal density continued to increase by 50 days. On the 75th day, the algal density showed a decreasing trend.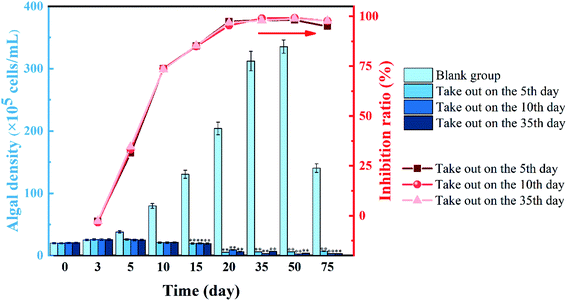 | ||
| Fig. 5 Effect of the residual solution containing artemisinin on cell density and the inhibition ratio of M. aeruginosa (*p < 0.05, **p < 0.01). | ||
In the artemisinin sustained-release algaecide group, the growth of M. aeruginosa in the early stage of the experiment (0–3 days) was not inhibited, which was consistent with the blank group. From the 5th day, the growth of M. aeruginosa in the sustained-release algaecide group was inhibited, and the algal density hardly increased. After the algaecide was removed on the 5th and 10th days, the solution was similar to the experimental group in which the sustained-release algaecide was still present. On the other hand, the algal density did not change much and was always inhibited. The experimental group's algal density declined on the 20th day, while the blank group continued to grow and the inhibition ratio increased. On the 50th day, the residual solutions in the three experimental groups had the best inhibitory effect on M. aeruginosa growth, with inhibition ratios of 99.2%, 98.2%, and 98.8%, respectively.
3.5. Effect on phycobiliprotein
The change in the phycobiliprotein content of M. aeruginosa under the action of pure artemisinin and artemisinin sustained-release algaecide is shown in Fig. 6.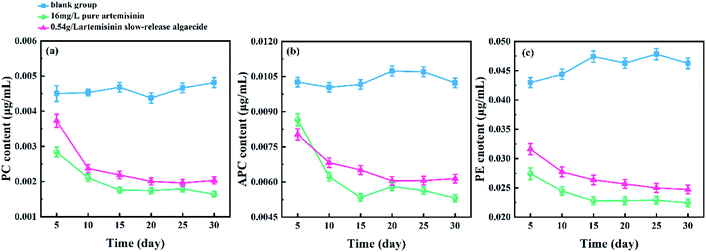 | ||
| Fig. 6 Effects of pure artemisinin and its sustained-release algaecide on the contents of phycobiliprotein of M. aeruginosa. (a) Phycocyanin (PC); (b) allophycocyanin (APC); (c) phycoerythrin (PE). | ||
The PC content fluctuated slightly in the blank group when the experiment started. However, the PC of both the pure artemisinin and the artemisinin sustained-release algaecide groups sharply decreased on the 10th day and remained at about 0.002 g mL−1. The PC content in the pure artemisinin group was always slightly lower than that of the artemisinin sustained-release algaecide group (Fig. 6a).
The APC content increased slightly on the 15th day in the blank group and then gradually decreased to the initial level of the experiment, with no overall fluctuation. The changing trend of APC content in the pure artemisinin and sustained-release algaecide was similar to that of PC, which decreased significantly on the 10th day and reached a dynamic balance. The APC content of the pure artemisinin group was higher than that of the artemisinin sustained-release algaecide group on the fifth day, and after that, it was lower than that of the artemisinin sustained-release algaecide group (Fig. 6b).
The PE content gradually increased in the blank group, while in the pure artemisinin group and the artemisinin sustained-release algaecide group, it showed a decreasing trend first and then stabilized. The PE content in the blank group was always the highest, while that in the pure artemisinin group was always the lowest (Fig. 6c).
3.6. Effect on esterase activity
The esterase activity of M. aeruginosa, after adding pure artemisinin and artemisinin sustained-release algaecide, is shown in Fig. 7. A large amount of pure artemisinin reduced the esterase activity of M. aeruginosa and gradually returned to the normal level on the fifth day. Under the action of pure artemisinin, the metabolic activity of M. aeruginosa was inhibited. This was also the result of the outflow of fluorescent substances caused by damage to the algal cell membrane. With the consumption of pure artemisinin, the algal cells resumed growth, and the esterase activity returned to normal levels.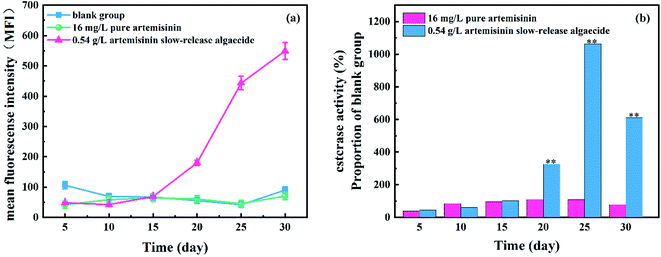 | ||
| Fig. 7 Effect of the residual solution containing artemisinin on the cell density and inhibition ratio of M. aeruginosa (*p < 0.05, **p < 0.01). | ||
3.7. Effect on the physicochemical properties of the algal solution
The changes in the DO content of the medium under the action of pure artemisinin and its sustained-release algaecide are shown in Fig. 8a. In the blank group, the DO content gradually increased before reaching a peak at about 18.9 mg L−1 on the 10th day and gradually decreased and stabilized at 10.0–12.0 mg L−1 after 20 days. The DO content of the pure artemisinin group decreased more rapidly until it reached a trough, with the lowest value of 2.71 mg L−1 on the 5th day, then gradually increased to 8.67 mg L−1 at the end of the experiment. The DO content of the artemisinin sustained-release algaecide group was similar to that of the pure artemisinin group, where the DO content suddenly dropped to the lowest value (2.21 mg L−1) on the 5th day. The difference between the two groups was that the DO content in the artemisinin sustained-release algaecide group remained at 3.69–4.22 mg L−1 after the fifth day; there was no increasing trend.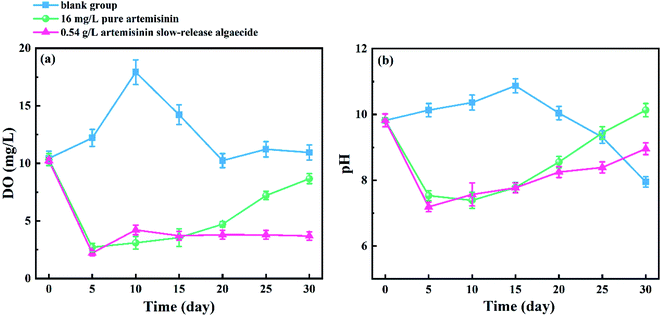 | ||
| Fig. 8 Changes in (a) DO and (b) pH in the culture solution, in the presence of pure artemisinin and its sustained-release algaecide. | ||
The change in the pH of the medium is shown in Fig. 8b, which is similar to that of DO. In the blank group, the overall pH initially showed a slowly rising trend and then sharply declined, reaching the maximum value (10.8) on the 15th day and the lowest value (7.8) on the 30th day. The pH of the culture medium in the pure artemisinin group and the artemisinin sustained-release algaecide group was similar, and the overall trend showed an initial decrease followed by an increase. On the fifth day, the pH suddenly decreased to 7.53 and 7.19, and then slowly increased to 9.20 and 10.13. The increase in the artemisinin pure group was greater than that in the artemisinin algaecide group.
Algae are the primary producers in water bodies and consume CO2 and H2O during photosynthesis to produce O2. Thus, they increase the DO content in the water.21 Therefore, with the proliferation of M. aeruginosa cells in the blank group, the number of algal cells increased, resulting in a gradual increase in the content of DO in water.21 After one cycle (10 days), the content of DO remained stable. In the pure artemisinin group, the photosynthesis of M. aeruginosa was inhibited in the first 20 days, resulting in a low level of DO content. With the consumption and transfer of artemisinin in the solution, the algae restored photosynthesis and increased the DO content of the culture solution. In the artemisinin sustained-release algaecide group, since there was always enough algae-inhibiting active substances in the water body to inhibit the photosynthesis of M. aeruginosa, the DO content in the water body was always low.
The change in the pH was related to the CO2 content in the water. The dissolved CO2 in the water formed carbonate, and the ionization [H+] caused the pH of the water to drop.22 In the blank group, due to the adaptability of the organism, the algae adjusted the pH of the water during growth and turned the water alkaline. When sufficient nutrient elements are present, M. aeruginosa grows normally and consumes CO2 in the water during photosynthesis, causing the pH to drop.23
3.8. EPS fluorescence
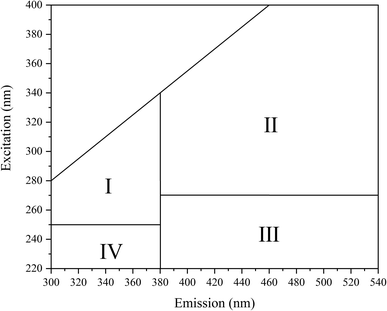
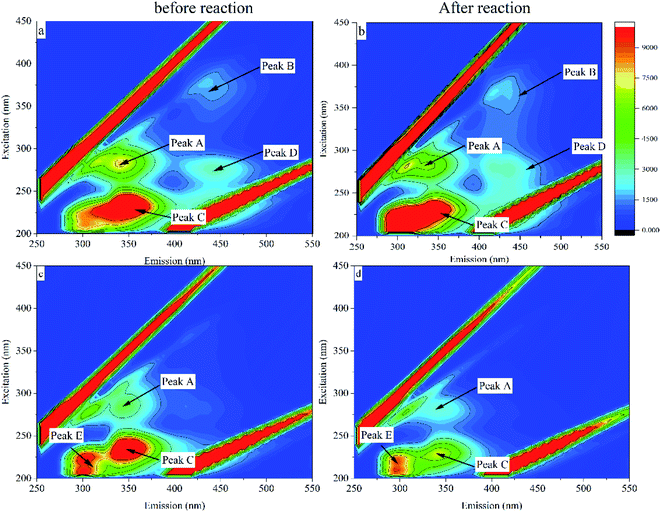
Excitation–emission matrix (EEM) fluorescence spectroscopy can analyze the chemical structural properties and origin of substances based on the information of fluorescence peaks.34 The fluorescence intensity information of a compound is analyzed by acquiring changes in excitation wavelength and emission wavelength. The study shows that the EEM map can be divided into four regions (Fig. 9), which are I: microbial metabolites-like, II: humic acid-like, III: fulvic acid-like, IV: aromatic protein-like.35 Changes in fluorescence characteristics of EPS before and after 30 days of reaction with MC-LR are shown in (Fig. 10). Composition changes of EPS before and after reaction can be obtained by comparing the spectrum of fluorescence peak characteristic area in Fig. 9 (Table 1).| Characteristic peak | Ex/Em | Region | Substance |
|---|---|---|---|
| Peak A | 265/335 | I | Microbial metabolites |
| Peak B | 355/410 | II | Humic acid |
| Peak C | 230/320 | IV | Aromatic protein |
| Peak D | 280/430 | II | Humic acid |
| Peak E | 215/295 | IV | Aromatic protein |
A fluorescence characteristic peak (peak A) appeared in the fluorescence image in the blank group, which was located in area I and was identified as a microbial metabolite. Another characteristic peak (peak B) with a relatively weak fluorescence signal located in region II (Ex/Em = 355/410) was identified as humic acid-like. Before and after the intracellular MC-LR reaction, the characteristic fluorescence peaks did not change much, and the fluorescence intensity of peak A and peak B increased slightly. Along with the two fluorescence peaks of peak A and peak B, another characteristic peak (peak C) was also observed, which was located in zone IV with Ex/Em = 230/320 and represented an aromatic protein (Fig. 10c and d). There was no noticeable change in the fluorescence characteristic peak.
4. Discussion
The pure artemisinin group showed an opposite trend compared to the microsphere groups. The artemisinin concentration decreased sharply in the first four days. The concentration of artemisinin in the pure artemisinin group was lower than that of the artemisinin sustained-release algaecide group on the 13th day, and it showed a decreasing trend after that. On the 15th day, the concentration of artemisinin in the solution was lower than 5.00 mg L−1, which the effective algae-suppressing components might explain in the inhibitory substances degrading and transferring over time.Previous studies have confirmed that when artemisinin is absorbed on the microcapsule shell, the sudden dissolution in water causes a large amount of artemisinin (5.00–8.00 mg L−1) to be released from sustained-release algaecide at the beginning of the experiment (0–3 days).24 However, in this study, the accumulated amount of artemisinin in the solution was considerably lesser than that released. In distilled water and BG-11, the artemisinin released at low concentration was probably due to a slight solubility in water and adsorption on the wall of the conical flask.
The artemisinin content gradually increased with the stable release of algaecide (from day 3). Liu et al. showed that artemisinin degraded after some time, with 30% degradation observed after half a year.25 With the release and degradation of the algaecide in the experiment, the artemisinin content in water gradually reached a dynamic balance. According to a previous study,17 artemisinin content in algal solution increased rapidly in the first five days, but with the increase of algal density, artemisinin had a little inhibitory effect on M. aeruginosa. After 10 days, the content of artemisinin was stable at 5.0–5.3 mg L−1, and the growth of M. aeruginosa was severely inhibited, indicating that artemisinin inhibited the growth of algae and the release of algaecide reached a dynamic balance, and its concentration was enough to inhibit algal growth. The artemisinin accumulation curves of the sustained-release algaecide in the three different solutions were similar and indicated that the sustained-release algaecide was stable in different media.
In the artemisinin sustained-release algaecide group, the growth of M. aeruginosa was strongly inhibited. At the beginning of the experiment (0–5 days), the algal density increased slowly but was lower than the blank and pure artemisinin group and then gradually decreased. The algal density fluctuated between 7.0 and 12.0 × 10⁵ cells per mL after 20 days. The inhibition ratio of artemisinin sustained-release algaecide on M. aeruginosa gradually increased (0–20 days) and stabilized (20–30 days), reaching a maximum of 96.8%. These results indicated that the artemisinin sustained-release algaecide released artemisinin every day, acting on M. aeruginosa and inhibiting its proliferation before achieving a stable algae suppression effect. The total artemisinin was stable at 5.00–5.30 mg L−1 after 10 days. During this time, the growth of M. aeruginosa was strongly inhibited, which indicated that the action of artemisinin on algal cells and the amount of slow-release algaecide released reached a dynamic equilibrium, and the equilibrium concentration was enough to inhibit the growth of M. aeruginosa. The concentration of artemisinin in the pure artemisinin group continued to decrease (0–30 days), which indicated that it would consume artemisinin when acting on algal cells. From the 15th day to the 20th day, the algal density remained stable and gradually increased (Fig. 2). This was because the concentration of artemisinin during this time was lesser than 5.00 mg L−1, which is the threshold for inhibiting the algal growth.26 The concentration of artemisinin in the solution was insufficient to inhibit the growth of M. aeruginosa; thus, the algae resumed growth.
The experimental group, where the artemisinin sustained-release algaecide was removed on the fifth day, had a slightly decreased growth inhibitory effect on M. aeruginosa after the 75th day. The results showed that artemisinin in this group was consumed during algal suppression due to its action on algal cells, and the content in the solution was insufficient to completely inhibit the growth of algae. In summary, the artemisinin sustained-release algaecide had a sustained algae-inhibiting effect on M. aeruginosa.
Cyanobacteria have a simpler photosynthetic mechanism than higher plants. The phycobilisome, a specific auxiliary light-absorbing pigment system located in the thylakoid's cytoplasmic surface, transfers the captured light energy to the photosynthetic system II (PS II) reaction center. The phycobiliprotein of M. aeruginosa (phycocyanin (PC), allophycocyanin (APC), and phycoerythrin (PE)) is the main functional group of cyanobacterial photosynthesis light-harvesting antenna and can transfer absorbed energy to algal cells for the survival of the algae and increase in their biomass.
Previous laboratory studies showed that the chlorophyll content in the pure artemisinin group decreased, then gradually returned to the blank level as the exposure time increased, while the one in the artemisinin slow-release algaecide group declined.24 In this study, pure artemisinin and its sustained-release algaecide inhibited the synthesis of phycobiliproteins, thereby inhibiting the photosynthesis of M. aeruginosa. Some researchers found that phenolic acid salicylic acid can inhibit the capture and absorption of light by inhibiting chlorophyll-a and other photosynthetic pigments of M. aeruginosa; thus, affecting the composition of all components of phycobiliproteins, causing the inhibition of algal growth and even death.27 The addition of a high concentration of garlic can inhibit the synthesis of photosynthetic pigments such as chlorophyll-a in M. aeruginosa, affecting the absorption of light energy by algal cells and reducing the photoreaction, thereby disrupting the composition of phycobiliprotein components in M. aeruginosa.28 The results of this study regarding the disruption of the composition phycobiliprotein are similar to the results of the studies discussed above.
The phycobiliprotein content in the pure artemisinin group was lower than that in the blank group, and the chlorophyll-a content gradually recovered. This was probably induced by the same precursor compound used by the biosynthesis of chlorophyll and phycobilin. When the phycobiliprotein synthesis was inhibited, the supply of precursor compounds required for chlorophyll synthesis increased.29 Sun cultured algal cells in the dark to suppress chlorophyll synthesis and found that the phycobiliprotein content was increased due to chlorophyll deficiency in algal cells.29 The contents of PC and APC were four and six times higher than those in the control group under the same conditions.
Under the action of artemisinin sustained-release algaecide, the esterase activity of M. aeruginosa cells continued to increase. On the 30th day, in the stained-release algaecide group, the esterase activity of M. aeruginosa increased continuously, which was about 100 times that of the control group. However, it was lower than the blank group at the beginning of the experiment (0–15 days). This was because the sustained-release algaecide continuously released artemisinin into the water body, resulting in the continuous increase of the cumulative concentration, which inhibited the esterase activity. However, the esterase activity recovered and continued to increase after the 15th day because the slow release of the algaecide did not pose a threat to M. aeruginosa but increased the metabolic activity of algal cells. Esterase also has a non-energy-dependent metabolic activity, and its esterase activity remains even after cell death.30 Moreover, adding artemisinin might cause programmed cell death in Microcystis cells under sustained allelopathic stress.31 By keeping the structure of their cell membrane intact, algal cells can accumulate fluorescein produced by FDA and esterase, which enhance the fluorescence intensity.32
This caused M. aeruginosa in the blank group to enter a stable phase on the 20th day, resulting in a slight decrease in the pH of the culture solution, which then stabilized. In the pure artemisinin and sustained-release algaecide groups, the growth and photosynthesis of M. aeruginosa were strongly inhibited, leading to a decrease in the pH of the water. When artemisinin in the pure artemisinin group is consumed, the algae gradually adapt to the external environment and slowly recover photosynthesis, resulting in a gradual increase in the pH. The phycobiliproteins in the artemisinin algaecide group showed a declining trend when the photosynthesis of M. aeruginosa was inhibited. This reduced the CO2 consumption in the water body and thus, increased the pH. The pH of water affects the growth of M. aeruginosa, and the structure of algal cells is damaged in a highly acidic medium (H+ concentration is high) or a highly alkaline medium (OH-concentration is high).
Algae are the primary producers in water bodies and consume CO2 and H2O during photosynthesis to produce O2, thereby increasing the DO content in the water. Therefore, with the proliferation of M. aeruginosa cells in the blank group, the number of algal cells increased, resulting in a gradual increase in the content of DO in the water. After one cycle (10 days), the content of DO remained stable. In the pure artemisinin group, the photosynthesis of M. aeruginosa was inhibited in the first 20 days, resulting in a low content of DO. With the consumption and transfer of artemisinin in the solution, the algae restored photosynthesis and increased the DO content of the culture solution. In the artemisinin sustained-release algaecide group, since there was enough algae-inhibiting active substance in the water body to inhibit the photosynthesis of M. aeruginosa, the DO content in the water body was always low.
A change in the pH is related to the CO2 content in the water. The dissolved CO2 in the water forms carbonate and the ionization [H+] causes the pH of the water to drop. In the blank group, due to the adaptability of the organism, the algae adjusted the pH of the water during growth, which caused the water to turn alkaline. When sufficient nutrient elements were present, M. aeruginosa grew normally, and CO2 in the water was consumed during photosynthesis, which caused the pH to drop.
5. Conclusion
Pure artemisinin can significantly reduce the content of phycobiliprotein and esterase activity, causing algal cells to undergo photosynthesis in a short period (0–20 days) and resulting in the death of many algal cells. There were very few living cells in the solution which were initially prevented from growing; after consuming pure artemisinin, they gradually resumed growth. The artemisinin sustained-release algaecide released artemisinin gradually, and the cumulative concentration of sustained-release in different media followed a similar pattern. After 10 days, the effect of artemisinin on algal cells and the amount of the sustained-release algaecide reached a dynamic balance, which was sufficient to inhibit M. aeruginosa growth. Additionally, most algal cells died on reducing the content of phycobiliproteins in algal cells. Although the growth of some cells was inhibited, cell activity was still detected. Since the esterase had an energy-independent metabolic activity, its activity recovered and continued to increase after 15 days. After the artemisinin sustained-release algaecide was removed from the culture solution, the artemisinin in the solution still showed a continuous algae-inhibiting effect.Data availability
Data, associated metadata, and calculation tools are available from the corresponding author (E-mail: Sangwenlu723@hhu.edu.cn).Conflicts of interest
The authors declare that they have no known competing financial interests or personal relationships that could have appeared to influence the work reported in the present study.Acknowledgements
This work was supported jointly by the Key Program of the National Natural Science Foundation of China (Grant No. 51779079, 51579073, 51979137), the National Science Fund for Creative Research Groups of China (Grant No. 51421006), the Program for Changjiang Scholars and Innovative Research Team at Hohai University (Grant No. IRT13061) the Project Funded by the Priority Academic Program Development of Jiangsu Higher Education Institutions (PAPD), and the Top-notch Academic Programs Project of Jiangsu Higher Education Institutions (TAPP).References
- W. Huang, A comprehensive control of cyanobacterial blooms and eutrophication, China Rural Water and Hydropower, 2014, 4, 44–50 Search PubMed.
- X. C. Luo, X. Huang, Y. Cao, R. R. Hang and Y. C. Li, Dominant meteorological factors affecting cyanobacterial blooms under eutrophication in Lake Taihu, J. Lake Sci., 2019, 31(05), 1248–1258 Search PubMed.
- Z. P. Duan, X. Tan and N. G. Li, Ultrasonic selectivity on depressing photosynthesis of cyanobacteria and green algae probed by chlorophyll-a fluorescence transient, Water Sci. Technol., 2017, 76(7–8), 2085–2094, DOI:10.2166/wst.2017.376.
- X. Hu, Y. G. Liu and G. M. Zeng, et al., Effects of limonene stress on the growth of and microcystin release by the freshwater cyanobacterium Microcystis aeruginosa FACHB-905, Ecotoxicol. Environ. Saf., 2014, 105, 121–127, DOI:10.1016/j.ecoenv.2014.01.023.
- S. Q. Zhou, Y. S. Shao and N. Y. Gao, et al., Effects of different algaecides on the photosynthetic capacity, cell integrity and microcystin-LR release of Microcystis aeruginosa, Sci. Total Environ., 2013, 463–464, 111–119, DOI:10.1016/j.scitotenv.2013.05.064.
- X. Wu, H. Wu and J. Chen, et al., Effects of allelochemical extracted from water lettuce (Pistia stratiotes Linn.) on the growth, microcystin production and release of Microcystis aeruginosa, Environ. Sci. Pollut. Res. Int., 2013, 20(11), 8192–8201, DOI:10.1007/s11356-013-1783-x.
- B. L. Rouzic, G. Thiébaut and L. Brient, Selective growth inhibition of cyanobacteria species (Planktothrix agardhii) by a riparian tree leaf extract, Ecol. Eng., 2016, 97, 74–78, DOI:10.1016/j.ecoleng.2016.07.021.
- J. Y. Zhu, B. Y. Liu, J. Wang, Y. N. Gao and Z. B. Wu, Study on the mechanism of allelopathic influence on cyanobacteria and chlorophytes by submerged macrophyte (Myriophyllum spicatum) and its secretion, Aquat. Toxicol., 2010, 98(2), 196–203, DOI:10.1016/j.aquatox.2010.02.011.
- M. Yilimulati, J. Y. Jin and X. Wang, et al., Regulation of Photosynthesis in Bloom-Forming Cyanobacteria with the Simplest β-Diketone, Environ. Sci. Technol., 2021, 55(20), 14173–14184, DOI:10.1021/acs.est.1c04683.
- H. Q. Wu, L. X. Ni and C. H. Du, et al., Effects of allelochemical artemisinin in Artemisia annua on Microcystis aeruginosa: growth, death mode, and microcystin-LR changes, Environ. Sci. Pollut. Res., 2021, 28, 45253–45265, DOI:10.1007/s11356-021-13793-x.
- E. L. Rice, Allelopathy, 1984,(1), 292–293 Search PubMed.
- Y. Liu, P. Guo, B. Lu, W. Huang and J. Wan, Effects of new algaecide chitosan-gallate on growth of Microcystis flos-aquae and Chlorella pyrenoidosa, J. Cent. South Univ. (Sci. Technol.), 2014, 45(7), 2538–2546, DOI:10.1016/j.seppur.2022.120548.
- P. Y. Guo, Y. Liu and C. Liu, Effects of chitosan, gallic acid, and algicide on the physiological and biochemical properties of Microcystis flos-aquae, Environ. Sci. Pollut. Res., 2015, 22(17), 13514–13521, DOI:10.1007/s11356-015-4500-0.
- L. X. Ni, K. Acharya and G. X. Ren, et al., Preparation and characterization of anti-algal sustained-release granules and their inhibitory effects on algae, Chemosphere, 2013, 91(5), 608–615, DOI:10.1016/j.chemosphere.2012.12.064.
- H. X. Huang, X. Xiao and A. Ghadouani, et al., Effects of Natural Flavonoids on Photosynthetic Activity and Cell Integrity in Microcystis aeruginosa, Toxins, 2015, 7(1), 66–80, DOI:10.3390/toxins7010066.
- H. M. Huang, X. Xiao and F. Lin, et al., Sustained-release beads of natural allelochemicals for the long-term control of cyanobacterial growth: preparation, release dynamics and inhibitory effects, Water Res., 2016, 95, 113–123, DOI:10.1016/j.watres.2016.02.058.
- L. X. Ni, D. Y. Li and S. Z. Hu, et al., Effects of artemisinin sustained-release granules on mixed alga growth and microcystins production and release, Environ. Sci. Pollut. Res., 2015, 22(23), 18637–18644, DOI:10.1007/s11356-015-5438-y.
- S. Z. Hu, Research on the effect of algicide sustained-release granules on aquatic organisms, HoHai University, 2014 Search PubMed.
- D. Y. Li, Research on algal inhibition mechanism of sustained-release microsphere and its preliminary application on actual water, HoHai University, 2017 Search PubMed.
- Z. X. Wu, Studies on the genetic diversity and morphological and physiological adaptation of Microcystis, Institute of Hydrobiology, Chinese Academy of Sciences, 2006 Search PubMed.
- Y. Q. Deng, The research of TTPC controlling Microcystis aeruginosa in experiment Deng Yongqiang (basic veterinary medicine) directed by Wang Kaiyu, Sichuan Agricultural University, 2005 Search PubMed.
- Y. P. Huang, D. F. Liu, S. Y. Zhang, D. L. Zhang, W. H. Ma and J. C. Zhao, Fenton Photocatalytic Degradation of Organic Dye under Visible Irradiation, Chem. J. Chin. Univ., 2005, 26(12), 2273–2278 CAS.
- Y. L. Huang, D. B. Ji, M. X. Chen and D. F. Liu, Influence of water pH value on cyanobacterial blooms, The People’s Yangtze, 2008, 39(2), 63–65 Search PubMed.
- L. X. Ni, K. Acharya, G. Ren, S. Li, Y. Li and Y. Li, Preparation and characterization of anti-algal sustained-release granules and their inhibitory effects on algae, Chemosphere, 2013, 91, 608–615, DOI:10.1016/j.chemosphere.2012.12.064.
- H. Liu, J. Huang and L. Yuan, In vitro effect of artemisinin on microbial biomasses, enzyme activities and composition of bacterial community, Appl. Soil Ecol., 2018, 124, 1–6, DOI:10.1016/j.apsoil.2017.10.022.
- X. Chang, F. Eigemann and S. Hilt, Do macrophytes support harmful cyanobacteria? Interactions with a green alga reverse the inhibiting effects of macrophyte allelochemicals on Microcystis aeruginosa, Harmful Algae, 2012, 19, 76–84, DOI:10.1016/j.hal.2012.06.002.
- L. Hu, G. Tong and G. Huang, et al., Allelopathy inhibition of salicylic acid on Microcystis aeruginosa, J. South. Agric., 2017, 48, 169–173 CAS.
- L. X. Dong, L. Hu, K. Hu, Y. Xiao and X. Yang, The allelopathic inhibition of Allium sativum on Microcystis aeruginosa, Acta Agric. Univ. Jiangxiensis, 2016, 38, 1167–1173 Search PubMed.
- X. Y. Sun, Y. Liu and Q. Y. Wu, The effects of deletion of chlorophyll and heterotrophy on phycobiliprotein content of cyanobacterium Synechocystis sp. PCC6803, Bulletin of Botany, 1998, 15(2), 58–62 Search PubMed.
- D. Novo, N. G. Perlmutter, R. H. Hunt and H. M. Shapiro, Accurate flow cytometric membrane potential measurement in bacteria using diethyloxacarbocyanine and a ratiometric technique, Cytometry, 1999, 55–63, DOI:10.1002/(SICI)1097-0320(19990101)35:1<55::AID-CYTO8>3.0.CO;2-2.
- W. Zheng, U. Rasmussen and S. Zheng, et al., Multiple Modes of Cell Death Discovered in a Prokaryotic (Cyanobacterial) Endosymbiont, PLoS One, 2013, 8(6), e66147, DOI:10.1371/journal.pone.0066147.
- J. M. Gump and A. Thorburn, Autophagy and apoptosis: what is the connection?, Trends Cell Biol., 2011, 21(7), 387392, DOI:10.1016/j.tcb.2011.03.007.
- G.D. Fan, D. M. Liu and L. Qian, Fluorescein diacetate and propidium iodide FDA-PI double staining detect the viability of Microcystis sp. after ultrasonic irradiation., J. Food, Agric. Environ., 2013, 11(3 & 4), 2419–2421 Search PubMed.
- X. J. Liu, Study on The Three-Dimensional Fluorescence Characteristics of Pollutants of Surface Drinking Water Source [D], Hebei University of Science and Technology, 2012 Search PubMed.
- Y.P. Huang, D.F. Liu and S.Y. Zhang, et al., Fenton Photocatalytic Degradation of Organic Dye Under Visible Irradiation, Chem. J. Chin. Univ., 2005, 26(12), 2273–2278, DOI:10.1038/sj.cr.7290370.
| This journal is © The Royal Society of Chemistry 2022 |

