 Open Access Article
Theoretical design and characterization of new terpolymer donors based on PTB7Ir for high-efficiency triplet-material-based organic photovoltaics†
Shuangbao Li *a,
Yang Chena,
Zhen Li
 a,
Jianpo Zhanga,
Jie Chen
 a,
Yun Geng
 b and
Zhongmin Su
 *bcd
*bcd
aSchool of Chemical and Pharmaceutical Engineering, Jilin Institute of Chemical Technology, Jilin, 132022, P. R. China. E-mail: lishb997@nenu.edu.cn
bInstitute of Functional Material Chemistry, Faculty of Chemistry, Northeast Normal University, Changchun, 130024, P. R. China
cSchool of Chemistry and Environmental Engineering, Changchun University of Science and Technology, Changchun, 130022, P. R. China
dJilin Provincial Science and Technology Innovation Center of Optical Materials and Chemistry, Changchun, 130022, P. R. China
First published on 18th March 2022
Abstract
In the current work, eleven terpolymer donors with different electron-withdrawing groups were designed and investigated based on the reported PTB7Ir to screen outstanding donors for triplet-material-based organic photovoltaics (T-OPVs). Geometry structures, frontier molecular orbital energy levels, energy driving forces (ΔEL–L), absorption spectra, energy differences between S1 and T1 states (ΔEST), and driving forces of the triplet charge recombination (−ΔGCRT) of PTB7Ir and designed 1–11 systems were evaluated by DFT and TD-DFT methods to estimate the light absorption abilities and the charge transfer dynamics. The results show that designed 5, 8, 10 and 11 possess larger spin–orbit couplings (SOC) affinity and smaller ΔEST and −ΔGCRT values, which could effectively suppress the triplet charge recombination process at the donor/acceptor interface. Excitingly, the designed terpolymer 10 presents enhanced light absorption, revealing that it will be a promising donor candidate for high-performance T-OPV devices. Moreover, the results can provide theoretical guidelines to predict new terpolymer donors of T-OPVs.
1. Introduction
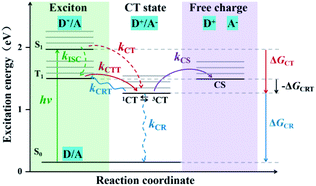
Organic photovoltaics (OPVs) have achieved impressive advances in their low-cost fabrication, large-area production, and flexible device structure.1–5 To date, favorable power conversion efficiencies (PCEs) of over 18% have been obtained,6–9 which make the industrialization possible. The exploration of high-efficiency photovoltaic materials in OPVs has been regarded as one of the significant challenges for improving the PCE.In OPV devices, excitons are photogenerated in donor (D) and/or acceptor (A) species and dissociated at D/A interfaces. This process leads to either direct long-range charge separation or generation of interfacial singlet charge transfer (1CT) states followed by vibrational relaxation to the lowest 1CT (1CT1) states. Then the interfacial 1CT1 states dissociate into free charge carriers, but also can occur geminate charge recombination (CR) which competes with exciton dissociation.10 In order to achieve a high-efficiency solar cell device, it is necessary to restrain geminate CR processes. One effective way is to promote the generation of triplet charge transfer (3CT) states. On one hand, triplet excitons can provide sufficient time for the CT state to dissociate the bound charge pair rather than recombination, because their radiative decay is dipole forbidden which will lead to longer lifetimes.11,12 On the other hand, it is found that the charge transfer from the lowest charge transfer triplet (3CT1) to triplet excited (T1) states, i.e., the charge recombination to triplet (CRT), can be prevented when the energy level of 3CT state is lower than that of T1 state of donor materials.13,14 The state diagram of various photophysical processes is shown in Fig. 1.
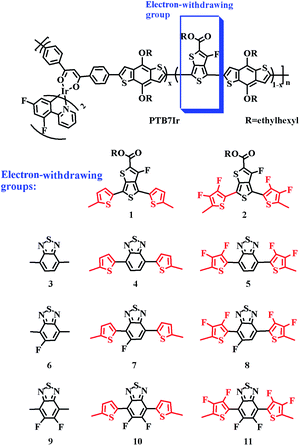
In order to get more 3CT states, triplet materials containing heavy metal complexes are adopted as source of 3CT by some research groups, and leading to the increased charge-transfer efficiency and improved photovoltaic performance.11,12,15–20 Notably, Huang and co-workers reported a series of Ir-embedded PTB7Ir polymers (see in Fig. 2), in which various low concentrations of (dfppy)2Ir(dbm) (0–5 mol%) were introduced into the backbone of PTB7 (polythieno[3,4-b]-thiophene-co-benzodithiophene), and the improved PCEs have been achieved owing to the participation of triplet effects. Compared to PTB7, the PCEs of the devices based on PTB7Ir1 (containing 1 mol% Ir concentration) were all enhanced over 30%.12 In addition, they introduced a low concentration of Pt/Ir complexes into the PTB7-Th polymer backbone (it is made by grafting the 2-ethylhexyl-thienyl group into the benzodithiophene unit of PTB7) by a similar approach, achieving the increases of PCEs from 7.92% to 8.45% and 9.19%, respectively.19,20 However, so far, there are no explicit design strategies of terpolymer donors containing heavy metal complexes of triplet material-based OPVs (T-OPVs), because it is difficult to build a direct relationship between photoelectric conversion efficiency and molecular structure of the donor or D/A complex. Previously, we explored why PTB7Ir/PC71BM device exhibits the enhanced PCE (8.71%) compared with 6.64% of PTB7/PC71BM device, and discussed how to prevent the CRT process at D/A interface for T-OPVs.21 The results indicate that the improved PCE of the PTB7Ir/PC71BM device is mainly ascribed to the increasing exciton diffusion length of triplet excitons. Besides, the proper increase of angle and number of torsional angles between electron donating and withdrawing units of terpolymer donors can prevent the CRT process and further improve photovoltaic performance.
Herein, in the basis of PTB7Ir, we designed eleven terpolymers 1–11 through modifying and replacing the electron-withdrawing acceptor groups of PTB7Ir. All repeated units of PTB7Ir and terpolymers 1–11 are shown in Fig. 2. The introductions of thiophene π-bridge, fluorinated thiophene π-bridge, benzothiadiazole (BT) group and fluorinated benzothiadiazole (FBT and DFBT) group are aimed at tuning the energy levels and energy-gaps of S1, T1 and CT1 states to improve the short-circuit current density (Jsc). For example, (i) reducing the S1 energy level to broaden absorption spectra in near infrared range; (ii) reducing the energy difference between S1 and T1 states to promote intersystem crossing (ISC) process of excitons from singlet to triplet; and (iii) tuning 3CT1 energy level lower than T1 energy level to decrease values of driving force for the CRT (−ΔGCRT) as well as prevent CRT process. By density functional theory (DFT) and time-dependent DFT (TD-DFT) methods, we systematically investigated geometry structures, frontier molecular orbital (FMO) energy levels, energy driving forces (ΔEL–L), absorption spectra, energy differences between S1 and T1 states (ΔEST), and −ΔGCRT of PTB7Ir/PC71BM and 1–11/PC71BM systems, to perform a further analysis on charge transfer properties for efficient charge separation and photocurrent generation in T-OPVs. We expect that this work may serve as a theoretical guideline for the design and synthesis of high-performance T-OPV terpolymer donors.
2. Computational details
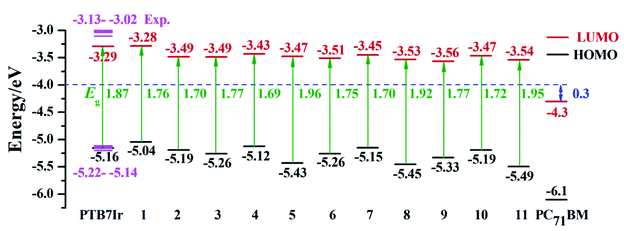
It has been reported that alkyl-branched chains possess little influence on the electronic structures and photoelectric properties of materials.22–24 Therefore, for all investigated polymers, the branched ethylhexyl side chains were substitute by methyl groups and the ends of oligomers were capped by hydrogen atoms to save computational cost. All of the calculations were performed by using Gaussian 09 software.25 Ir atom and non-metal atoms were described by LANL2DZ basis set and 6-31G(d) basis set, respectively.In our previous research,21 it is confirmed that when PTB7Ir molecule contain one metal complex and three organic building blocks (x = 0.25), the calculated HOMO energy level by PBE0 functional show good accordance with the measured experimentally (the calculated HOMO level is −5.16 eV and experimental values are in the range of −5.14 to −5.22 eV).12 Additionally, the B3LYP functional was proved to be an effective method to evaluate the absorption spectrum and the S1 vertical excitation energies of PTB7Ir molecule, because the maximum absorption wavelength value of PTB7Ir molecule calculated by TD-B3LYP//PBE0 functional (672 nm) is closer to the experimental data (678 nm).21 Meanwhile the effect of solvent (o-dichlorobenzene (DCB)) within polarizable continuum model (PCM) was considered in TD-DFT calculations. Also, the HOMO–LUMO energy gap of PTB7Ir was estimated as S1 vertical excitation energy, and the LUMO energy level was derived by adding the band-gap to HOMO level. The result from this method agreed well with the experimental LUMO level (the calculated LUMO energy level is −3.29 eV, electronic energy level is −2.70 eV, and experimental values are −3.02 to −3.13 eV).12 Thus, in this work, the above calculated methods were employed to investigate the geometries, FMO energy levels and photoexcitation properties of all terpolymer molecules. The calculation details are listed as follows: (i) ground-state geometries and HOMO energy levels are simulated by PBE0 functional; (ii) the absorption spectra, S1 and T1 vertical excitation energies are evaluated at the TD-PCM-B3LYP//PBE0 level in DCB solution; and (iii) the LUMO energy levels are obtained by adding S1 vertical excitation energies to the HOMO energy levels.
Our previous results indicated that when PC71BM is docked with the centre of polymer donor, the interfacial arrangement is preferable for PTB7Ir/PC71BM complex, since the lowest energies occur at the configuration.21 Therefore, in current work, for each D/PC71BM interface model, the starting configuration is designated that benzene cycle of PC71BM is oriented parallel to the thiophene (for PTB7Ir, 1 and 2 molecules) or benzene (for 3–11 molecules) cycles of acceptor units which are closer to the (dfppy)2Ir(dbm) complexes, which has been proved to be a preferred interfacial arrangement in our previous research. The initial distances between terpolymer donors and PC71BM were fixed at 3.5 Å. To save the computational cost, we demonstrated a comparative analysis of intermolecular charge transfer properties of PTB7Ir/PC71BM based on the ground-state geometries calculated by PBE0 and PBE0-D2 functionals, respectively (see Section SI of the ESI†). Note that PBE0-D2 is a functional considering dispersion correction, which presents the high computational cost. The results indicate that the two interface configurations of PTB7Ir/PC71BM exhibit similar equilibrium geometries and intermolecular charge transfer behaviors. Therefore, ground-state geometries of D/PC71BM complexes can be performed by PBE0 functional instead of PBE0-D2 functional with dispersion correction. Excited state properties were performed at the long-range-corrected CAM-B3LYP26,27 levels. It has been confirmed that CAM-B3LYP functional is suitable for the description of CT excited state properties of interfacial systems.28–30 The charge density difference (CDD) maps were simulated using Multiwfn 3.3.8 code31,32 to visualize CT excited states.33,34
3. Results and discussions
3.1 3D geometries
All molecular geometries were optimized at the PBE0 level as the above methods. The computed twist angles between each building blocks of PTB7Ir and 1–11 are plotted in Fig. 3 and S3 in ESI.† As seen from Fig. 3, twist angles between donor (benzothiadiazole, BDT) and acceptor (fluorinated benzothiadiazole, F-TT) units of PTB7Ir are in the range from 15° to 32°. Compared with PTB7Ir, the designed 1 and 2 show planar molecular structures due to the introductions of thiophene and fluorinated thiophene π-bridges. In particular, for 2 (see Fig. S3†), the twist angles between organic building blocks are all in close to 0° because of intramolecular F⋯S attractive interactions. And the distances between F and S atoms are approximately 2.92 Å, which are shorter than the sum of F and S van der Waals radii (3.27 Å proposed by Bondi and 3.19 Å proposed by Pauling). The planar molecular structures in the conjugated backbone increase more efficient π delocalization along the polymer chain, which will favor π-stacking and charge-transport properties. Compared to PTB7Ir, the designed 3, 6 and 9 also present increasing planarity due to the attractive interactions between N atom from benzothiadiazole and H atom from BDT, respectively. Obviously, 6 and 9 show perfect planar constructions, and the optimized twist angles between BDT and acceptor units (FBT for 6 and DFBT for 9) are also about 0°, which is attributed to N⋯H and F⋯S attractive interactions. In addition, compare with PTB7Ir, 4, 5, 7, 8, 10 and 11 adopt more twisted conformation, which may decrease the conjugation extent of polymers and increase the energy levels of S1 and T1 states. When T1 energy above the CT1 state, the CRT at D/A interface will be prevented to improve photovoltaic performance. However, note that the less planarity will cause the limited π-stacking interactions and lead to the undesirable charge transport and collection. Specifically, 4 present decreasing planarity in comparison with that of 3, which is because the repulsive interactions between H atom from thiophene π-bridge (or BDT) unit and S atom from BDT (or thiophene π-bridge) unit. Similarly, the planarity of 7 and 10 is lower than those of 6 and 9, respectively, because of the introduction of thiophene π-bridge. Unexpectedly, for 5, 8 and 11, the significant repulsive interactions, between F atom from fluorinated thiophene π-bridge and N atom from benzothiadiazole, lead to twist angles of ∼40° in the polymer backbone. As a result, the designed 1–3, 6 and 9 could display better charge transport and collection owing to their improved planarity, meanwhile, 4, 7 and 10 may suppress the CRT at the interface and enhance photovoltaic performance due to the proper torsional angles.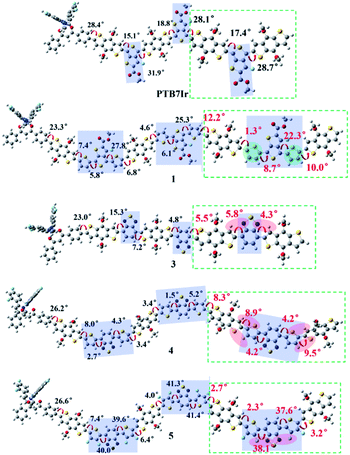 | ||
| Fig. 3 Schematic illustration of twist angles between donor and acceptor moieties of PTB7Ir, 1 and 3–5. The green dotted boxes represent the highlights. | ||
3.2 FMO energy levels
It is well known that FMO energy levels can dominate the photon absorption and charge separation abilities of OPVs.35,36 The FMO energy levels of all terpolymers are listed in Fig. 4, which are obtained according to the description of calculation details in Section 2. Also, the HOMO energy levels (EHOMO) calculated at the B3LYP/6-31G(d) (LANL2DZ for Ir atom) level are displayed in Table S2 in ESI.† Additionally, the FMO energy levels of the acceptor PC71BM measured in experiment are also depicted in Fig. 4.37,38 Seen from Fig. 4, the energy-gap (HOMO–LUMO) values of 5, 8 and 11 are larger than that of PTB7Ir, indicating that they may exhibit blue-shifted absorptions in comparison with PTB7Ir. This is because the significant twist angles in polymer backbones decrease the effective conjugation lengths.The energetic driving force ΔEL–L, defined by the difference between LUMO levels of donor and acceptor, is an important factor to evaluate charge separation ability at D/A interface.28,39 The charge separation of polymers will occur when ΔEL–L > 0.3 eV which is the estimated value of empirical exciton binding energy for polymers.37,40 As seen from Fig. 4, the calculated ΔEL–L values of all systems are larger than 0.3 eV, revealing the efficient charge separation at D/A interface.
3.3 Photon absorption
It is acknowledged that absorption spectra of donors need match the solar spectrum to ensure the efficient photovoltaic conversion, which will increase the Jsc and thus improve the PCE.41–43 The absorption spectra of PTB7Ir and 1–11 are shown in Fig. 5. Vertical excitation energies, oscillator strengths and dominant configurations of S1 states, and electronic density contours of FMOs are gathered in Tables S3† and 1, respectively. Seen from Fig. 5, the absorption range of all molecules cover the entire ultraviolet-visible, and the designed 3–11 display the similar peak shape and intensity in comparison with PTB7Ir. In addition, compared with PTB7Ir, the designed 5, 8 and 11 exhibit slightly blue-shifted absorption in low-energy region. This is because the introduction of fluorinated thiophene π-bridges brings about their large twist angles, which lead to poor conjugation along polymer backbones. Fortunately, other designed molecules have broadened and red-shifted absorption in the 400–1000 nm region. Table S3† illustrates that the maximum absorption peaks of all systems come from S0 → S1, corresponding to the transition from HOMO (H) to LUMO (L). The orbitals in HOMOs are mainly delocalized on the organic building blocks of polymers. Also, for PTB7Ir, the distribution of LUMO is localized on all organic building blocks (Table 1). For designed 3, 6 and 9, LUMO orbitals are mainly localized the middle three BDT units and three organic acceptor units. For other designed molecules, LUMO orbitals are localized the second and third BDT units from right, π-bridges, and organic acceptor units. The results indeed show that the designed 1–3, 4, 6, 7, 9 and 10 will present enhanced light absorption owing to their broad and red-shifted absorption in the visible and near-infrared regions of the solar spectrum.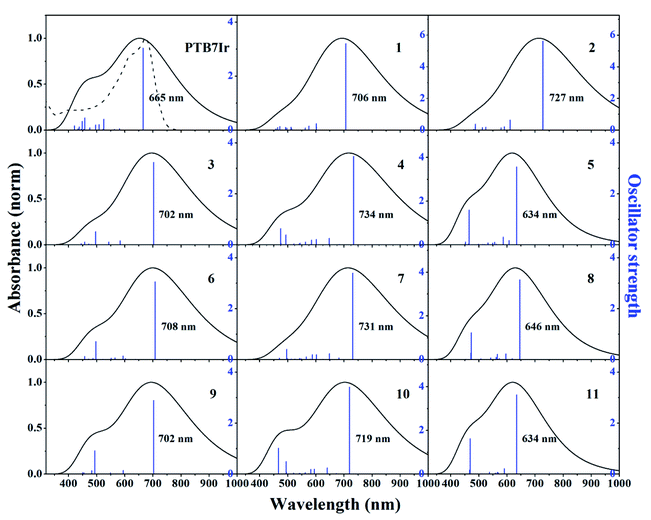 | ||
| Fig. 5 Simulated absorption spectra and oscillator strengths of PTB7Ir and 1–11 at the TD-PCM-B3LYP/6-31G(d) (LANL2DZ for Ir atom) level. The dotted line is the experimental absorption spectrum of PTB7Ir. Gaussian function was chosen as the broadening function with the value of the full width at half maximum set at 0.66667 eV, which is considered as an average width for the absorption band observed in the UV-vis region.44 | ||
3.4 Energy difference between S1 and T1 states
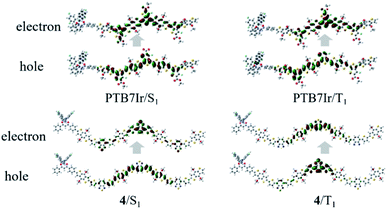
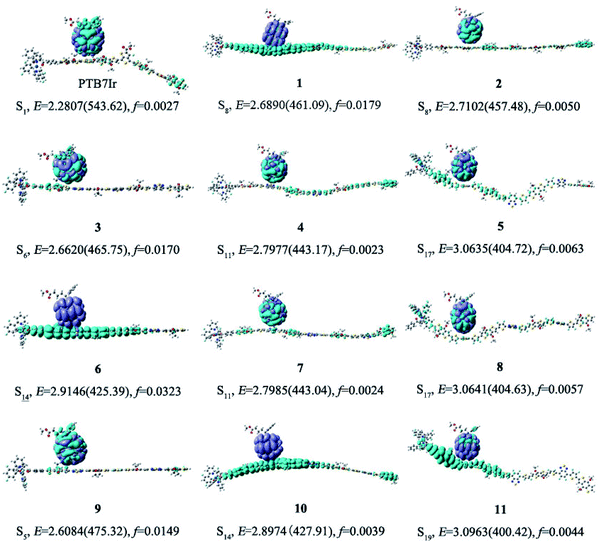
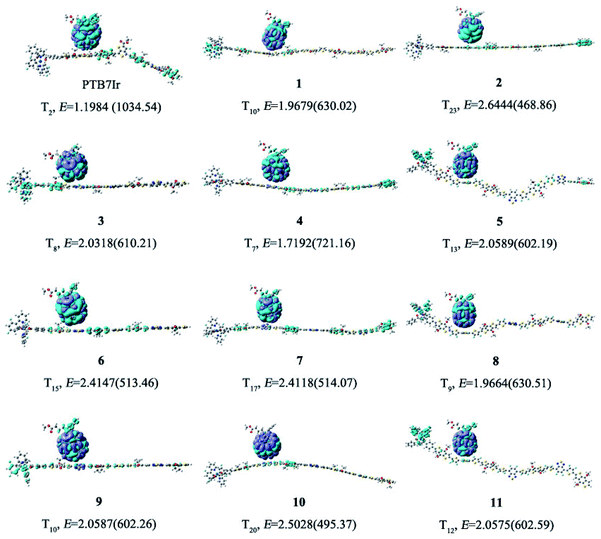
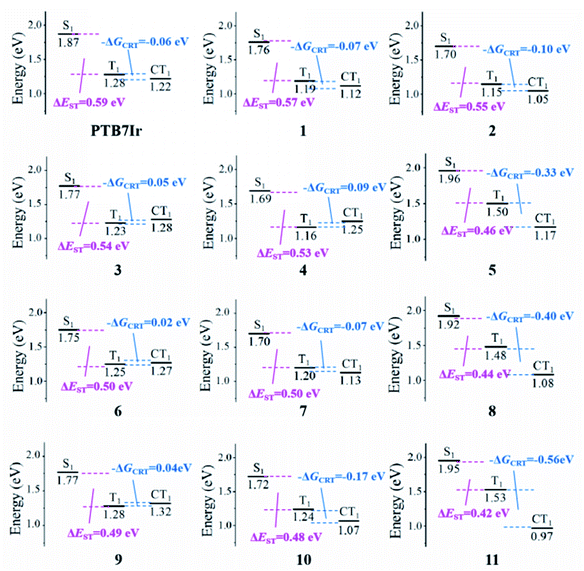
In T-OPVs, photoconversion channel that we are mainly concerned about is the CRT process, which can be estimated from the state diagram with measured/calculated relative energetic positions of S1 and T1 on the donor material and the CT1 at the D/A interface.13,45 Therefore, our discussion focuses on energy levels of S1, T1 and CT1 rather than higher excited states. When −ΔGCRT < 0, the 3CT excitons from T1 or/and 1CT from S1 excitons would diffuse toward D/A interface to dissociate into separated charges.21 Therefore, the ISC process from S1 to T1 need to be promoted to obtain more long-lived 3CT excitons. It is widely accepted that a large spin–orbit coupling (SOC) and a small energy difference between S1 and T1 states (ΔEST) will lead to a fast ISC process. However, the SOC calculation of large systems is a difficult challenge need to be overcome. Fortunately, Brédas and co-workers have reported that the SOC matrix element can be qualitatively evaluated by estimating the changes in π-conjugation of either hole or electron wave functions between the singlet and triplet excited states, which is in accord with El-Sayed rule.46 Therefore, the natural transition orbital (NTO) analyses for S1 and T1 were performed to examine the nature of the excited states and qualitatively evaluated SOC. Taking the NTOs of PTB7Ir and 4 molecules as examples (see Fig. 6), for PTB7Ir molecule, an obvious local excitation (LE) within the middle three BDT and F-TT units appears in both S1 and T1 states, which will lead to a small SOC; for 4 molecule, besides the LE character within organic acceptor units, a clear CT character from middle two BDT donor units to organic acceptor units also occurs in the S1 state because of the spatial separation of LUMO wave function, while only LE character appears in the T1 state, consequently, 4 molecule will exhibit a lager SOC value than PTB7Ir due to the change in π-conjugation between S1 and T1 states. Turning to 1–3, 6, and 9, a predominant LE character are presented in S1 and T1 states (see Fig. S4†). For 5, 7, 8, 10 and 11, the LE and CT characters are both observed in S1 states in addition to a LE character for their T1 states. As a result, designed 4, 5, 7, 8, 10 and 11 may give the lager SOC values than others. Note that, Ir metal centers of the designed terpolymers are not involved at both S1 and T1 states, indicating that the SOC mainly comes from the organic parts of terpolymer systems.Additionally, the energy difference between S1 and T1 states (ΔEST) values were calculated to evaluate ISC process of all systems from S1 to T1 states. The calculated ΔEST values are summarized in Table 2, respectively. It shows that ΔEST values of all designed molecules are smaller than that of PTB7Ir. Obviously, the ΔEST of 5 and 8–11 are below the value of 0.5 eV, indicating that their ISC process could be promoted to form more long-lived 3CT exciton. Unfortunately, the ΔEST values of all systems are still quite large, which will be further reduced in future. Consequently, designed 5, 8, 10 and 11 exhibit larger SOC affinity and smaller ΔEST values than those of PTB7Ir, which will promote their ISC process from S1 to T1 states and the formation of 3CT exciton.
| PTB7Ir | 1 | 2 | 3 | 4 | 5 | 6 | 7 | 8 | 9 | 10 | 11 | |
|---|---|---|---|---|---|---|---|---|---|---|---|---|
| S1/eV | 1.87 | 1.76 | 1.70 | 1.77 | 1.69 | 1.96 | 1.75 | 1.70 | 1.92 | 1.77 | 1.72 | 1.95 |
| T1/eV | 1.28 | 1.19 | 1.15 | 1.23 | 1.16 | 1.50 | 1.25 | 1.20 | 1.48 | 1.28 | 1.24 | 1.53 |
| ΔEST1/eV | 0.59 | 0.57 | 0.55 | 0.54 | 0.53 | 0.46 | 0.50 | 0.50 | 0.44 | 0.49 | 0.48 | 0.42 |
3.5 Intermolecular charge transfer
The calculated energy level values of CT1, ECoul and −ΔGCRT for all systems were summarized in Table 3, and energy diagrams of various states were presented in Fig. 9. As shown, the −ΔGCRT values are found to be in the order of 4 > 3 > 9 > 6 > PTB7Ir > 1 = 7 > 2 > 10 > 5 > 8 > 11. The result indicates that, compared with PTB7Ir, designed 1, 2, 4, 5, 7, 8, 10 and 11 exhibit smaller −ΔGCRT values due to the twist donor backbones. Especially, the −ΔGCRT values of 5, 8, 10 and 11 are less than −0.1 eV, thus leading to the suppressed CRT process. Here, the value “−0.1 eV” is considered as the minimum −ΔGCRT, which can give rise to the CRT process.45 As a result, we infer that designed 10 will be a promising terpolymer donor for high-performance T-OPVs because of its broad and red-shifted absorption and suppressed CRT process at D/A interface.
| PTB7Ir | 1 | 2 | 3 | 4 | 5 | 6 | 7 | 8 | 9 | 10 | 11 | |
|---|---|---|---|---|---|---|---|---|---|---|---|---|
| ECoul/eV | −0.19 | −0.09 | −0.30 | −0.15 | −0.04 | −0.43 | −0.16 | −0.19 | −0.54 | −0.18 | −0.29 | −0.69 |
| ECT1/eV | 1.22 | 1.12 | 1.05 | 1.28 | 1.25 | 1.17 | 1.27 | 1.13 | 1.08 | 1.32 | 1.07 | 0.97 |
| −ΔGCRT/eV | −0.06 | −0.07 | −0.10 | 0.05 | 0.09 | −0.33 | 0.02 | −0.07 | −0.40 | 0.04 | −0.17 | −0.56 |
4. Conclusions
To summarize, motivated by the consideration of increasing the efficiency of photocurrent generation of T-OPVs, eleven terpolymer donors have been designed and characterized based on PTB7Ir using DFT and TD-DFT methods. Compared to reported PTB7Ir, the designed 3, 4, 6, 7, 9 and 10 present broader and red-shifted absorption in the low-energy region of the solar spectrum, which contribute to capture more photons to enhance the photocurrent. Moreover, designed 5, 8, 10 and 11 show larger SOC affinity and smaller ΔEST values than those of PTB7Ir, which will promote their ISC process from S1 to T1 states and the formation of 3CT exciton. Significantly, the −ΔGCRT values of designed 5, 8, 10 and 11 are less than −0.1 eV, which can effectively suppress CRT process at the D/A interface. Consequently, the designed 10 possess enhanced light absorption, larger SOC affinity, smaller ΔEST and −ΔGCRT values, which will be a promising candidate for terpolymer donors in high-performance T-OPVs. Meanwhile, the results manifest that the proper twist angles in terpolymer backbones could prevent the CRT process to achieve a balanced combination of charge separation, transport and collection, and further improve photovoltaic performance. Furthermore, an effective and integrated method to predict terpolymer donors embedded with metal complexes of T-OPVs is described systematically.Author contributions
S. Li conceived the research and wrote the original draft. S. Li, Y. Chen, Z. Li, and J. Zhang performed the calculation. J. Chen, Y. Geng and Z. Su directed the research. All the authors contributed to the discussions, reviewing and editing.Conflicts of interest
There are no conflicts to declare.Acknowledgements
The authors gratefully acknowledge financial support from Science and Technology Project of Jilin Education Department (JJKH20200239KJ), the Fundamental Research Funds for the Central Universities (2412018ZD006), Natural Science Foundation of Jilin Province (YDZJ202101ZYTS029) and Special Training Project for Outstanding Young Talents of Jilin City (20210103092).Notes and references
- K. Jiang, J. Zhang, Z. Peng, F. Lin, S. Wu, Z. Li, Y. Chen, H. Yan, H. Ade, Z. Zhu and A. K. Y. Jen, Nat. Commun., 2021, 12, 468 CrossRef CAS PubMed.
- L. Zhu, M. Zhang, W. Zhong, S. Leng, G. Zhou, Y. Zou, X. Su, H. Ding, P. Gu, F. Liu and Y. Zhang, Energy Environ. Sci., 2021, 14, 4341–4357 RSC.
- M. Jeong, J. Oh, Y. Cho, B. Lee, S. Jeong, S. M. Lee, S.-H. Kang and C. Yang, Adv. Funct. Mater., 2021, 202102371 Search PubMed.
- G. J. Hedley, A. Ruseckas and I. D. W. Samuel, Chem. Rev., 2017, 117, 796–837 CrossRef CAS PubMed.
- K. A. Mazzio and C. K. Luscombe, Chem. Soc. Rev., 2015, 44, 78–90 RSC.
- Y. Cui, H. Yao, J. Zhang, K. Xian, T. Zhang, L. Hong, Y. Wang, Y. Xu, K. Ma, C. An, C. He, Z. Wei, F. Gao and J. Hou, Adv. Mater., 2020, 32, 1908205 CrossRef CAS PubMed.
- L. Liu, S. Chen, Y. Qu, X. Gao, L. Han, Z. Lin, L. Yang, W. Wang, N. Zheng, Y. Liang, Y. Tan, H. Xia and F. He, Adv. Mater., 2021, 2101279 CrossRef CAS PubMed.
- F. Liu, L. Zhou, W. Liu, Z. Zhou, Q. Yue, W. Zheng, R. Sun, W. Liu, S. Xu, H. Fan, L. Feng, Y. Yi, W. Zhang and X. Zhu, Adv. Mater., 2021, 33, 2100830 CrossRef CAS PubMed.
- Y. Cai, Y. Li, R. Wang, H. Wu, Z. Chen, J. Zhang, Z. Ma, X. Hao, Y. Zhao, C. Zhang, F. Huang and Y. Sun, Adv. Mater., 2021, 2101733 CrossRef CAS PubMed.
- X.-K. Chen and J.-L. Brédas, Adv. Energy Mater., 2018, 8, 1702227 CrossRef.
- C.-M. Yang, C.-H. Wu, H.-H. Liao, K.-Y. Lai, H.-P. Cheng, S.-F. Horng, H.-F. Meng and J.-T. Shy, Appl. Phys. Lett., 2007, 90, 133509 CrossRef.
- M. Qian, R. Zhang, J. Hao, W. Zhang, Q. Zhang, J. Wang, Y. Tao, S. Chen, J. Fang and W. Huang, Adv. Mater., 2015, 27, 3546–3552 CrossRef CAS PubMed.
- D. Veldman, S. C. J. Meskers and R. A. J. Janssen, Adv. Funct. Mater., 2009, 19, 1939–1948 CrossRef CAS.
- T. Basel, U. Huynh, T. Zheng, T. Xu, L. Yu and Z. V. Vardeny, Adv. Funct. Mater., 2015, 25, 1895–1902 CrossRef CAS.
- Y. Shao and Y. Yang, Adv. Mater., 2005, 17, 2841–2844 CrossRef CAS.
- J. Mei, K. Ogawa, Y.-G. Kim, N. C. Heston, D. J. Arenas, Z. Nasrollahi, T. D. McCarley, D. B. Tanner, J. R. Reynolds and K. S. Schanze, ACS Appl. Mater. Interfaces, 2009, 1, 150–161 CrossRef CAS PubMed.
- G. L. Schulz and S. Holdcroft, Chem. Mater., 2008, 20, 5351–5355 CrossRef CAS.
- S.-L. Lai, L. Wang, C. Yang, M.-Y. Chan, X. Guan, C.-C. Kwok and C.-M. Che, Adv. Funct. Mater., 2014, 24, 4655–4665 CrossRef CAS.
- Z. Wan, J. Yang, Y. Liu, S. Wang, Y. Zhong, C. Li, Z. Zhang, G. Xing, S. Huettner and Y. Tao, Polym. Chem., 2017, 8, 4729–4737 RSC.
- Z. Xue, S. Wang, J. Yang, Y. Zhong, M. Qian, C. Li, Z. Zhang, G. Xing, S. Huettner and Y. Tao, npj Flexible Electron., 2018, 2, 1–7 CrossRef CAS.
- S.-B. Li, Y. Geng and Z.-M. Su, Org. Electron., 2020, 87, 105956 CrossRef CAS.
- S.-B. Li, Y.-A. Duan, Y. Geng, H.-B. Li, J.-Z. Zhang, H.-L. Xu, M. Zhang and Z.-M. Su, Phys. Chem. Chem. Phys., 2014, 16, 25799–25808 RSC.
- Z.-W. Zhao, Q.-Q. Pan, Y. Geng, S.-X. Wu, M. Zhang, L. Zhao and Z.-M. Su, Org. Electron., 2018, 61, 46–55 CrossRef CAS.
- L.-N. Wu, M.-Y. Sui, S. Xiao, Y.-Z. Xie and G.-Y. Sun, Phys. Chem. Chem. Phys., 2020, 22, 4015–4022 RSC.
- M. J. Frisch, G. W. Trucks, H. B. Schlegel, G. E. Scuseria, M. A. Robb, J. R. Cheeseman, G. Scalmani, V. Barone, B. Mennucci, G. A. Petersson, H. Nakatsuji, M. Caricato, X. Li, H. P. Hratchian, A. F. Izmaylov, J. Bloino, G. Zheng, J. L. Sonnenberg, M. Hada, M. Ehara, K. Toyota, R. Fukuda, J. Hasegawa, M. Ishida, T. Nakajima, Y. Honda, O. Kitao, H. Nakai, T. Vreven, J. A. Montgomery Jr, J. E. Peralta, F. Ogliaro, M. Bearpark, J. J. Heyd, E. Brothers, K. N. Kudin, V. N. Staroverov, R. Kobayashi, J. Normand, K. Raghavachari, A. Rendell, J. C. Burant, S. S. Iyengar, J. Tomasi, M. Cossi, N. Rega, J. M. Millam, M. Klene, J. E. Knox, J. B. Cross, V. Bakken, C. Adamo, J. Jaramillo, R. Gomperts, R. E. Stratmann, O. Yazyev, A. J. Austin, R. Cammi, C. Pomelli, J. W. Ochterski, R. L. Martin, K. Morokuma, V. G. Zakrzewski, G. A. Voth, P. Salvador, J. J. Dannenberg, S. Dapprich, A. D. Daniels, O. Farkas, J. B. Foresman, J. V. Ortiz, J. Cioslowski and G. D. J. Fox, Revision A.02, Gaussian, Inc., Wallingford CT, 2009 Search PubMed.
- A. Perrier, F. Maurel and D. Jacquemin, Acc. Chem. Res., 2012, 45, 1173–1182 CrossRef CAS PubMed.
- C. Adamo and D. Jacquemin, Chem. Soc. Rev., 2013, 42, 845–856 RSC.
- C. Leng, H. Qin, Y. Si and Y. Zhao, J. Phys. Chem. C, 2014, 118, 1843–1855 CrossRef CAS.
- T. Yanai, D. P. Tew and N. C. Handy, Chem. Phys. Lett., 2004, 393, 51–57 CrossRef CAS.
- Y. Z. Li, T. Pullerits, M. Y. Zhao and M. T. Sun, J. Phys. Chem. C, 2011, 115, 21865–21873 CrossRef CAS.
- I. Ciofini, T. Le Bahers, C. Adamo, F. Odobel and D. Jacquemin, J. Phys. Chem. C, 2012, 116, 11946–11955 CrossRef CAS.
- D. Jacquemin, T. L. Bahers, C. Adamo and I. Ciofini, Phys. Chem. Chem. Phys., 2012, 14, 5383–5388 RSC.
- T. Lu and F. Chen, J. Comput. Chem., 2012, 33, 580–592 CrossRef CAS PubMed.
- T. Lu, Multiwfn, Version 3.3.8, A Multifunctional Wavefunction Analyzer, available at, https://multiwfn.codeplex.com Search PubMed.
- C. Risko, M. D. McGehee and J.-L. Bredas, Chem. Sci., 2011, 2, 1200–1218 RSC.
- Y. Li, Acc. Chem. Res., 2012, 45, 723–733 CrossRef CAS PubMed.
- L. Zhang, K. Pei, M. Yu, Y. Huang, H. Zhao, M. Zeng, Y. Wang and J. Gao, J. Phys. Chem. C, 2012, 116, 26154–26161 CrossRef CAS.
- H.-Y. Chen, J. Hou, S. Zhang, Y. Liang, G. Yang, Y. Yang, L. Yu, Y. Wu and G. Li, Nat. Photonics, 2009, 3, 649–653 CrossRef CAS.
- S. D. Dimitrov and J. R. Durrant, Chem. Mater., 2013, 26, 616–630 CrossRef.
- B.-G. Kim, X. Ma, C. Chen, Y. Ie, E. W. Coir, H. Hashemi, Y. Aso, P. F. Green, J. Kieffer and J. Kim, Adv. Funct. Mater., 2013, 23, 439–445 CrossRef CAS.
- D. Mühlbacher, M. Scharber, M. Morana, Z. Zhu, D. Waller, R. Gaudiana and C. Brabec, Adv. Mater., 2006, 18, 2884–2889 CrossRef.
- G. D. Sharma, P. Balraju, J. A. Mikroyannidis and M. M. Stylianakis, Sol. Energy Mater. Sol. Cells, 2009, 93, 2025–2028 CrossRef CAS.
- J. A. Mikroyannidis, S. S. Sharma, Y. K. Vijay and G. D. Sharma, ACS Appl. Mater. Interfaces, 2009, 2, 270–278 CrossRef.
- S.-C. Yiu, P.-Y. Ho, Y.-Y. Kwok, X. He, Y. Wang, W.-H. Yu, C.-L. Ho and S. Huang, Chem.–Eur. J., 2022 DOI:10.1002/chem.202104575.
- D. Niedzialek, I. Duchemin, T. B. de Queiroz, S. Osella, A. Rao, R. Friend, X. Blase, S. Kümmel and D. Beljonne, Adv. Funct. Mater., 2015, 25, 1972–1984 CrossRef CAS.
- P. K. Samanta, D. Kim, V. Coropceanu and J.-L. Brédas, J. Am. Chem. Soc., 2017, 139, 4042–4051 CrossRef CAS PubMed.
- Y. L. Lin, M. A. Fusella and B. P. Rand, Adv. Energy Mater., 2018, 8, 1702816 CrossRef.
- X. Liu, R. He, W. Shen and M. Li, J. Power Sources, 2014, 245, 217–223 CrossRef CAS.
- B. Yang, Y. Yi, C. Zhang, S. G. Aziz, V. Coropceanu and J. Brédas, J. Phys. Chem. C, 2014, 118, 27648–27656 CrossRef CAS.
- C. Keavney, R. Walters and P. Drevinsky, J. Appl. Phys., 1993, 73, 60–70 CrossRef CAS.
- C.-S. Jiang, H. Moutinho, D. Friedman, J. Geisz and M. Al-Jassim, J. Appl. Phys., 2003, 93, 10035–10040 CrossRef CAS.
- T. Stein, L. Kronik and R. Baer, J. Am. Chem. Soc., 2009, 131, 2818–2820 CrossRef CAS PubMed.
- X. Zhang, L. Chi, S. Ji, Y. Wu, P. Song, K. Han, H. Guo, T. D. James and J. Zhao, J. Am. Chem. Soc., 2009, 131, 17452–17463 CrossRef CAS PubMed.
- I. Constantinou, X. Yi, N. T. Shewmon, E. D. Klump, C. Peng, S. Garakyaraghi, C. K. Lo, J. R. Reynolds, F. N. Castellano and F. So, Adv. Energy Mater., 2017, 7, 1601947 CrossRef.
Footnote |
| † Electronic supplementary information (ESI) available: A comparative analysis of intermolecular charge transfer properties of PTB7Ir/PC71BM based on the ground-state geometries calculated by PBE0 and PBE0-D2 functionals, respectively. The plots of schematic illustration of twist angles between donor and acceptor moieties of 2 and 6–11, and hole–electron pairs of NTOs in S1 and T1 states of 1–3 and 5–11. The tables of HOMO energy levels (EHOMO) calculated using B3LYP functional, and the vertical excitation energies (Eg), oscillator strengths (f) and excitation characters of S1 states calculated at the B3LYP/6-31G(d) (LANL2DZ for Ir atom) level in o-dichlorobenzene solvent for PTB7Ir and 1–11 molecules. Tables of coordinates of molecules. See DOI: 10.1039/d2ra00033d |
| This journal is © The Royal Society of Chemistry 2022 |

