
 Open Access Article
 This Open Access Article is licensed under a Creative Commons Attribution-Non Commercial 3.0 Unported Licence
Label-free focusing of viral particles under a temperature gradient coupled with continuous swirling flow†
Danli Luo‡
a,
Chao Zhao‡ a,
Guanyang Xue‡b,
Zhibo Caoa,
Alparslan Oztekinb and
Xuanhong Cheng*ac
a,
Guanyang Xue‡b,
Zhibo Caoa,
Alparslan Oztekinb and
Xuanhong Cheng*ac
aDepartment of Materials Science and Engineering, Lehigh University, Bethlehem, PA 18015, USA. E-mail: xuc207@lehigh.edu
bDepartment of Mechanical Engineering and Mechanics, Lehigh University, Bethlehem, PA 18015, USA
cDepartment of Bioengineering, Lehigh University, Bethlehem, PA 18015, USA
First published on 2nd February 2022
Abstract
The advances of biomedicine and biotechnology demand new approaches to enrich biological nanoparticles, such as viruses, viral vectors and nanovesicles, in an easy-to-operate fashion. Conventional methods, such as ultracentrifugation and ultrafiltration, require bulky instruments and extensive manual operation. Inspired by recent research of thermophoresis of biomolecules and bio-nanoparticles in aqueous solutions, we present a microfluidic design that directly focuses nanoparticles in a label-free and flow-through process by coupling an engineered swirling flow and a moderate, one-dimensional temperature gradient. Enrichment of polystyrene particles, HIV and bacteriophage samples was quantitatively determined, indicating the compatibility of the microfluidic approach with synthetic and biological samples. The focusing results are well predicted using a numerical model. As thermophoresis is ubiquitous, the microfluidic approach can be applied broadly to bio-nanoparticle enrichment without the necessity of labeling, buffer exchange, or sheath fluids, permitting continuous retrieval of concentrated species in a simple, controlled flow with little infrastructure needs.
Introduction
Bio-nanoparticles, such as viruses, viral vectors, and nanovesicles, are frequently processed as the targets for nanomedicine development, clinical diagnosis, environmental surveillance, and drug and food safety monitoring. Enriching these particles is a critical step towards their detection and downstream applications. For example, the enrichment of viruses and lipid nanoparticles is particularly pertinent during the COVID-19 pandemic to the monitoring of environmental presence of SARS-CoV-2, diagnosis of infected individuals and development of nanomaterial-based vaccines.1–3 While conventional methods, such as high-speed centrifugation, membrane ultrafiltration, and chromatography, are well established and widely adopted, these batch processes often have variable recovery, especially with small sample volumes, dependent on the sample composition, operators' experience, and separation mechanisms. They also require bulky instruments, skilled operators and a long processing time. In addition, aggregation is frequently encountered in the formation of pellets or cakes, which requires sample re-dispersion and often leads to the inactivation of biological species. Recently, affinity-labeled magnetic particles have gained popularity to separate viruses and nano-vesicles due to the fast speed and simple setup.4 However, the utility is limited to species with known surface markers to allow affinity tagging, and the labeling of magnetic beads may interfere with downstream applications.In the past few decades, microfluidics employing various fields and microstructures have demonstrated outstanding potential as lab-on-a-chip platforms to separate cells and nanoparticles of biological origins.5–7 These devices employ various mechanisms, including dielectrophoresis, acoustophoresis, the gravitational force, magnetic field, optical tweezers, and inertial effects to enrich biological species, especially cells. However, these approaches are often challenged when applied to processing bio-nanoparticles due to the robust Brownian motion of the target species. Nonetheless, several recent works have demonstrated the separation of submicron particles in microfluidic devices7–10 using electrical,11–14 chemical,15 and acoustic fields16 as well as hydrodynamic forces.17,18 Many of these achieve nanoparticle separation indirectly by deflecting contaminants of larger sizes to the waste stream because of weak forces on the bio-nanoparticles. In addition, the requirements of special buffers and complex devices and the generation of significant heat in some technologies limit their wide adoption for biological sample processing. Separately, devices incorporating nanomaterials and membranes for size-based separation are prone to clogging.19,20 Immunoaffinity separation, although enabling target enrichment with biomarker specificity, requires a known surface ligand of the target and/or sample labelling.21,22
Recently, several investigations suggest the temperature gradient as an influential driving force to manipulate the motion of nanoparticles23 and macromolecules24,25 in aqueous solutions. Numerous studies suggest that the force induced by a thermal field has a much weaker dependence on the particle size26 than body forces employed in dielectrophoresis, acoustophoresis, and inertial focusing do; thus, significant directional motion can be generated to overcome the random Brownian motion of nanoparticles in a solution. The directional drift of small particles and molecules in a solution under a temperature gradient, called thermophoresis or thermodiffusion, has long been realized as a ubiquitous phenomenon in nature.27–29 Thermodiffusion was investigated to enrich isotopes and gas species decades ago,30,31 and thermal field flow fractionation (TFFF) has been developed commercially for the separation and analysis of gas and polymer molecules as well as colloid particles.32 Thermally driven crowding of macromolecules and colloid particles in aqueous solutions has been studied much more recently.33,34 While the mechanism is debatable, many believe thermophoresis in aqueous solutions results from anisotropic interfacial stresses due to the inhomogeneous electric double layer and hydration entropy in a temperature field.24,35–37 In addition to applications in separation, thermophoresis has been unitized to characterize receptor–ligand binding,38,39 assemble colloids and molecules40 and manipulate particles.41,42 Thermophoretic enrichment of salt, nucleotides and proteins has been hypothesized as a mechanism for prebiotic molecules to accumulate and to support the molecular evolution of life.43–46 The last two decades have witnessed several implementations of thermophoresis in microdevices,42,47–49 the small dimension of which allows the establishment of a strong temperature gradient to drive easily-measurable migration of various species.
The separation and enrichment effect driven by a temperature gradient is greatly enhanced by coupling it with a swirling flow.45 This coupling has been shown to cause extreme DNA accumulation in hydrothermal pores44 and isotope enrichment in thermogravitational columns (Fig. 1a).31 In both cases, the temperature gradient across a thin slit induces thermophoresis of target species and promotes accumulation on one side of the slit. At the same time, the temperature field generates a natural convection roll to sweep along the accumulation wall, establishing a corner with a high concentration, which could be tapped to retrieve the target species. Thermophoresis resists recirculation and diffusion out of the corner, leading to exponential decay of the concentration from the accumulation center to the bulk at the steady state. Alternatively, coupled thermophoresis and swirling have been achieved by infrared laser heating to promote molecular enrichment.39,50 These prior foundational works, nonetheless, are almost exclusively based on batch processes that are slow and difficult to scale up. Additionally, using the temperature gradient to drive both thermophoresis and fluid swirling makes it challenging to control the two transport actions and optimize their coupling independently.
 | ||
| Fig. 1 Devices coupling thermophoresis and swirling convection to enrich nanoparticles. (a) Structure and transport processes in a thermogravitational column. Nanoparticles are focused to the bottom right corner of the column (left panel) due to the coupled transport of thermophoresis and a natural convection roll (right panel), both induced by the horizontal temperature gradient. The left panel is from numerical simulation using the physical properties of 100 nm polystyrene particles, and the green intensity corresponds to local concentration. Both horizontal and vertical scale bars are 50 μm. The total column height is 1 mm. (b) A photograph and (c) schematic of the microfluidic device used in this work. The device takes an unprocessed biological sample as the input and focuses nanoparticles to one side in a simple flow-through process, without sample labelling or sheath fluid. The inset shows the detailed geometrical parameters in the microchannel, including groove width (w), height (h), spacing (s), tilting angle (θ), and channel thickness (H). All length units are in μm unless noted otherwise. The schematic depicts the device orientation for experiments where samples were retrieved and analysed off chip, while the heat source and sink were reversed to facilitate in situ imaging in Fig. 2. (d) The transport processes in the microfluidic channel. The transport processes in the cross-sectional plane, thermophoresis and an engineered swirl, resemble those in the thermogravitational column. The axial flow allows nanoparticles to gradually focus from the inlet to the outlet, facilitating continuous retrieval of the enriched target species. | ||
Inspired by the physical principle of the thermogravitational column, we create a microfluidic device (Fig. 1b and c) in which an engineered 3D swirling flow is coupled with a temperature gradient to focus nanoparticles sideways along with an axial flow.51 In the transverse plane normal to the flow axis, convective swirling and thermophoresis are coupled similarly to those in the thermogravitational column (Fig. 1d), promoting nanoparticle accumulation in a corner. In the presence of a continuous axial flow in the device, gradual focusing of nanoparticles occurs as the sample moves towards the outlet. The concentrated species are retrieved continuously from a strategically positioned side outlet, contrasting the accumulation in the column that occurs with time in a batch process. Since migration under a temperature gradient is intrinsic to all solvated species, no labelling or sheath fluid is required in this continuous focusing process, and no buffer exchange is needed for biological samples. Here, we present the feasibility of this device for nanoparticle focusing and demonstrate its utility in virus enrichment. A numerical model is used in parallel to predict the device's performance and guide its operation.
Results and discussion
Transport processes and the mechanism of nanoparticle enrichment
In response to a temperature gradient, nanoparticles dispersed in a suspension display a steady drift velocity vT, which is calculated as the product of thermal diffusion coefficient DT and the temperature gradient ∇T, i.e., vT = DT∇T. Depending on the sign of DT, the particles migrate either to the cold (positive DT, thermophobic) or warm (negative DT, thermophilic) side. To achieve a considerable value of vT, a strong temperature gradient is desirable, and it is usually generated by applying a temperature differential across a narrow gap. As thermophoretic species migrate to and accumulate at one side of the gap, normal diffusion degrades the accumulation with a diffusivity D. At the steady state, a concentration gradient is established across the gap, which drops exponentially from the accumulation wall to the depletion wall (Fig. 2a right image) by a decay constant proportional to . This ratio
  is defined as ST, the Soret coefficient, which characterizes the migration potential of a species in a thermal field, and it is sensitive to both the particle and environmental properties. Such a concentration gradient, however, usually has a limited magnitude due to counteracting diffusion of nano-species. Moreover, the narrow gap also hinders retrieval of enriched species from the accumulation wall due to the spatial constraint.
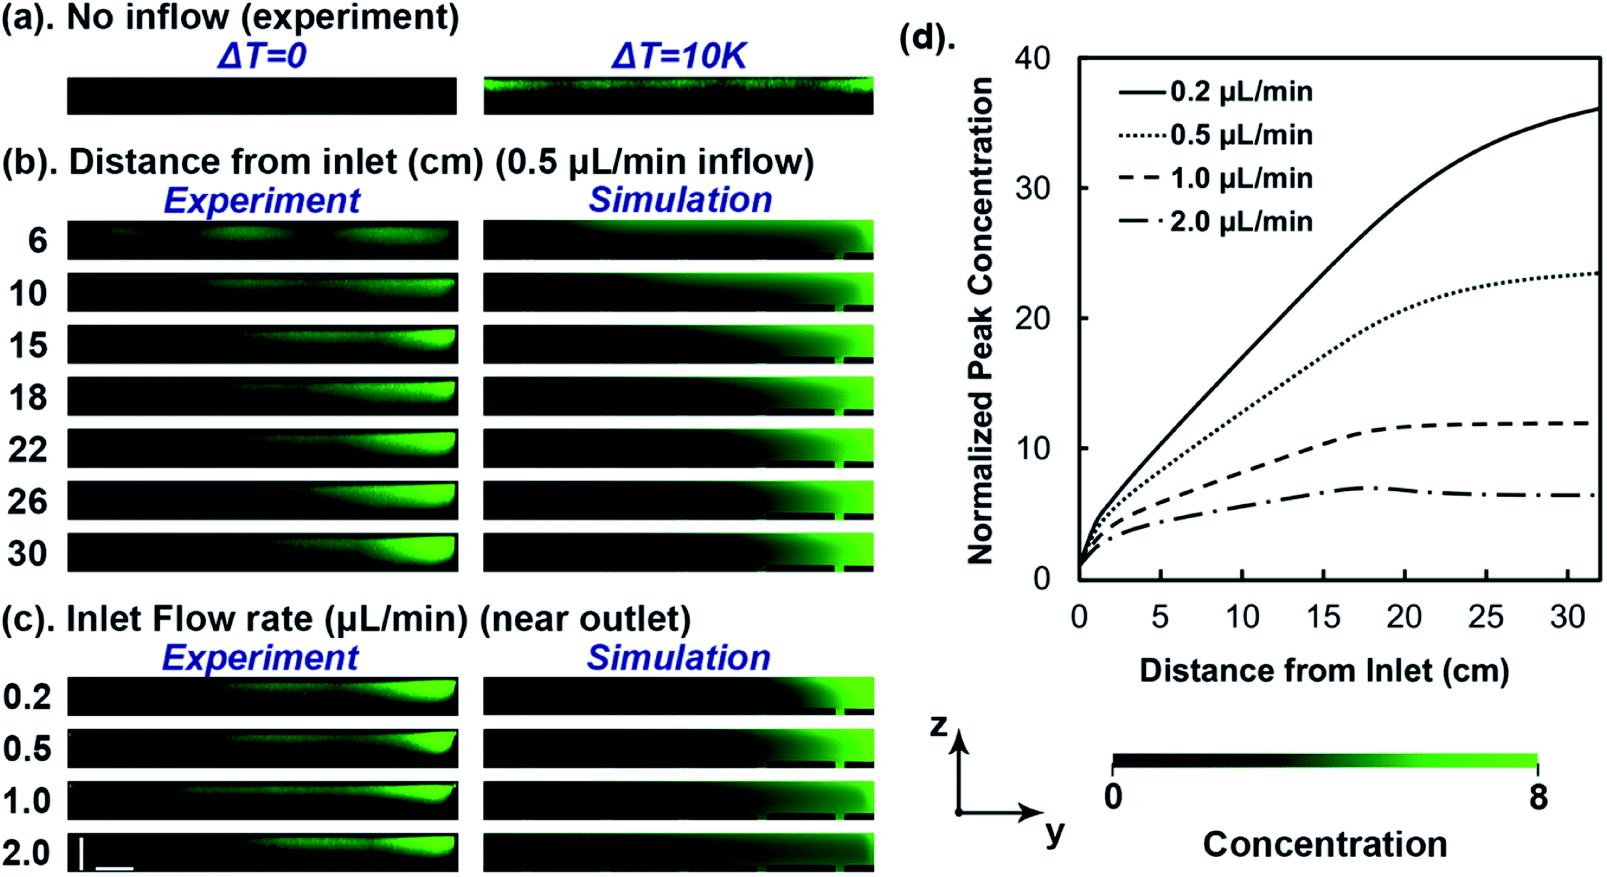 | ||
| Fig. 2 Steady-state distribution and peak concentration of 100 nm polystyrene particles in cross-sectional planes (y–z planes) normal to the axial flow. An estimated temperature difference of 10 °C was applied across the thickness of the main channel in all images except for the left panel of (a). The direction of the temperature gradient points up. (a) Confocal images of nanoparticle distribution in the y–z plane of a channel at room temperature (left) or with a temperature gradient in the z-direction (right). The sample suspension is static in the channel. (b) Nanoparticle distribution in y–z planes of different distances from the inlet. The sample flow rate was 0.5 μL min−1. The gradual accumulation of fluorescent nanoparticles is visible around the top right corner. (c) Nanoparticle distribution in response to different flow rates at the same y–z plane near the outlet. The left panels in (b) and (c) are confocal images, and the right panels are from simulations (with input concentration defined as 1). The horizontal scale bar is 80 μm and the vertical scale bar is 50 μm. Note that the fluorescent images provide a visual presentation of the particle enrichment, but the intensity was not calibrated to quantify the particle concentration. (d) Development of peak nanoparticle concentration in the y–z plane along the x-axis (axial flow direction) with different sample flow rates from numerical analysis. The peak concentration in each y–z plane was normalized to the input concentration. | ||
The accumulation is significantly enhanced if a swirling flow in the gap sweeps the nanoparticles to a corner. An analytical solution in a two-dimensional device comprised of a linear temperature gradient and one natural convection roll, e.g., a simplified model of the thermogravitational column (Fig. 1a), indicates an exponential enhancement of mass accumulation, scaling with the aspect ratio of the column.52 Inspired by the mechanism, we use shallow, slanted microgrooves to generate a gentle swirling flow (Fig. S4a and b†)53 in a thermophoretic microfluidic channel (Fig. 1b–d). In the transverse plane, the transport processes mimic those in the thermogravitational column to promote particle focusing to a corner. Unique to the microfluidic design, a continuous axial flow is present, along which nanoparticles advance towards the outlet while focusing gradually in the span-wise direction. Thus, the process of nanoparticle accumulation is transformed from the temporal domain in a thermogravitational column to the spatial domain in the microfluidic channel, enabling continuous sample processing and target particle retrieval from a side outlet.
In this work, a temperature gradient is established by sandwiching the microfluidic device between a heat sink and source. Fig. 2b demonstrates the distribution of 100 nm fluorescent polystyrene particles in the microfluidic device through confocal microscopy imaging (left panel) and numerical analysis (right panel). The images are from cross-sectional planes (y–z planes) of increasing distance from the inlet. Nanoparticles migrate toward the cooled ceiling (z-direction) near the inlet, driven by the temperature gradient in the channel thickness direction. As the sample continuously advances to the outlet (x-direction), the nanoparticles are swept sideways along the ceiling to the right (y-direction) by the transverse flow, resulting in a gradual increase of the fluorescence intensity around the top-right corner and growth of the accumulation zone in the cross-sections. As the side migration occurs gradually along with the axial flow, a long microfluidic channel of 32 cm was designed, which was confirmed by the simulation to allow the concentration distribution of tested particles to approach fully developed profiles around the optimal flow rates (Fig. 2d).
Since the magnitude of the swirl is controlled by the groove structure and flow condition in the microfluidic channel, thermophoresis and convective sweeping are independently adjusted, allowing optimization of their coupling. This contrasts the thermogravitational column in which the temperature gradient controls both thermophoresis and natural convection. With a fixed device geometry and temperature gradient in the microfluidic channel, the focusing effect is controllable by the sample flow rate. Fig. 2c displays the distribution of 100 nm polystyrene particles with different flow rates in the same y–z plane near the device outlet, obtained by confocal imaging (left panel) and numerical analysis (right panel). The most prominent accumulation is observable at 0.2 and 0.5 μL min−1, while faster flow rates lead to smaller accumulation zones and weaker fluorescence intensities around the top-right corner of the cross-sectional images. This flow rate dependence results from the transverse velocity scaling with the stream-wise flow rate (Fig. S4c†), thus faster input flow leads to stronger swirling, which disturbs the accumulation zone and promotes nanoparticle recirculation. On the other hand, when the flow rate is too slow, the accumulation could also be compromised by insufficient sideway sweeping.
While the images of the cross-sectional planes provide a visual appreciation of nanoparticle focusing, numerical simulations further allow quantitative analysis of the accumulation process. Fig. 2d demonstrates the development of peak concentration in progressive y–z planes from the inlet to the outlet obtained by numerical analysis under different flow rates. In all flow rates, the peak concentration in the y–z plane increases abruptly near the inlet due to thermophoresis-dominant transport. Further along in the channel, it goes up gradually until a plateau is reached, driven by the span-wise sweeping. The rate of increase is strongly dependent on the input flow rates. For 100 nm polystyrene particles tested here, the peak concentration close to the outlet reaches nearly 36 times the input at a flow rate of 0.2 μL min−1, or 23 times at 0.5 μL min−1.
Nanoparticle enrichment by off-chip characterization
To demonstrate the possibility to process samples continuously and retrieve enriched target species, outflows were extracted from the trifurcate outlets, and the concentration of nanoparticles was measured by UV-vis spectroscopy. The side branches retrieve 40% of the total volume (20% each), leaving 60% exits from the middle branch. The concentration and total amount of particles from Outlet 1, located on the focusing side, were further calculated and normalized to those in the input. The two resulting parameters, normalized concentration and mass yield are expected to reach maximal values of 5 folds and 100%, respectively, if all target species were retrieved from Outlet 1. A series of simulations at different flow rates were performed to compare with experimental results. As observed in Fig. 3a, Outlet 1 yields up to 90% of input polystyrene nanoparticles of 100 nm in diameter. The outflow concentration from Outlet 1 is up to 4.5 times the input in a simple flow-through process. This enrichment is achieved at a flow rate of 0.5 μL min−1, corresponding to an average axial velocity of 166.67 μm s−1. Greater or lesser flow rates lead to compromised concentration and yield from Outlet 1 experimentally. Numerical results share a similar feature of a skewed bell-shaped curve to experimental measurements, while the normalized mass flux from Outlet 1 is found to peak at a flow rate of ∼0.2 μL min−1. This mismatch is likely due to the approximation of the Soret coefficient used in the simulation (see Discussion), which the accumulation is strongly dependent on. Nonetheless, Fig. 3a verifies that 100 nm polystyrene particles are focused in the microfluidic channel, and the concentrated species are continuously retrievable from a side outlet.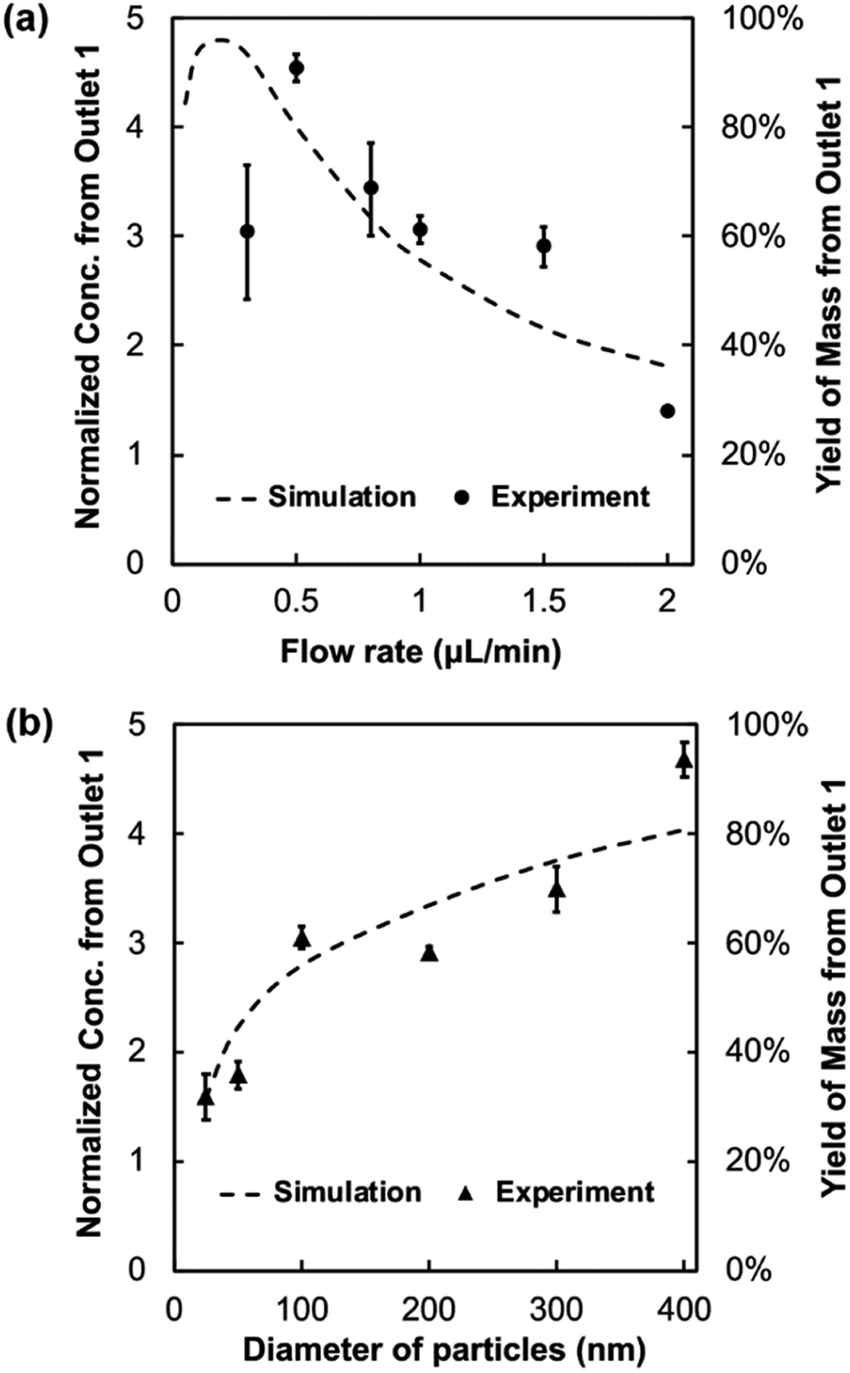 | ||
| Fig. 3 Normalized concentration and mass yield of polystyrene particles retrieved from Outlet 1, in which concentrated samples are expected. The outflow concentration was normalized to the input sample. The symbols denote the average experimental measurements and the error bars represent one standard deviation (n ≥ 3). The dash lines are from numerical analysis using the same device geometry as that used in the experiments. Outlet 1 account for 20% of the total volume eluted; thus, the greatest sample concentration is 5 times the input, and yield of mass is 100% when all nanoparticles are focused to Outlet 1. (a) Normalized concentration and mass yield of 100 nm polystyrene particles from Outlet 1 as a function of flow rates. (b) Normalized concentration as a function of nanoparticle size under the flow rate of 1.0 μL min−1. | ||
As the Soret coefficient has a particle-size dependence, we next tested focusing of polystyrene particles from 25 nm to 400 nm in diameter (Fig. 3b), using the same sample flow rate of 1 μL min−1. Overall, larger particles focus more effectively than the smaller ones, indicated both by experimental and simulation results. This is partially attributed to the increasing Soret coefficient with the particle size under otherwise similar conditions, producing more robust thermophoretic responses. Additionally, larger particles have lower diffusivity to degrade the concentration gradient. Notably, polystyrene particles down to 25 nm were observed to accumulate in the device, demonstrating the power of thermophoresis to focus nano-species directly. While the trends of particle size dependence are similar between experimental and simulation results, the slight difference between the two may reflect the deviation of actual ST from those used in the simulation (Table S1†), as further discussed below.
Enrichment of HIV particles
After validating the physical principle with synthetic particles, we further tested focusing of HIV particles in the microfluidic device. The experimental setup and outflow collection follow those used for polystyrene nanoparticle enrichment. A commercial p24 ELISA assay was used to determine the virus concentration in the three outlets, further normalized to the input concentration. With the Soret coefficient of HIV being 0.17 K−1 at room temperature and ∼20% lower than that of the 100 nm polystyrene particles, the thermophoretic mobility of HIV is expected to be slower, resulting in less effective focusing and the need for a milder flow rate to promote optimal accumulation. This is reflected as an overall reduction of the sample concentration from Outlet 1 in the numerical analysis and a shift of the concentration peak occurring at a flow rate below 0.1 μL min−1 (Fig. 4a). Experimentally, the normalized concentration from Outlet 1 decreases with the three flow rates tested, 0.3, 0.5, and 1 μL min−1, and the magnitude is consistent with the simulation prediction. Fig. 4b demonstrates an example of the concentration distribution from the three outlets at a flow rate of 0.3 μL min−1, or an average axial velocity of 100 μm s−1. The output concentration from Outlet 1 is 3.72 ± 0.23 times of the input, accounting for 74 ± 5% of the total mass on average retrieved. The other two outlets yield depleted samples, with a normalized concentration of 0.36 ± 0.07 from Outlet 2 and 0.19 ± 0.05 from Outlet 3. Numerically, the outflow concentration along the span-wise direction demonstrates an exponential decay from the focusing side to the depletion side (dash line in Fig. 4b). The three outlets, collecting 20%, 60%, and 20% of the outflow from one side to the other, exhibit a drop of the concentration profile consistent with the simulated result.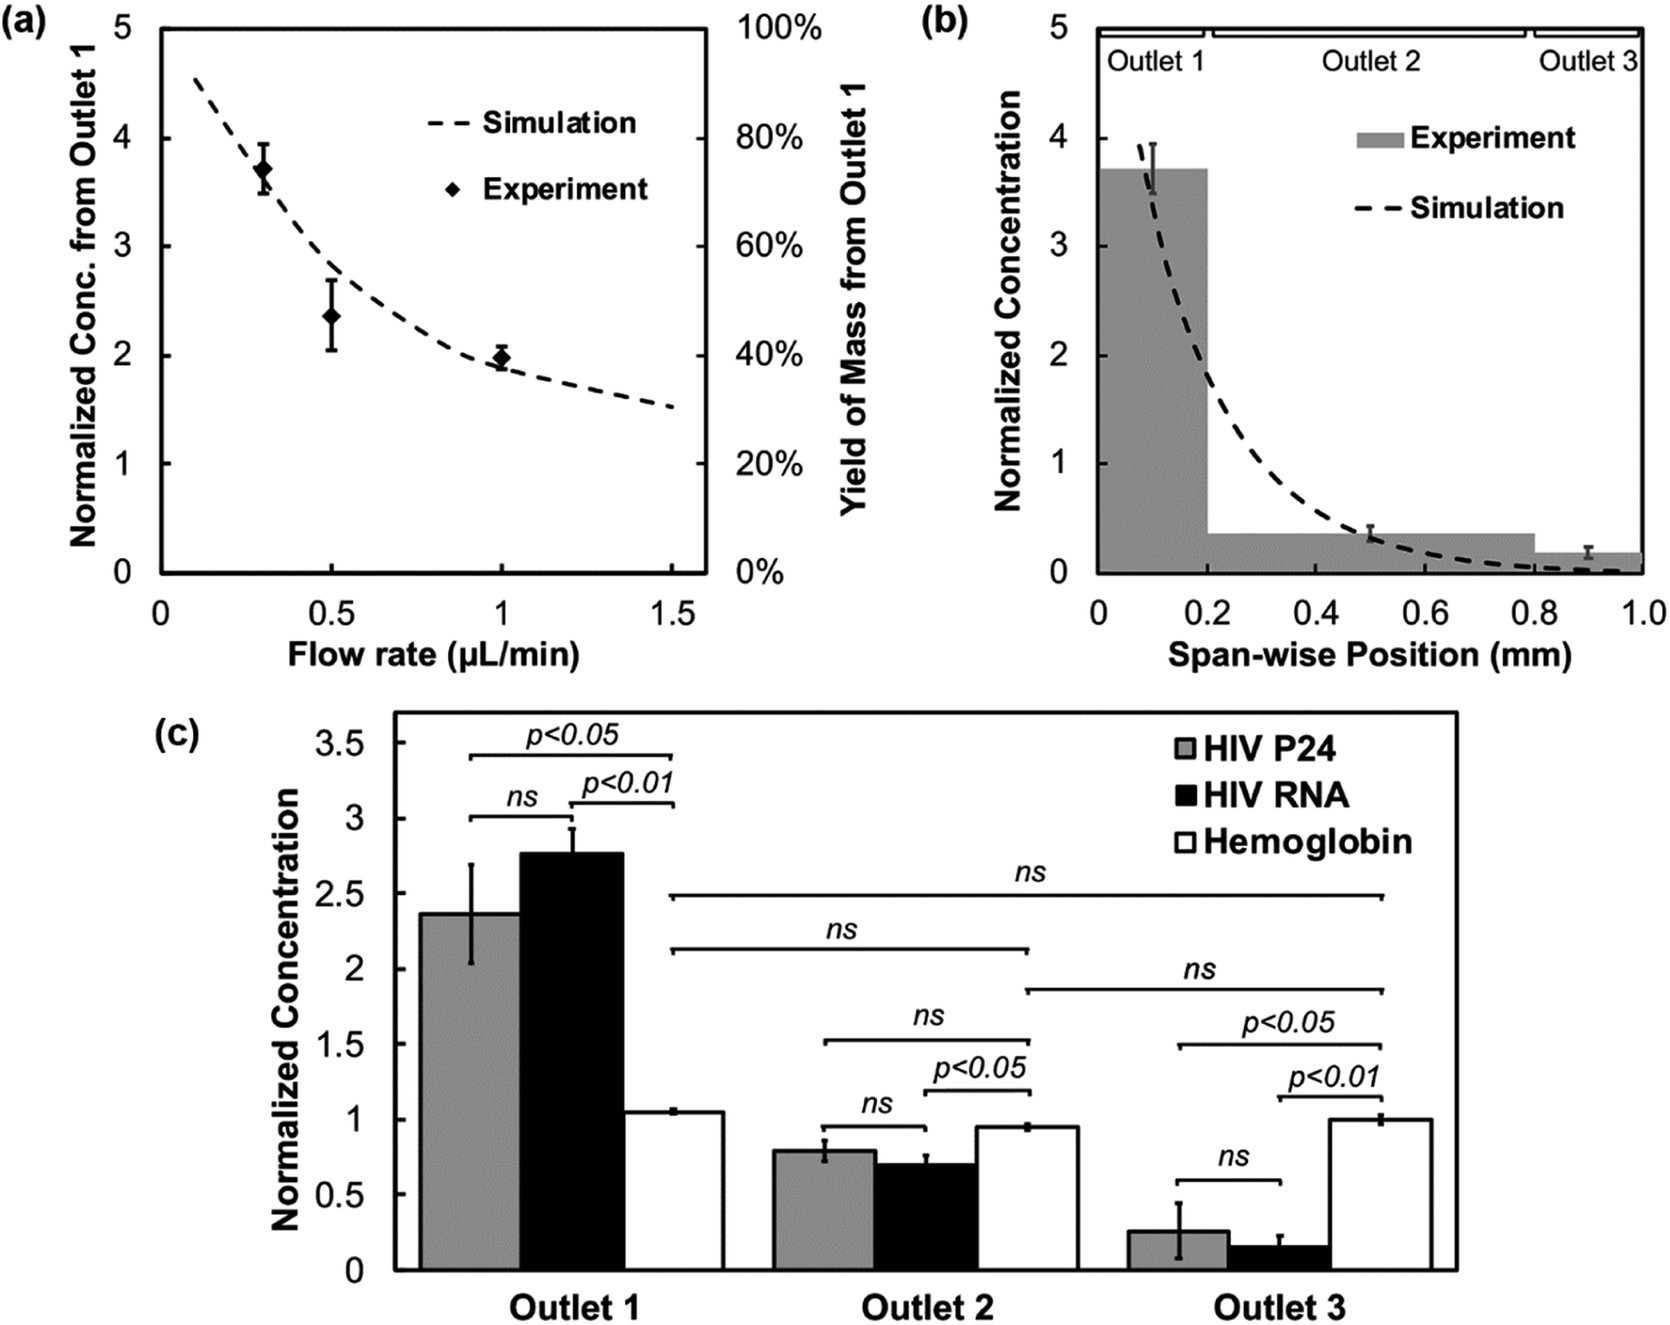 | ||
Fig. 4 Enrichment of pseudo-HIV virus retrieved from the microfluidic device. The symbols or bars denote the average experimental measurements, and the error bars represent one standard deviation (n ≥ 3). The dashed lines in (a) and (b) are numerical results. (a) Normalized concentration and virus yield retrieved from Outlet 1 as a function of the sample flow rate. The concentration of HIV virus in the input and output samples was determined by the p24 ELISA assay, and the results from Outlet 1 were normalized to the corresponding input concentration. The dashed line represents simulation-predicted mass flux vs. the flow rates. (b) Normalized virus concentration collected from the three outlets at a flow rate of 0.3 μL min−1, determined by the p24 ELISA. The widths of the bars represent the width ratio of the three outputs of 1![[thin space (1/6-em)]](https://www.rsc.org/images/entities/char_2009.gif) :3:1. The dashed line represents simulation-predicted mass flux along the span-wise direction. (c) Normalized virus concentration collected from the three outlets at a flow rate of 0.5 μL min−1, determined by the p24 ELISA and real-time RT-PCR, respectively. Also shown are the normalized concentration of hemoglobin spiked into the inflow sample and collected from the three outlets at the same flow rate. Statistical significance is noted above the bars where ns (p > 0.05) denotes no significant difference from two-tailed paired t-tests (n ≥ 3). :3:1. The dashed line represents simulation-predicted mass flux along the span-wise direction. (c) Normalized virus concentration collected from the three outlets at a flow rate of 0.5 μL min−1, determined by the p24 ELISA and real-time RT-PCR, respectively. Also shown are the normalized concentration of hemoglobin spiked into the inflow sample and collected from the three outlets at the same flow rate. Statistical significance is noted above the bars where ns (p > 0.05) denotes no significant difference from two-tailed paired t-tests (n ≥ 3). | ||
Conventional methods to concentrate virus and vesicle samples, such as centrifugation and ultrafiltration, have been reported to damage the membrane structure, leading to variable recovery yields.54 Using shallow microgrooves with large spacing in the microfluidic device, the peak transverse velocity in the main channel is only a small fraction of the axial velocity (Fig. S4c†). Thus, the flow is a creeping flow with a weak swirling characteristic, and the gentle transport is expected to cause minimal damage to fragile samples. To verify this hypothesis, the retrieved outflow from an intermediate flow rate of 0.5 μL min−1 was tested for both the HIV capsid protein p24 and RNA content using commercial ELISA and real-time RT-PCR kits, respectively. If the viral particles deteriorated in the focusing process and leaked the molecular content, the RNA and protein contents are expected to have different fractions in the three outlets, given Soret coefficients differ among viral particles, nucleic acids, and proteins.44,55 As observed in Fig. 4c, the concentration of p24 protein and viral RNA both exhibit exponential decay from Outlet 1 to Outlet 3. No significant difference is observed in the concentrations of the two viral molecules in each outlet. The focusing effect disappears when the temperature gradient is not applied. At the same time, plasma proteins, such as free hemoglobin spiked in the input, demonstrate little focusing even with the temperature gradient and have nearly identical concentrations in the three outlets. This suggests that the retrieved samples contain intact viral particles. In addition, the results support that viral particles can be enriched and purified from contaminating proteins to reduce the potential interference for downstream viral analysis. Confirmative experiments showing integrity of enriched virus are presented in the following experiments.
Enrichment and activity of bacteriophage
To further verify that the microfluidic focusing device is effective and biocompatible, bacteriophage was processed and tested for its plaques forming capability using a sample flow rate of 0.5 μL min−1. Outflow from the three outlets was mixed with the host bacterium M. smegmatis and plated on separate agar plates. For comparison, devices were operated with or without the temperature gradient, which is the driving force for nanoparticle focusing. As observed in Fig. 5, the total plaque-forming units from the three outflows are comparable between the paired devices, injected with similar input concentrations of bacteriophage. However, the distribution of phage in the outlets is drastically different. A substantial decay of the plaque number is associated with the three outflows in the focusing device with the temperature gradient (bottom panel of Fig. 5a). On the other hand, the three outflows yield a comparable number of plaques if the temperature gradient is not applied in the device to drive the focusing of bacteriophage (top panel of Fig. 5a). The normalized plaque-forming units (Fig. 5b) show no statistical difference among the three outlets without the temperature gradient. Conversely, Outlet 1 yields 3.56 ± 0.50 times of active phage with the temperature gradient than without, while Outlets 2 and 3 yield 0.44 ± 0.19 and 0.10 ± 0.07 times of the input, significantly depleted compared to the same outflow collected from devices without a temperature gradient. Thus, the focusing process based on the temperature gradient retains the activity of the biological sample. | ||
| Fig. 5 Plaque forming capability of bacteriophage retrieved from the device. (a) Images showing the number of plaques formed from the three outflow samples of a device subjected to no temperature gradient (top panel) or under a temperature gradient (bottom panel). (b) Relative plaque-forming units (PFU) from the three outlets in devices without (empty bars) and with (solid bars) the temperature gradient. The error bars represent one standard deviation, and the p-values are from two-tailed Student's t-tests (n ≥ 3). | ||
Discussion
We present a microfluidic device to focus polymer nanoparticles and viruses directly in a label-free, continuous flow, and biocompatible fashion. The focused bio-nanoparticle species are intact and active for downstream analysis and applications. Specifically, the microfluidic device uses a temperature field to drive nanoparticle accumulation and an engineered swirling flow to augment the enrichment. The separation process is predictable using a numerical model with information of the Soret coefficient of target species. Compared to centrifugation, chromatography, and filtration commonly used for virus and nano-vesicle separation, the microfluidic approach is miniaturizable and scalable, allows continuous sample processing, maintains target particles in a suspended, biologically active state, and minimizes aggregation and pelleting that contribute to variable yields.While various field-driven and field-free mechanisms have been implemented in microfluidics for physical separation of biological nanoparticles such as viruses and exosomes,7–18,56 many achieves the separation indirectly by deflecting larger contaminating species to the waste streamline.18,57 This is a result of weak migration of nanoparticles in many fields. For example, the forces employed in inertial focusing, optical tweezers, acoustophoresis, and dielectrophoresis scale with the third or higher power of particle radius,9 and the resulting motion of nanoparticles is negligible compared to random Brownian motion. On the other hand, the thermophoretic force, proportional to ST,58 is related to the power of 1–2 of the radius.26,59 This weak scaling with size leads to significant mobility of nano-species induced by a thermal field. Using typical thermophoretic mobility values23 of DT ∼10−8 cm2 s−1 K−1 and a moderate temperature gradient of ∼0.2 K μm−1 as used in this work, the thermophoretic velocity is 0.2 μm s−1, fairly significant compared to the characteristic dimension of microfluidic devices on the order of 10–100 μm. To put the values into perspective, a g-force of ∼104 × g is required to generate a similar terminal velocity of 100 nm polystyrene particles in water (relative density with respect to water ∼1.05). Using the above thermophoretic velocity value, a characteristic dimension of 100 μm for the micro-device and diffusivity of 10−11 m2 s−1 for 100 nm particles in water around room temperature, the dimensionless Peclet number for mass transport is on the order of 1. This suggests thermophoresis is able to compete with diffusion to transport nano-species. The capability to directly focus nanoparticles saves the needs of sheath or carrier fluids to confine the sample, and it enables significant nanoparticle accumulation. In fact, strong directional migration in a thermal field has long been implemented for the separation of molecules and even elements.31,60 Recently, thermophoresis has also found utility in biomolecule separation in aqueous solutions.39,44 Since thermophoretic migration is intrinsic to all solvated species, no labeling or buffer exchange is required and the operation temperature can be easily adjusted to accommodate delicate biological samples. The label-free aspect is appealing when a surface biomarker is unknown or untagged samples are desirable, such as those for gene therapy and drug delivery applications.
In addition to its power in driving the movement of nano-species without labeling, another advantage of using a thermal field is that it can be applied off-chip. Contact-free operation drastically simplifies the fabrication and operation of the microfluidic device. Many micro-heaters61 and electricity-free heating mechanisms62 have been developed with controllable temperature profiles to support portable devices for nucleic acid amplification. At the same time, cooling technologies have been advanced, and efficient heat sinks are readily available.63 Combined, miniaturized setups can be constructed to generate thermal fields inexpensively and achieve bio-nanoparticle enrichment in resource-limited settings. For example, in light of the Covid-19 pandemic, a portable device could facilitate monitoring and detection of virus present in the environment and for sensitive diagnosis of SARS-CoV-2 infection.
While nanoparticle focusing was demonstrated as a function of particle diameter in this work, it is worth noting that the value of ST is sensitive to particle sizes, their surface properties, the solution composition, and the absolute temperature. The sign of ST can even reverse to reflect thermophobic versus thermophilic responses. The complex dependence results from competing contributions of ionic shielding and water hydration entropy to thermophoresis, which have opposite dependence on temperature.24 The sensitivity of ST to many factors may explain the slight discrepancy between experimental and simulation results in this study, where constant values from room temperature measurements were used for numerical analysis. The accuracy of simulation can be improved as new theories are developed to formulate ST as a function of temperature. Nonetheless, the rich information reflected by thermophoretic mobility offers excellent versatility for separation purposes.64
Coupled thermophoresis and swirling flow have been employed in thermogravitational columns for decades for separation purposes. Debye et al. derived an analytical solution52 more than half a century ago to calculate the steady-state concentration enhancement in the column, which includes the aspect ratio of the column in the exponent. Thus a column with a high aspect ratio adds a tremendous boost to the accumulation effect. The high aspect ratio serves two functions: the total mass in the column is proportional to its height; thus, a tall column has more mass to feed the accumulation corner. Secondly, the recirculation speed or the magnitude of natural convection increases with the height of the column, as indicated by the Boussinesq approximation. On the other hand, the column utilizes the temperature gradient to promote both thermophoresis and the swirling transport, complicating their coupling. Furthermore, the column employs a batch process, and the accumulation corner develops with time; thus, enriched samples cannot be retrieved continuously.
Innovative of the microfluidic device, parallel microgrooves engraved on the channel surface are used to induce an engineered swirling flow (Fig. S4b†) independent of the temperature gradient. Surface-structured microfluidics are popular options to create swirling patterns and mixing streams in a laminar flow.53 Analytical and numerical models are readily available to predict the resulting velocity and mixing quality.65 Here, simple parallel microgrooves are used to de-mix a nanoparticle suspension. The grooves generate a transverse component that recirculates back across the opposite side of the channel, leading to helical streamlines in the entire flow. The profile and magnitude of the swirl are controllable by the groove structure, which is designed to possess shallow thickness and wide spacing, promoting a gentle transverse flow. The resulting magnitude of transverse velocity used in this work is in the range of 10–100 μm s−1, a small fraction (<1/10) of the axial velocity on average (Fig. S4c†), and gentle enough to cause minimal damage to viral samples.
While the transverse flow (Fig. S4c†) in the microfluidic device serves a similar function to the convection roll in the column to sweep the accumulation wall and augment nanoparticle focusing, the flow pattern in the microchannel is much more complex. It demands a numerical model to assists the understanding of the transport process and device optimization. It is observed that the grooves and ridges generate repeated concentration fluctuation. Thus, the device orientation has been selected to promote enrichment along the flat wall, reducing the variations of the surface structures to velocity and concentration profiles. The computational analysis also suggests that maximal accumulation happens when the thermophoretic and convective transport have comparable magnitudes.51 Under such a condition, sufficient span-wise sweep is generated, while it is not too strong to disturb the focusing region significantly. Experimentally, this optimal condition is achievable through groove geometry and sample flow rate. With one selected device structure in this work, enrichment is strongly dependent on the sample flow rate (Fig. 2c and d and 3a) since the swirling magnitude scales with the input flow rate (Fig. S4c†).
With the guidance of the numerical analysis, versatile operation modes could be evaluated for different applications. For example, narrowing Outlet 1 would produce greater outflow concentration if mass yield could be compromised. On the other hand, increasing the outlet width and cascading devices for multiple stages of focusing could boost both accumulation and yield. Furthermore, the microfluidic channel can be directly integrated with biosensors by strategically placing the sensors on the enrichment edge to allow a sensitive on-chip analysis of nanoparticles.
It should be noted that the microfluidic device distinguishes from thermal field flow fractionation (TFFF), which is commonly used for the analysis of polymer and colloid mixtures.32,66 In typical TFFF, macromolecules and colloid particles in a temperature field adopt a unique parabolic velocity field distribution established across a thin gap. This leads to different stream-wise velocity and residence time in the device, analyzed as differential arrival time at a detector. While TFFF requires a plug sample to prevent different species from overlapping axially,60,67 the device presented here allows continuous sample inflow and retrieval of enriched samples from a side outlet. More recently, field flow fractionation has been advanced to accommodate continuous sample feed68 through split-flow thin fractionation (SPLITT), yet the use of a carrier solution dilutes the sample. Instead, our device is compatible with raw biological samples without buffer exchange or carrier solutions. The main separation axis is converted from the shallowest dimension of the channel, where the external field is applied, to a much wider span-wise direction that is orthogonal to the thermal field. Not only does it permit significant concentration enhancement not achievable in SPLITT, but the setup is also much simpler for outflow retrieval. While sample focusing is demonstrated in this work, the variable focusing potential of different species provides the opportunity for particle sorting, for example, by retrieving outflows at different distances from the inlet.64
Experimental
Device fabrication
Standard soft lithography techniques were used to fabricate the microfluidic devices. Briefly, the master mold was made by spin-coating SU-8 2010 and SU-8 2035 (MicroChem, Westborough, MA) negative photoresist on a 3-inch silicon wafer (Silicon Inc., Boise, ID) and exposing the photoresist to UV light through photomasks with the channel geometry. The height of the channel and grooves were 50 μm and 10 μm, respectively. Afterwards, a mixture of Polydimethylsiloxane (PDMS) prepolymer and curing agent (Sylgard® 184 Silicone Elastomer Kit, Dow Corning, Midland MI) was mixed in a 10:1 ratio and spin-coated onto the master mold at 650 rpm for 60 seconds to get a 120 μm PDMS layer. The coated silicon wafer was incubated for 1 hour at 100 °C to allow curing to complete prior to device assembly. Next, the PDMS layer was peeled off from the wafer and sandwiched between two slices of cover glasses (Corning Cover Glass, no. 1, Corning, NY). The bonding between the PDMS and the glass coverslips was achieved through oxygen plasma (March instruments PX-250, Nordson March, Westlake, OH). The cover glass facing the channel was pre-drilled with inlet and outlet holes using a laser cutter. Rigid glass held the channel from collapsing, and the overall device thickness of ∼350 μm allowed the establishment of a temperature gradient on the order of 0.1 K μm−1 in the channel. The last assembly step consisted of bonding PDMS blocks over the inlet and outlet ports for tubing attachment. A photograph of the assembled device is shown in Fig. 1b.
The microfluidic channel used in this work has a geometry shown in Fig. 1c. The channel width (W) and height (H) are 1 mm and 50 μm, respectively and the length is ∼32 cm. The slanted grooves have a height (h) of 10 μm, width (w) of 25 μm and spacing (s) of 200 μm. The slanting angle (θ) and overall thickness of the PDMS film are 45° and 120 μm. In contrast to surface microgrooves to induce mixing,53 the grooves here possess shallow thickness and wide spacing, creating a weak three-dimensional helical flow. The magnitude of the span-wise velocity is controlled by the groove structures and scales with the stream-wise velocity (Fig. S4c†).
Device setup for confocal microscopy imaging of nanoparticle distribution in the flow channel
For confocal microscopy imaging, the roof of the microfluidic device was attached to a custom-designed rectangular brass tube using a ceramic thermal adhesive (TP-1, Thermal Paste, TE Technology, Traverse City, MI). The brass tube was connected with a recirculating chiller (VWR International, Radnor, PA) to circulate a mixture of water and glycerol at a preset temperature. The temperature measured from the brass tube was −3.5 °C. This heat sink temperature was selected to minimize frost buildup and channel freezing, sometimes observed with lower temperature settings. A heat gun was used to blow hot air and maintain the bottom of the device at 40 °C, indicated by an attached thermistor (MP-2444, TE Technology). The heat source of 40 °C was used to protect biological samples. Note that the roof and bottom of the device correspond to the featureless and grooved sides of the channel respectively, which is opposite from the schematic in Fig. 1c. The establishment of a stable vertical temperature gradient occurred within ∼10 minutes, confirmed by a temperature-sensitive fluorescent dye 2′,7′-bis-(2-carboxyethyl)-5-(and-6)-carboxyfluorescein (BCECF, Thermo Fisher Scientific, Waltham, MA) at a concentration of 1 mM in DI water.45 The fluorescence intensity of BCECF decreases nearly linearly with temperature; thus, a steady temperature gradient corresponds to a steady gradient of fluorescence intensity in the cross-sectional plane (y–z plane).To image the distribution of nanoparticles in the channel, 100 nm polystyrene particles internally dyed with Firefli Fluorescent Red (R100, Thermo Fisher Scientific) at a concentration of 0.1% (v/v) in water was injected into the channel through a syringe pump (Fusion 100, Chemyx, Stafford, TX) at various flow rates from 0.2 μL min−1 to 2.0 μL min−1 for at least 30 minutes before image acquisition. Z-stack images at various locations from the inlet were acquired using an inverted Zeiss LSM880 scanning confocal microscope (Zeiss, Oberkochen, Germany) to construct images of nanoparticle distribution in the y–z plane normal to the primary, axial flow.
Device setup for polystyrene nanoparticle retrieval
A slightly different setup with a more robust temperature control was used to retrieve nanoparticles and biological samples from the flow channel (Fig. 1c). The rectangular brass tube attached to the recirculating chiller was still used as the heat sink. A TE-195 Peltier plate (TE Technology, Traverse City, MI) glued to a custom-made copper block with an integrated thermistor was used as the heat source. The Peltier plate and thermistor were connected to a temperature controller (TC-48-20, TE Technology, Traverse City, MI) set to 40 °C. The recirculating chiller was preset so the temperature measured on the brass tube was −3.5 °C. The orientation was reversed from the one described above for imaging, i.e., the heat source was above the heat sink, to facilitate assembly of the sandwich structure of the brass tube, microchannel and Peltier plate. A similar setup has been described in details in our prior work.69 The operation mechanism remained the same in both orientations as the gravitational force on polystyrene nanoparticles and viruses was negligible. Natural convection, although included in the simulation, was also negligible since the Rayleigh number Ra ≈ 0.02, which is much smaller than the threshold for natural convection to occur. The energy equation was solved in ANSYS Fluent to analyze the temperature distribution (Fig. S1a†) in the entire apparatus, including all regions. The result showed that a 12 °C temperature difference, from 4 °C to 16 °C, was established on the fluid layer of the 50 μm thick channel plus 10 μm thick grooves with a quasi-linear profile (Fig. S1b†), corresponding to a temperature gradient of ∼0.2 K μm−1. It should be noted that the Peclet number of heat transfer is small (Pe ∼ 10−7); thus, the temperature profile can be considered steady in the steady flow. Using the known Soret coefficient and diffusivity of 100 nm polystyrene particles in water (Table S1†), the thermophoretic velocity is ∼2 × 10⁻⁷ m s−1.The microfluidic device was sandwiched between the heat source and sink, with liquid gallium filling the interfaces. A trifurcated outlet of 1:3:1 length ratio was designed to retrieve 20% of the outflow from the two side outlets and 60% of the outflow from the center. Three capillary tubes were inserted into the PDMS blocks attached to the outlets. The capillary tubes were oriented downwards and drained into a liquid reservoir to equalize hydrostatic pressure and minimize surface tension at the outlets. Nanoparticles of various diameters (25, 50, 100, 200, 300 and 400 nm, R25-R400, Thermo Fisher Scientific, Waltham, MA) and 100 μL volume at 0.1% (v/v) in water were flowed through the device using a syringe pump at various flow rates, ranging from 0.3 μL min−1 to 2.0 μL min−1. These particles were all internally dyed with Firefli Fluorescence Red. The absorbance of all three outflows collected by the capillary tubes was measured with a NanoDrop 2000 UV-vis spectrometer (Thermo Fisher Scientific, Waltham, MA), and particle concentration was quantified using pre-determined calibration curves at selected wavelengths. Mass conservation was confirmed by comparing the total amount of particles flowing in and out of the devices.
Enrichment of HIV and bacteriophage through the device
Lab stocks of cultured pseudo-HIV virus and mycobacterium phage D29 were pumped through the device using the same setup as described above for nanoparticle retrieval. The HIV virus was prepared by transfecting HEK 293T/17 cells (ATCC, Manassas, VA) as previously described70 and culturing the cells in a complete growth medium of DMEM (30-2002, ATCC, Manassas, VA) supplemented with 10% fetal bovine serum (30-2020, ATCC) for 48 hours. Afterward, the virus was harvested by collecting the cell culture supernatant, spinning down the cell debris and filtering through a 0.45 mm filter (Thermo Fisher Scientific, Waltham, MA). Without further purification, a 100 μL-virus sample was pumped into the device at flow rates of 0.3, 0.5, and 1 μL min−1 and exposed to the same temperature conditions described for nanoparticle processing. The outflows were collected from the three capillary tubes and stored at −20 °C until further analysis. The concentration of HIV viral particles was determined using two commercial kits following manufacturer-recommended protocols. The Alliance® HIV-1 p24 Antigen ELISA kit (PerkinElmer, Waltham, MA) and Tecan Infinite M200 PRO microplate reader (Tecan Group Ltd, Switzerland) were used to measure the amount of p24 capsid protein. The HIV Quantitative RT-PCR Detection kit (33740, Norgen Biotek, Thorold, ON) and Applied Biosystems 7300 qRT PCR machine (Thermo Fisher Scientific, Waltham, MA) were used to quantify virus RNA.
To evaluate the activity of biological samples after enrichment, mycobacterium phage D29 was enriched in the device. The phage was generously provided by Dr Ware at Lehigh University and prepared by infecting Mycobacterium smegmatis strain MC2 155 in a liquid culture according to previously reported protocols.71 Afterwards, the bacteria debris was spun down, and the lysate containing phage was used in this work without further purification. The phage sample of 100 μL volume was pumped into the device at 0.5 μL min−1. The device was subjected to the same temperature condition as described for nanoparticle processing unless otherwise noted. The outflows were collected from the capillaries, diluted and mixed with liquid cultures of M. smegmatis. The mixture was then plated on a LB agar plate, and the number of plaques formed was counted after 24 hours. The relative concentration of PFU was obtained by first normalizing the plaque number from each plate to the total number of plaques from the three outlets of the same device and then dividing the result by the expected volume fraction of that outflow.
Statistical analysis
Each experimental condition was repeated at least three times using independent microfluidic devices. The results were analyzed by calculating the means and standard deviations. In addition, two-tailed Student's t-tests or paired t-tests were performed to check if significant differences exist between two groups, as described in the Results section.Computational simulation
Computational fluid dynamics simulations characterized the temperature and flow profiles and mass transport within the microchannel. A partial channel geometry was extruded from the AutoCAD drawing of the photomask and imported into the Ansys Fluent program (Ansys, Canonsburg, PA). Since the centrifugal force at the channel bends was negligible, the geometry was approximated using a long straight channel of 32 cm to reduce the complexity of mesh generation. Cut cell meshes based on hexahedral cells were built with refinement near groove regions and zones with expected high concentration gradients (Fig. S2†). According to the convergence study, the final mesh contained 280 million cells. It was decomposed in 320 sub-domains to execute in parallel, which was confirmed to achieve the balance between computational accuracy and speed.The steady-state temperature profile within the entire apparatus between the heat source and sink was first simulated using the Energy Equation Module in Ansys Fluent. Thermal conductivities corresponding to glass, PDMS, water, and experimentally measured thickness of each layer were used in the simulation (Fig. S1a†). Continuous temperature and heat flux were applied to interfaces between all layers. Two-stage simulation in the fluid domain was performed with OpenFOAM by utilizing the calculated temperature field of the whole system (Fig. S1b†). In the first stage, coupled mass, momentum, and energy conservation equations (ESI†: Mathematical Model) were solved to determine the profiles of velocity U, pressure p, and temperature T. In the second stage of the simulation, the normalized concentration C was solved by the transient mass transport equation with an additional thermophoresis term. The input concentration was uniform and defined as one. The two-stage simulation was carried out considering that the time scale for the flow and temperature fields to reach steady state, on the order of seconds, was much shorter than and negligible compared to the time scale of mass transport, on the order of 10 minutes. Thus, the velocity and temperature field could be assumed to be at the steady state while the concentration field is evolving, which reduced a 4-fields coupled problem into two stages (3- and 1-field problems) to save computational resources. Diffusion coefficient D corresponding to different nanoparticle sizes in water was evaluated as a function of temperature by the Stokes–Einstein equation and viscosity equation. The Soret coefficient ST for each type of particles was assumed to be a constant in this narrow temperature range and did not appreciably depend on T. This assumption was made due to the lack of a well-formulated relationship between the ST and T despite reports of the temperature dependence of ST.24 The constant values of ST for each type of particles were either experimentally determined around room temperature72 or interoperated using a power function (Table S1†),73 considering fluids in the microfluidic channel was not far from room temperature (Fig. S1†). Detailed equations for the simulation are included in the ESI.†
The peak concentration at each y–z plane was determined and normalized to the input concentration (Fig. S3† top). Since the input concentration was set to be unity in the simulation, the dimensionless concentration at each coordinate also represented the accumulation factor relative to the input. The average outflow concentration over a selected area was evaluated by the integrated mass flux divided by the volume flux over the area. To match the experimental device, a cross-sectional area of the channel thickness and 20% channel width on the focusing side was selected numerically as the integral domain (Fig. S3† bottom), consistent with the sample concentration retrieved from Outlet 1 in experiments. The outflow concentration in the span-wise direction was calculated by integrating the mass flux over 100 μm wide windows sliding along the y-axis in the cross-sectional surface, followed by the volume flux division over the same area.
Conclusions
A label-free, continuous flow method was described for nanoparticle focusing by coupling thermophoresis and engineered helical convection, and its utility was demonstrated using synthetic nanoparticles and viruses. The capability to process viral samples under continuous sample feed in the original media without labeling is appealing for downstream analytical and biomedical applications. The device performance, including yield, accumulation factor, and preservation of sample bioactivity, promises gentle, biocompatible yet effective focusing of biological nanoparticles. The device optimization for specific applications is warranted through a predictive numerical model. Given comparable physical characteristics between viruses and other nano-vesicles, such as exosomes and liposomes, the device is expected to find broad applications in microorganism detection and development of nanomedicine. While a thermal field is used in this work, coupling a driving field and a helical flow to amplify the accumulation could be generalized to other mechanisms for nanoparticle enrichment.Author contributions
X. C. contributed to conceptualization and funding acquisition. X. C. and A. O. participated in project administration, supervision, investigation and methodology. D. L., C. Z., Z. C. and G. X. contributed to data curation, formal analysis and validation. G. X, D. L. and X. C. prepared the original manuscript. G. X. A. O. and X. C. participated in the review and paper editing. D. L., C. Z. and G. X. contributed equally to this research.Conflicts of interest
There are no conflicts to declare.Acknowledgements
This work was supported by the National Science Foundation under Award No. 1511284, the PA Department of Health CURE Formula Funds and the Pennsylvania Infrastructure Technology (PITA) funding. Computer resources were provided by the Extreme Science and Engineering Discovery Environment (XSEDE), which is supported by the National Science Foundation, Grant No. ACI-1548562(43). We would also like to acknowledge Dr Vassie Ware and Mr Hamidu Mohammed for assistance with the bacteriophage experiments.Notes and references
- R. Wolfel, V. M. Corman, W. Guggemos, M. Seilmaier, S. Zange, M. A. Muller, D. Niemeyer, T. C. Jones, P. Vollmar, C. Rothe, M. Hoelscher, T. Bleicker, S. Brunink, J. Schneider, R. Ehmann, K. Zwirglmaier, C. Drosten and C. Wendtner, Nature, 2020, 581, 465–469 CrossRef PubMed.
- M. Rusinol, S. Martinez-Puchol, E. Fores, M. Itarte, R. Girones and S. Bofill-Mas, Curr. Opin. Environ. Sci. Health, 2020, 17, 21–28 CrossRef PubMed.
- L. Schoenmaker, D. Witzigmann, J. A. Kulkarni, R. Verbeke, G. Kersten, W. Jiskoot and D. J. A. Crommelin, Int. J. Pharm., 2021, 601, 120586 CrossRef CAS PubMed.
- M. Pastucha, Z. Farka, K. Lacina, Z. Mikusova and P. Skladal, Microchim. Acta, 2019, 186, 26 CrossRef PubMed.
- C. W. Shields, C. D. Reyes and G. P. Lopez, Lab Chip, 2015, 15, 1230–1249 RSC.
- P. Sajeesh and A. K. Sen, Microfluid. Nanofluid., 2014, 17, 1–52 CrossRef.
- F. Yang, X. Z. Liao, Y. Tian and G. Y. Li, Biotechnol. J., 2017, 12, 8 Search PubMed.
- J. C. Contreras-Naranjo, H. J. Wu and V. M. Ugaz, Lab Chip, 2017, 17, 3558–3577 RSC.
- T. Salafi, K. K. Zeming and Y. Zhang, Lab Chip, 2017, 17, 11–33 RSC.
- T. L. Zhang, Z. Y. Hong, S. Y. Tang, W. H. Li, D. W. Inglis, Y. Hosokawa, Y. Yalikun and M. Li, Lab Chip, 2020, 20, 35–53 RSC.
- K. E. Petersen, F. Shiri, T. White, G. T. Bardi, H. Sant, B. K. Gale and J. L. Hood, Anal. Chem., 2018, 90, 12783–12790 CrossRef CAS PubMed.
- H. Morgan, M. P. Hughes and N. G. Green, Biophys. J., 1999, 77, 516–525 CrossRef CAS PubMed.
- B. H. Lapizco-Encinas and M. Rito-Palomares, Electrophoresis, 2007, 28, 4521–4538 CrossRef CAS PubMed.
- S. Dash and S. Mohanty, Electrophoresis, 2014, 35, 2656–2672 CrossRef CAS PubMed.
- B. Abecassis, C. Cottin-Bizonne, C. Ybert, A. Ajdari and L. Bocquet, Nat. Mater., 2008, 7, 785–789 CrossRef CAS PubMed.
- M. X. Wu, Z. M. Mao, K. J. Chen, H. Bachman, Y. C. Chen, J. Rufo, L. Q. Ren, P. Li, L. Wang and T. J. Huang, Adv. Funct. Mater., 2017, 27, 8 Search PubMed.
- D. Kang, S. Oh, P. Reschiglian and M. H. Moon, Analyst, 2008, 133, 505–515 RSC.
- M. Wu, Y. Ouyang, Z. Wang, R. Zhang, P.-H. Huang, C. Chen, H. Li, P. Li, D. Quinn, M. Dao, S. Suresh, Y. Sadovsky and T. J. Huang, Proc. Natl. Acad. Sci. U. S. A., 2017, 114, 10584 CrossRef CAS PubMed.
- J. D. Robertson, L. Rizzello, M. Avila-Olias, J. Gaitzsch, C. Contini, M. S. Magon, S. A. Renshaw and G. Battaglia, Sci. Rep., 2016, 6, 27494 CrossRef CAS PubMed.
- A. Saxena, B. P. Tripathi, M. Kumar and V. K. Shahi, Adv. Colloid Interface Sci., 2009, 145, 1–22 CrossRef CAS PubMed.
- P. Zhang, X. Zhou, M. He, Y. Shang, A. L. Tetlow, A. K. Godwin and Y. Zeng, Nat. Biomed. Eng., 2019, 3, 438–451 CrossRef CAS PubMed.
- X. Yu, Y. Q. Xia, Y. Tang, W. L. Zhang, Y. T. Yeh, H. G. Lu and S. Y. Zheng, Small, 2017, 13, 12 Search PubMed.
- R. Piazza, Soft Matter, 2008, 4, 1740–1744 RSC.
- S. Duhr and D. Braun, Proc. Natl. Acad. Sci. U. S. A., 2006, 103, 19678–19682 CrossRef CAS PubMed.
- D. Niether and S. Wiegand, J. Phys.: Condens. Matter, 2019, 31, 25 CrossRef PubMed.
- M. Braibanti, D. Vigolo and R. Piazza, Phys. Rev. Lett., 2008, 100, 4 CrossRef PubMed.
- C. Ludwig, Sitz. Math. Naturwiss. Classe Kaiserlichen Akad. Wiss, 1856, 20, 539 Search PubMed.
- C. Soret, Arch. Sci. Phys. Nat., 1879, 2, 48–61 Search PubMed.
- W. Kohler and K. I. Morozov, J. Non-Equilib. Thermodyn., 2016, 41, 151–197 Search PubMed.
- K. Clusius and G. Dickel, Naturwissenschaften, 1938, 26, 546 CrossRef CAS.
- B. C. Reed, Phys. Perspect., 2011, 13, 161–188 CrossRef.
- J. C. Giddings, Science, 1993, 260, 1456–1465 CrossRef CAS PubMed.
- G. S. McNab and A. Meisen, J. Colloid Interface Sci., 1973, 44, 339–346 CrossRef CAS.
- S. Iacopini, R. Rusconi and R. Piazza, Eur. Phys. J. E, 2006, 19, 59–67 CrossRef CAS PubMed.
- A. Wurger, Phys. Rev. Lett., 2008, 101, 108302 CrossRef PubMed.
- R. Piazza, S. Iacopini and B. Triulzia, Phys. Chem. Chem. Phys., 2004, 6, 1616–1622 RSC.
- J. Burelbach, D. Frenkel, I. Pagonabarraga and E. Eiser, Eur. Phys. J. E, 2018, 41, 12 CrossRef PubMed.
- M. Jerabek-Willemsen, T. Andre, R. Wanner, H. M. Roth, S. Duhr, P. Baaske and D. Breitsprecher, J. Mol. Struct., 2014, 1077, 101–113 CrossRef CAS.
- C. J. Wienken, P. Baaske, U. Rothbauer, D. Braun and S. Duhr, Nat. Commun., 2010, 1, 7 CrossRef PubMed.
- X. K. Lin, T. Y. Si, Z. G. Wu and Q. He, Phys. Chem. Chem. Phys., 2017, 19, 23606–23613 RSC.
- D. Vigolo, G. Brambilla and R. Piazza, Phys. Rev. E, 2007, 75, 040401(R) CrossRef PubMed.
- J. J. Chen, H. J. Cong, F. C. Loo, Z. W. Kang, M. H. Tang, H. X. Zhang, S. Y. Wu, S. K. Kong and H. P. Ho, Sci. Rep., 2016, 6, 13 CrossRef PubMed.
- C. B. Mast, S. Schink, U. Gerland and D. Braun, Proc. Natl. Acad. Sci. U. S. A., 2013, 110, 8030–8035 CrossRef CAS PubMed.
- P. Baaske, F. M. Weinert, S. Duhr, K. H. Lemke, M. J. Russell and D. Braun, Proc. Natl. Acad. Sci. U. S. A., 2007, 104, 9346–9351 CrossRef CAS PubMed.
- D. Braun and A. Libchaber, Phys. Rev. Lett., 2002, 89, 188103_188101–188103_188104 Search PubMed.
- T. Matreux, K. Le Vay, A. Schmid, P. Aikkila, L. Belohlavek, A. Z. Caliskanoglu, E. Salibi, A. Kuhnlein, C. Springsklee, B. Scheu, D. B. Dingwell, D. Braun, H. Mutschler and C. B. Mast, Nat. Chem., 2021, 13, 1038–1045 CrossRef CAS PubMed.
- T. L. Edwards, B. K. Gale and A. B. Frazier, Anal. Chem., 2002, 74, 1211–1216 CrossRef CAS PubMed.
- D. Vigolo, R. Rusconi, R. Piazza and H. A. Stone, Lab Chip, 2010, 10, 795–798 RSC.
- T. Tsuji, K. Kozai, H. Ishino and S. Kawano, Micro Nano Lett., 2017, 12, 520–525 CrossRef CAS.
- F. M. Weinert, C. B. Mast and D. Braun, Phys. Chem. Chem. Phys., 2011, 13, 9918–9928 RSC.
- C. Zhao, Z. Cao, J. Fraser, A. Oztekin and X. Cheng, J. Appl. Phys., 2017, 121, 024902 CrossRef.
- V. P. Debye, Ann. Phys., 1939, 5, 284–294 CrossRef.
- A. D. Stroock, S. K. W. Dertinger, A. Ajdari, I. Mezic, H. A. Stone and G. M. Whitesides, Science, 2002, 295, 647–651 CrossRef CAS PubMed.
- P. Li, M. Kaslan, S. H. Lee, J. Yao and Z. Gao, Theranostics, 2017, 7, 789–804 CrossRef CAS PubMed.
- M. Wolff, J. J. Mittag, T. W. Herling, E. D. Genst, C. M. Dobson, T. P. Knowles, D. Braun and A. K. Buell, Sci. Rep., 2016, 6, 22829 CrossRef CAS PubMed.
- R. Pethig, Dielectrophoresis: Theory, Methodology, and Biological Applications, John Wiley & Sons, Inc., Hoboken, NJ, 2017 Search PubMed.
- C. Liu, J. Y. Guo, F. Tian, N. Yang, F. S. Yan, Y. P. Ding, J. Y. Wei, G. Q. Hu, G. J. Nie and J. S. Sun, ACS Nano, 2017, 11, 6968–6976 CrossRef CAS PubMed.
- L. Helden, R. Eichhorn and C. Bechinger, Soft Matter, 2015, 11, 2379–2386 RSC.
- R. Piazza, J. Phys.: Condens. Matter, 2004, 16, S4195–S4211 CrossRef CAS.
- M. E. Hovingh, G. H. Thompson and J. C. Giddings, Anal. Chem., 1970, 42, 195–203 CrossRef CAS.
- F. Ahmad and S. A. Hashsham, Anal. Chim. Acta, 2012, 733, 1–15 CrossRef CAS PubMed.
- J. Singleton, J. L. Osborn, L. Lillis, K. Hawkins, D. Guelig, W. Price, R. Johns, K. Ebels, D. Boyle, B. Weigl and P. LaBarre, PLoS One, 2014, 9, 19 CrossRef PubMed.
- S. M. S. Murshed and C. A. N. de Castro, Renewable Sustainable Energy Rev., 2017, 78, 821–833 CrossRef.
- A. Errarte, A. Martin-Mayor, M. Aginagalde, I. Iloro, E. Gonzalez, J. M. Falcon-Perez, F. Elortza and M. M. Bou-Ali, Int. J. Therm. Sci., 2020, 156, 106435 CrossRef CAS.
- A. D. Stroock and G. J. McGraw, Philos. Trans. R. Soc., A, 2004, 362, 971–986 CrossRef PubMed.
- J. Janca, Int. J. Polym. Anal. Charact., 2006, 11, 57–70 CrossRef CAS.
- J. Janca, Int. J. Polym. Anal. Charact., 2017, 22, 93–103 CrossRef CAS.
- J. C. Giddings, Sep. Sci. Technol., 1985, 20, 749–768 CrossRef CAS.
- T. M. Reidy, D. Luo, P. Rana, B. Huegel and X. Cheng, J. Micromech. Microeng., 2018, 29, 015014 CrossRef.
- Y. Hu, X. Cheng and D. Ou-yang, Biomed. Opt. Express, 2013, 4, 1646–1653 CrossRef PubMed.
- N. P. Edgington, S. M. Voshell, V. C. Ware, F. F. Akoto, A. A. Alhout, G. J. Atwal, J. B. Balyozian, Z. A. Cadieux, B. M. Chop, S. G. Cresawn, N. Cudkevich, D. Z. Faltine-Gonzalez, R. A. Garlena, B. J. Gilmer, L. H. Graham, M. S. Grapel, M. M. Haleem, D. Jacobs-Sera, M. A. Kenna, M. A. Khan, T. N. Klein, J. B. Korenberg, B. P. Lichak, C. M. Mageeney, L. N. McKinley, K. R. Mendello, C. M. Myers, A. T. Nguyen, B. A. Pasqualucci, W. H. Pope, L. M. Pyfer, W. A. Ramirez, J. R. Reisner, D. A. Russell, P. A. Sapao, V. C. Saux, I. Singh, T. H. Stoner, R. H. Swope, M. J. Thoonkuzhy, M. L. Walters, L. A. Vargas, C. A. Veliz, K. D. Zhang, C. M. Zuilkoski and G. F. Hatfull, Microbiol. Resour. Announce., 2017, 5, e01070-17 Search PubMed.
- C. Zhao, PhD, Lehigh University, 2015.
- A. F. Andreev, J. Exp. Theor. Phys., 1988, 94, 210 CAS.
Footnotes |
| † Electronic supplementary information (ESI) available. See DOI: 10.1039/d1ra09462a |
| ‡ Danli Luo, Chao Zhao and Guanyang Xue contributed equally to this work. |
| This journal is © The Royal Society of Chemistry 2022 |