DOI:
10.1039/D1RA09455F
(Paper)
RSC Adv., 2022,
12, 8414-8422
New ruthenium polypyridyl complexes as potential sensors of acetonitrile and catalysts for water oxidation†
Received
30th December 2021
, Accepted 7th March 2022
First published on 17th March 2022
Abstract
New ruthenium(II) polypyridyl complexes of formulae [RuCl(Me2Ntrpy)(bpy-OMe)]Cl, 1, and [Ru(Me2Ntrpy)(bpy-OMe)(OH2)](CF3SO3)2, 2, with Me2Ntrpy = 4′-N,N-dimethylamino-2,2′:6′,2′′-terpyridine and bpy-OMe = 4,4′-dimethoxy-2,2′-bipyridine, were synthetized and characterized by spectroscopic and electrochemical techniques. Besides, [Ru(Me2Ntrpy)(bpy-OMe)(NCCH3)]2+, 3, was obtained and characterized by UV-vis spectroscopy in acetonitrile solution. All experimental results were complemented with DFT and TD-DFT calculations. The complete structure of complex 1 was determined by X-ray diffraction, evidencing that the Ru–N and Ru–Cl bond lengths are longer than those determined in [RuCl(trpy)(bpy)](PF6). The strong electron donating properties of the substituents of both bpy and trpy rings in complexes 1 and 2 led to their potential applications for detecting traces of acetonitrile as a contaminant in aqueous solutions of radiopharmaceuticals and to utilization of complex 2 as a promising candidate for catalyzing water oxidation processes.
Introduction
Polypyridyl ruthenium(II) complexes have been extensively studied in connection to molecular sensing processes and energy conversion schemes.1 In artificial photosynthesis, the water oxidation half-reaction was recognized as the bottleneck for successful devices. It involves the removal of four electrons and four protons from two water molecules with the formation of an O–O bond2–4 and therefore requires the accumulation of multiple redox equivalents at a single site or cluster. In this context, aqua-polypyridyl complexes of Ru(II) are capable of accessing high oxidation states at low potentials through proton-coupled electron transfer (PCET) processes.5–7 Important advances in the design of new transition metal complexes used as precursors of water oxidation catalysts have been achieved by several groups.8–15
We have recently studied a series of complexes of formulae [Ru(trpy)(4,4-(X)2-bpy)(OH2)]2+, with trpy = 2,2′:6′,2′′-terpyridine, bpy = 2,2′-bipyridine, and X = H, CH3, OCH3, NH2 and N(CH3)2,16 in order to assess the influence of electron-donating substituents X in the bipyridyl rings on the rates of substitution of water by acetonitrile, an important contaminant in radiopharmaceuticals, whose determination is part of their quality control in PET (positron emission tomography) studies.17 We discovered that substitution rates increase with growing donor strength of X, an effect that helps in reducing the detection time of this contaminant. In this paper, we address the impact of an electron donating substituent in the trpy ring on these rates. For that purpose, we prepared and characterized two new polypyridyl Ru(II) complexes of formulae [RuCl(Me2Ntrpy)(bpy-OMe)]Cl, 1, and [Ru(Me2Ntrpy)(bpy-OMe)(OH2)](CF3SO3)2, 2, with Me2Ntrpy = 4′-N,N-dimethylamino-2,2′:6′,2′′-terpyridine, and bpy-OMe = 4,4′-dimethoxy-2,2′-bipyridine. Complex 3, [Ru(Me2Ntrpy)(bpy-OMe)(NCCH3)]2+ was obtained in solution by dissolving complex 2 in CH3CN.
We also found possible applications of complex 2 as a precursor for a water oxidation catalyst that may be useful in artificial photosynthetic processes.18
Results and discussion
Syntheses
The precursor Ru(Me2Ntrpy)Cl3 was prepared following a previously reported method.19 The used procedures for synthetizing the new species [RuCl(Me2Ntrpy)(bpy-OMe)]Cl, 1, were similar to those previously described for related complexes.20 It was obtained by reacting equimolar quantities of Ru(Me2Ntrpy)Cl3 and bpy-OMe in the presence of Et3N as a reducing agent. LiCl was added to diminish the concomitant formation of [Ru(bpy-OMe)3]Cl2 and the obtained solid was chromatographed over Al2O3 to separate 1 from undesired side products. The new complex [Ru(Me2Ntrpy)(bpy-OMe)(OH2)](CF3SO3)2, 2, was synthesized by substitution of the coordinated chloride ligand in 1 by water using Ag(CF3SO3) in an acetone/water mixture (3![[thin space (1/6-em)]](https://www.rsc.org/images/entities/char_2009.gif) :1). Both complexes were soluble in organic solvents and their purities were confirmed by chemical analyses, ESI-MS, NMR and IR spectra, as reported in the Experimental section. ESI mass spectrum of 1 is displayed in Fig. S1.† Scheme 1 shows the structure of the cation of complex 1.
:1). Both complexes were soluble in organic solvents and their purities were confirmed by chemical analyses, ESI-MS, NMR and IR spectra, as reported in the Experimental section. ESI mass spectrum of 1 is displayed in Fig. S1.† Scheme 1 shows the structure of the cation of complex 1.
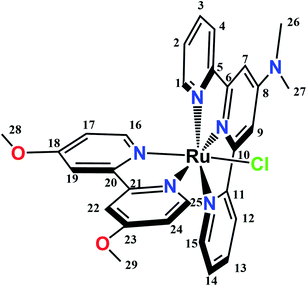 |
| | Scheme 1 Structure of the cation of complex 1 and proton numbering scheme for NMR assignments. | |
NMR spectroscopy
All the 1H, 13C and 15N chemical shifts for 1 in CD3OD and the 1H and 13C chemical shifts for 2 in (CD3)2CO are displayed in the Experimental section, while proton numbering is shown in Scheme 1. Signal assignments could be accomplished by using 2D techniques. Fig. S2–S8† show the 1D 1H and 13C NMR spectra and 2D 1H–1H COSY, 1H–1H NOESY 1H–15N HMBC 1H–13C HSQC and 1H–13C HMBC spectra of 1 dissolved in CD3OD as a representative example. Downfield shifts of NMR signals of H7, H9, H26 and H27 in complex 1 respect to the corresponding values in the free ligand Me2Ntrpy can be rationalized by the inductive effect induced by coordination to Ru(II). A remarkable downfield shift can be observed for H25 (δ = 9.87 ppm) in complex 1, which can be explained by the presence of the highly electronegative chloride ligand. When replacing Cl− by H2O in complex 2, this effect is suppressed and the H25 signal shifts to higher fields (δ = 9.48 ppm).
Crystal structure
Black crystalline needles suitable for X-ray diffraction studies were grown by slow evaporation of a concentrated solution of 1 in a desiccator over dry silica gel. As shown in Fig. S9,† this complex crystallizes with three water molecules, which interact through hydrogen bonds with an average H⋯O distance ≈1.9 Å, and intermolecular π–π interactions between the pyridyl rings, with an estimated plane-to-plane distance of 3.5 Å in both cases, as shown in Fig. S10.† These crystals dried overnight over P4O10 have two water molecules, as reported in the Experimental section. All crystal data are shown in Tables S1–S3.† Fig. 1 shows an ORTEP diagram of the cation of 1 that put into evidence a distorted octahedral structure, with the substituted trpy and bpy ligands orthogonal between them, but with the pyridyl rings almost coplanar within each distinct ligand. Table 1 shows some of the determined bond lengths, which were close to those obtained for similar ruthenium complexes.21–23 All the Ru–N and the Ru–Cl bond lengths in 1 are longer than the corresponding ones observed in the parent complex [RuCl(trpy)(bpy)](PF6).24 Additionally, the Ru1–N35 distance is higher than those reported in complexes [RuCl(trpy)(bpy-OMe)]+25 and [Ru(trpy-OMe)(bpy)(OH2)]2+.26 These increments can be explained by the electron donating character of the methoxy and dimethylamino substituents in the bpy and trpy rings respectively of complex 1. The difference in bond lengths (Δr) between complex 1 and [RuCl(trpy)(bpy)](PF6) is also shown in Table 1, being grater in the case of those bonds that are trans- to these substituents (Ru1–N10, Ru1–N35 and Ru–Cl) as consequence of a structural trans effect (STE), which correlates with a kinetic trans effect (KTE),27 as discussed later in the Ligand substitution kinetics section.
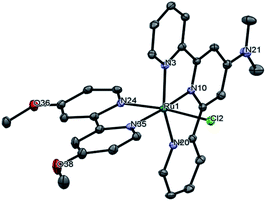 |
| | Fig. 1 ORTEP diagram of the cation of 1. Thermal ellipsoids are drawn at the 50% probability level. Lattice solvent molecules, counter-anions, hydrogen atoms and charge are omitted for clarity reasons. | |
Table 1 Selected bond distances (Å) in 1 and in [RuCl(trpy)(bpy)](PF6), and their differences Δr (Å)
| Bonda |
1 |
[RuCl(trpy)(bpy)](PF6)b |
Δr |
| Numbering of N atoms are shown in Fig. 1. Crystallographic data obtained from the Cambridge Crystallographic Data Centre (CCDC, 789502). |
| Ru1–N10 |
1.977 |
1.951 |
0.026 |
| Ru1–N3 |
2.073 |
2.059 |
0.014 |
| Ru1–N20 |
2.084 |
2.070 |
0.014 |
| Ru1–N24 |
2.050 |
2.031 |
0.019 |
| Ru1–N35 |
2.093 |
2.069 |
0.024 |
| Ru1–Cl |
2.431 |
2.397 |
0.034 |
UV-vis spectroscopy
Fig. 2 shows the UV-visible spectra of complexes 1, 2 and 3 in ethanol. Complex 3 is the product of substitution of H2O in complex 2 by CH3CN, a process described in the Ligand substitution kinetics section. In all these compounds, the lowest energy absorption bands can be assigned to dπ(Ru) → π*(Me2Ntrpy) – with small contributions of dπ(Ru) → π*(bpy-OMe) – MLCT transitions, by comparison to similar complexes.28 Introduction of a strong electron donating substituent such as N(CH3)2 in the trpy ring induces a red shift of the wavelength maximum of this MLCT band in 1 (λmax = 522 nm) respect to the corresponding value in [RuCl(trpy)(bpy)]+ (λmax = 503 nm).28 When going from 1 to 2, this band shifts to lower energies (λmax = 508 nm). When going from 2 to 3 (λmax = 468 nm), the blue shift is even greater. Both blue shifts are due to the spectrochemical series: Cl− < OH2 < CH3CN. Besides, the strong electron withdrawing properties of coordinated acetonitrile competes with polypyridines in π-backbonding from Ru(II).29 Transitions detected below 320 nm can be assigned to π(Me2Ntrpy) → π*(Me2Ntrpy) and π(bpy-OMe) → π*(bpy-OMe) intraligand transitions.30
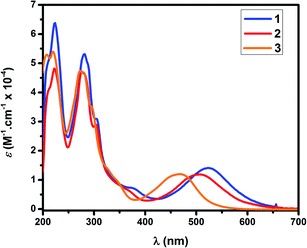 |
| | Fig. 2 UV-vis spectra of complexes 1, 2 and 3 in ethanol at r.t. | |
Electrochemistry
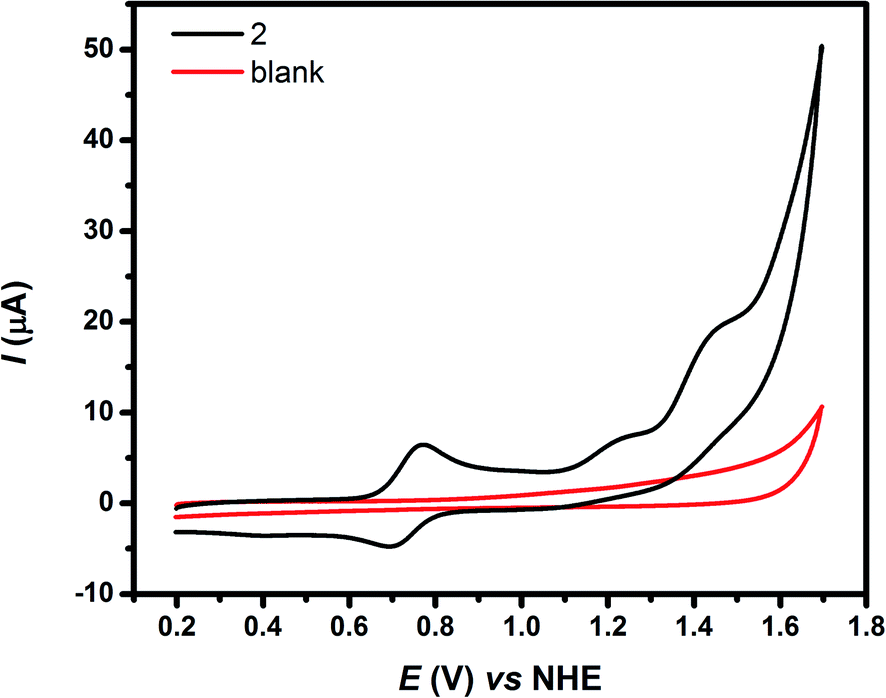
Table 2 shows the oxidative redox potential values E1/2, obtained from CV experiments, of complex 1 in CH2Cl2 (TBAH 0.1 M), of complex 2 in aqueous solution at pH = 1, and of complex [Ru(trpy)(bpy)(OH2)]2+ in aqueous solution at pH = 1, which has been included for comparison purposes.28 These complexes exhibit redox processes at negative potentials in organic solvents corresponding to quasi-reversible reductive processes located at the polypyridyl ligands. However, they cannot be detected in water, due to its narrow electrochemical window. As shown in Fig. 3, the cyclic voltammogram of 2 displays three oxidation waves, the first process at E1/2 = 0.71 V (vs. NHE) can be assigned to the reversible RuIII/II couple, while those that follow at E1/2 = 1.15 and 1.37 V (vs. NHE) can be attributed to RuIV/III and RuV/IV couples respectively. The RuV/IV process occurs at the onset of the catalytic water oxidation wave. Introduction of strong electron donating substituents in both trpy and bpy rings in 2 lowers the redox potentials of the Ru couples compared to those of the reference complex [Ru(trpy)(bpy)(OH2)]2+ as shown in Table 2 and thus stabilizes high oxidation states. This effect of lowering redox potentials is similar to that detected in the complex [Ru(bda)(pic)2] where bda = 2,2′-bipyridine-6,6′-dicarboxylic acid and pic = 4-picoline, which is a robust catalyst for water oxidation.31
Table 2 Electrochemical data for complexes 1, 2 and [Ru(trpy)(bpy)(OH2)]2+
| Complex |
E1/2 (V vs. NHE) |
| RuIII/II |
RuIV/III |
RuV/IV |
| In CH2Cl2 (TBAH 0.1 M). Measured at pH = 1. Ref. 28. |
| 1a |
0.62 |
— |
— |
| 2b |
0.71 |
1.15 |
1.37 |
| [Ru(trpy)(bpy)(OH2)]2+c |
0.87 |
1.11 |
1.65 |
 |
| | Fig. 3 CV of 2 in aqueous solution (Britton–Robinson buffer at pH = 1), at a scan rate of v = 100 mV s−1. | |
In order to have a better insight about the PCET (proton-coupled electron transfer) reactions involved in the catalytic process of water oxidation, Pourbaix diagrams (potential/pH diagrams) for 2 were built and are shown in Fig. 4. Complete differential pulse voltammograms at different pHs are shown in Fig. S11.† Fig. S12† shows the CV at four different potentials in order to confirm the assignments done by DPV. It can be deduced that the [RuII–OH2] species (where Ru represents the Ru polypyridyl core) remains stable over a wide range of pH values and deprotonation with formation of the [RuII–OH]+ species occur at pH = 11. Below pH = 3, one electron oxidation of [RuII–OH2] is pH independent, while between pH = 3 and pH = 11 the slope correlates with a 1e−/1H+ PCET. At pH < 3 the oxidation of [RuIII–OH2] is coupled with 2H+ abstraction; above pH = 3, one electron oxidation of [RuIII–OH] is coupled with the loss of 1H+ (as indicated by the slope value of ca. 0.059 V), thus forming a [RuIV![[double bond, length as m-dash]](https://www.rsc.org/images/entities/char_e001.gif) O] complex. As shown in Table 2, the potential of the [RuIVO] → [RuVO] couple of complex 2 is ca. 0.3 V lower than that of [Ru(trpy)(bpy)(OH2)]2+ and remains stable between pH = 1.25 and pH = 7.56, important issues to be considered in designing better WOCs (water oxidation catalysts). The diagram of Fig. 4 is almost identical to those found for the recently reported complexes cis- and trans-[RuII(trpy)(qc)(OH2)]+, where qc = 8-quinoline-carboxylate,32 which exhibit good performances as WOCs, thus evidencing that complex 2 is a promising candidate for catalysing one of the key steps in artificial photosynthesis.18
O] complex. As shown in Table 2, the potential of the [RuIVO] → [RuVO] couple of complex 2 is ca. 0.3 V lower than that of [Ru(trpy)(bpy)(OH2)]2+ and remains stable between pH = 1.25 and pH = 7.56, important issues to be considered in designing better WOCs (water oxidation catalysts). The diagram of Fig. 4 is almost identical to those found for the recently reported complexes cis- and trans-[RuII(trpy)(qc)(OH2)]+, where qc = 8-quinoline-carboxylate,32 which exhibit good performances as WOCs, thus evidencing that complex 2 is a promising candidate for catalysing one of the key steps in artificial photosynthesis.18
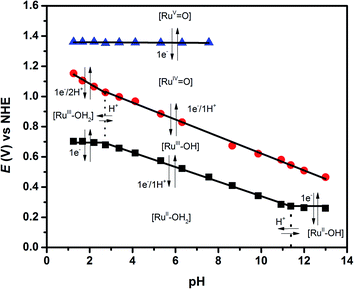 |
| | Fig. 4 Pourbaix diagrams of 2 at r.t. | |
Water oxidation catalysis
We have performed chemical water oxidation by using 30 equivalents of Ce(IV) in HClO4 0.1 M as an oxidant in a total volume of 7.5 mL at T = 20 °C, using complex 2 in the range between 2 × 10⁻⁵ M to 4 × 10⁻⁵ M with a Clark electrode according to Badiei33,34 during 15 minutes. Fig. S13† shows that the amount of oxygen evolved increases almost linearly with time, suggesting that O2 is generated by a unimolecular reaction, in agreement with previously reported mononuclear Ru(II) aquo complexes.25,26 Fig. S14† shows the logvO2 vs. log[cat]. The experimental TON value was 6.7, very close the theoretical value of 7.5, indicating a high degree of recovery. The TOF value was 1.5 × 10⁻³ s−1, which falls within the expected range for Ru(II) polypyridyl complexes.
Ligand substitution kinetics
The greater Ru–Cl bond length in 1 respect to [RuCl(trpy)(bpy)](PF6) and [RuCl(trpy)(bpy-OMe)]Cl, mentioned in the Crystal structure section, predicts that the rate of substitution of chloride by acetonitrile should be enhanced. It is also well known that chloride is rapidly substituted by water in aqueous solutions in these complexes.24 We have previously used changes in UV-vis spectra as benchmarks to follow the kinetics of substitution processes in analogous complexes of the type [Ru(trpy)(4,4-(X)2-bpy)(OH2)]2+ and proved that the bond strength between Ru and the O atom of a leaving water molecule becomes weaker when increasing the electronic density of the metal by the introduction of a stronger electron donating substituent X trans- to H2O in a bpy ring.16
As shown in Fig. 5, complete replacement of H2O by CH3CN in 2 in aqueous solutions shifts the MLCT to the blue in about 30 min at pseudo-first order conditions, I = 0.1 M and T = 50 °C. Isosbestic points are detected and remain stable at 469, 394, 337, 277 and 255 nm, indicating the co-existence of two stable species, according to the following reaction:
| |
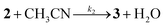 | (1) |
and
k2 is calculated as:
| | |
−[2]/dt = k2 [CH3CN][2] = kobs [2]
| (2) |
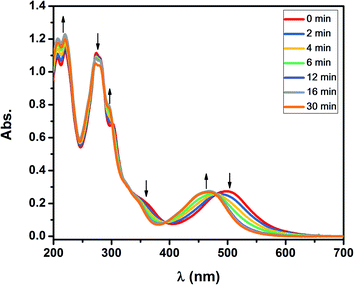 |
| | Fig. 5 UV-vis absorption changes in aqueous solutions as a function of time for complex 2 (C ≃ 3.3 × 10⁻⁵ M), [CH3CN] = 0.74 M, I = 0.1 M, T = 50 °C. | |
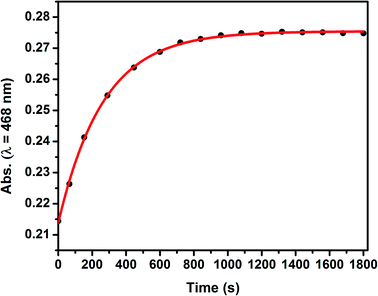
The value of k2 = 3.4 × 10⁻³ M−1 s−1, obtained by fitting the decay of the exponential function of absorbance vs. time at λ = 468 nm, as shown in Fig. 6, is almost three times higher than the corresponding value reported for [Ru(trpy)(bpy)(OH2)]2+ (k2 = 1.2 × 10⁻³ M−1 s−1).16 A cooperative effect between both polypyridyl ligands with electron donating groups in the polypyridyl rings of 2 is thus disclosed, leading to the conclusion that this complex – or its precursor 1 – can also be applied to accelerate the detection of acetonitrile as a contaminant in radiopharmaceuticals used in PET studies. We thus propose that an aliquot of the ruthenium complexes described in this work can be added to a radiopharmaceutical to detect acetonitrile. The concentration of CH3CN used in the experiments (0.74 M) corresponds to 3% of CH3CN, which falls within the order of the highest limit usually allowed for this contaminant.17 The detection limit of 3% can be diminished to less than 1% by using less acetonitrile or extending the time of measurement, as usually expected for a kinetic method of analysis, such as the one described here. Besides, at a fixed temperature and time, a calibration curve can be constructed to determine the limit of detection (LoD) of acetonitrile by measuring the absorbance changes at λ = 468 nm at different concentrations of CH3CN. Furthermore, using this spectroscopic method for detecting acetonitrile is much more sensible than resorting to an electrochemical method, since the observed changes in the UV-visible spectra are much higher in amplitude than those observed in the redox potentials when replacing water by acetonitrile. It can be envisaged that other transition metal complexes can be used for detecting acetonitrile; for example, Cu(I) does coordinate strongly to acetonitrile. However, the Ru(II) complexes described in this work are very stable in air, in contrast to Cu(I) complexes, and therefore are more promising candidates to sense acetonitrile without the need to exclude oxygen.
 |
| | Fig. 6 Absorbance monitored at λ = 468 nm in aqueous solution as a function of time for complex 2 (C ≃ 3.3 × 10⁻⁵ M), [CH3CN] = 0.74 M, I = 0.1 M, T = 50 °C. | |
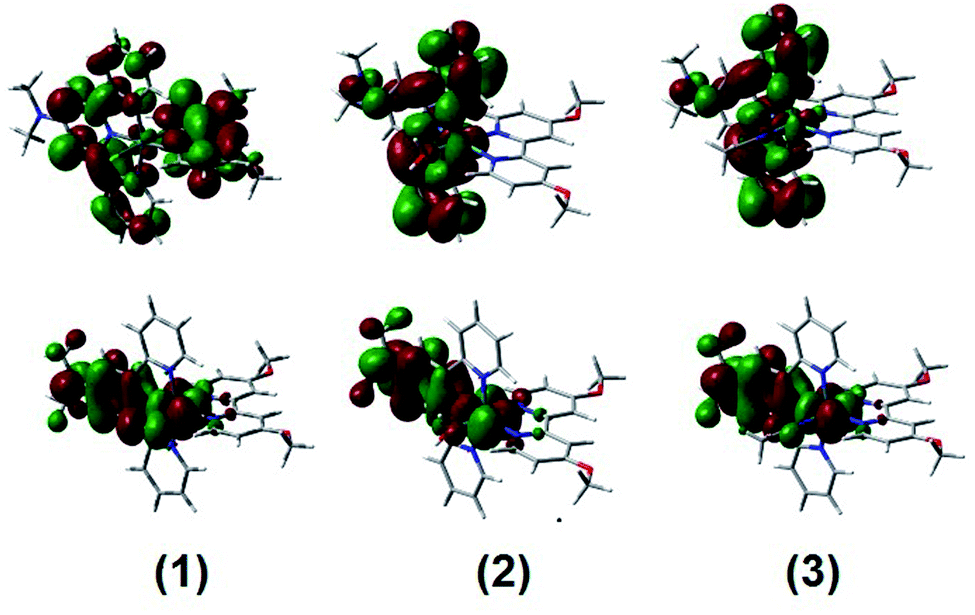
DFT and TD-DFT calculations
DFT and TD-DFT calculations were carried out to support the experimental data obtained for complexes 1, 2 and 3. Fig. 7 and Table S4† show the energy levels and the group contributions to the molecular orbitals (MOs) of the synthesized complexes. Fig. 8 shows the diagrams of some selected MOs. The HOMOs of the three complexes are mainly centered in the ruthenium atom with a considerable contribution from the terpyridyl ring with the dimethylamino group. Mixing between MOs centered in the metal center and 4,4′-(N(CH3)2)2-bpy ligands has been recently reported for heteroleptic Ru bipyridyl complexes.35 On the other hand, this stabilization of the HOMOs increases in the series when going from 1 to 3 and correlates with the trend observed in the maximum absorption of the lowest energy MLCT bands, as described in the UV-vis spectroscopy section. In complex 1, the LUMO is delocalized over the ligands with a main contribution of (bpy-OMe) and equal contributions from the pyridyl rings of trpy, while in complexes 2 and 3 the LUMOs are mainly centred in the trpy rings with a concomitant energy stabilization respect to 1.
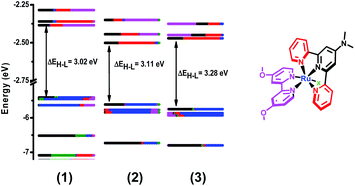 |
| | Fig. 7 Left: MO energy levels and group contributions of complexes 1, 2 and 3. Right: molecular structure and color designation of the different groups of the three species. X = Cl− 1, OH2 2 and NCCH3 3. | |
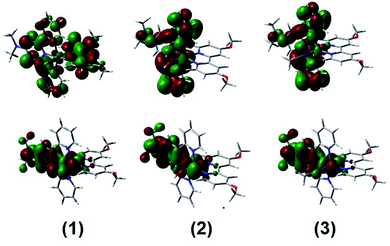 |
| | Fig. 8 MO diagrams of the LUMOs (upper graphs) and the HOMOs (lower graphs) of complexes 1, 2 and 3. | |
UV-vis spectra and transitions calculated by TD-DFT, experimental spectra and EDDM for selected transitions are shown in Fig. 9. The assignments reported in the UV-vis spectroscopy section are confirmed by these calculations. The contributions of the MO's to some chosen transitions are detailed in Tables S5–S7.† Selected EDDM (electronic difference density maps) are shown in Fig. S15.† The transition with the highest oscillator strength between 400 and 600 nm changes its MO's contributions from H−2 → L in 1 to H−2 → L+1 in 2 and 3. An additional feature for this transition is that involves different dπ(Ru) donor orbitals, changing from dxz for 1 to dyz for 2 and 3. Transitions detected below 300 nm present a mixed behavior of MLCT and IL transitions.
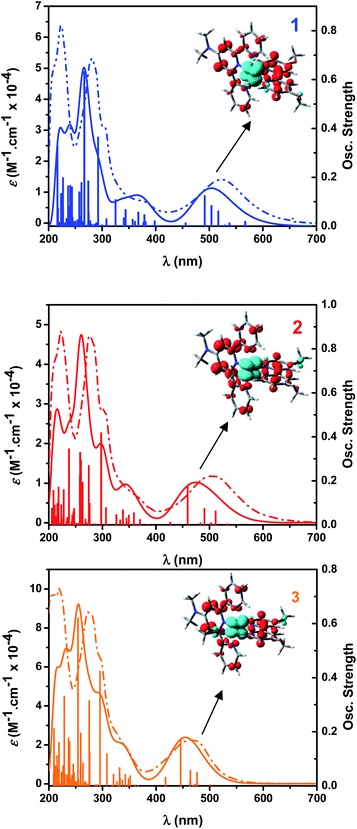 |
| | Fig. 9 Calculated (solid lines) and experimental (dashed lines) UV-visible spectra of complexes 1, 2 and 3. Calculated transitions are represented as vertical bars. Inset: EDDM of the lowest lying MLCT bands are included for all complexes, in which turquoise and red colors indicate the regions of decreased and increased electron density, respectively. | |
These computational results can also be used to explain the electrochemical data. In fact, the lowering in energy of the LUMOs stabilizes the oxidation state (II) of the metal center when going from 1 to 2 and thus the redox potential of the RuIII/II couple is increased, as shown in Table 2. The UV-visible spectra calculated by TD-DFT agree reasonably well with the experimental UV-visible spectra for complexes 1–3, as shown in Fig. 9. Considering the correlation between spectroscopic and electrochemical properties stated in the previous sentence, we can infer that the effects of the substituents of the polypyridyl ligands on the spectroscopic and electrochemical properties that were discussed in the corresponding sections are consistent with the output from the computational studies.
Experimental section
Materials and instrumentation
All chemicals used in this work were analytical-reagent grade and used without further purification. RuCl3·3H2O, FeSO4·(NH4)2SO4·6H2O, dimethylamine, 4′-Cl-trpy and bpy-OMe were purchased from Aldrich. Chemical analyses and MS spectra were obtained at the University of Girona, Spain, and at INQUIMAE (University of Buenos Aires, Argentina). UV-visible spectra were recorded on a Varian Cary 50 spectrophotometer, using 1 cm quartz cells. Kinetic measurements were carried out on a Hewlett-Packard 8453 Diode-Array spectrophotometer connected to a bath thermostatized to ±0.5 °C. Infrared spectra (IR) were obtained using KBr pellets with a PerkinElmer Spectrum RX-I FTIR spectrometer. NMR spectra were acquired at 298 K on a Bruker AVANCE II 400 spectrometer equipped with a BBI probe. Cyclic voltammetry (CV) and differential pulse voltammetry (DPV) experiments were performed using a BAS Epsilon EC equipment, with vitreous C as working electrode, Pt wire as auxiliary electrode, and Ag/AgCl (3 M NaCl) as reference electrode. CV experiments were carried out at a scan rate of v = 100 mV s−1. All potentials were converted to NHE. E1/2 values were extracted from CV measurements as the averages between the anodic (Ea) and cathodic (Ec) peak potentials: E1/2 = (Ec + Ea)/2. For the construction of the Pourbaix diagrams, Britton–Robinson buffers were used (0.04 M H3BO3, 0.04 M H3PO4 and 0.04 M CH3COOH) and potentials (E) were obtained by differential pulse voltammetry (DPV). The pH measurements were done with a Metrohm 744 pHmeter, calibrated with commercial buffer solutions of pH = 4.00, pH = 7.00 and pH = 10.00 before measurements.
Computational procedures
DFT calculations were carried out with Gaussian-03 program package.36 All molecules were optimized using the Becke's three-parameter hybrid functional B3LYP,37 with the local term of Lee, Yang, and Parr.38 LANL2DZ basis set was used for all atoms and Ru was described with Los Alamos ECP.39 No symmetry restrictions were placed on the geometry optimizations and, depending on the spin multiplicity, restricted or unrestricted Kohn–Sham approximations were taken into account. Tight convergence criteria were used for geometry optimizations and ultrafine grid in all calculations. To include solvent polarization effects, the calculations were done by using the conductor-like polarizable continuum model (CPCM).40 The contribution of different groups on the orbitals, electron density difference maps (EDDM), calculated UV-vis spectra and transitions related to them were obtained using the GaussSum Version 2.2 Program.41 UV-vis profiles were obtained by considering a typical half-bandwidth of Δν1/2 = 3000 cm−1 for all electronic transitions. TD-DFT calculations were done by considering 100 states to simulate all UV-vis spectra.
Syntheses of Me2Ntrpy and Ru(Me2Ntrpy)Cl3
The ligand Me2Ntrpy and the precursor Ru(Me2Ntrpy)Cl3 were synthesized by following previously reported methods with small modifications,19 that included the replacement of FeCl2 by FeSO4·(NH4)2SO4·6H2O and using an inert atmosphere by bubbling Ar in the reaction vessel.
Synthesis of [RuCl(Me2Ntrpy)(bpy-OMe)]Cl·2H2O, 1·2H2O
120 mg of Ru(Me2Ntrpy)Cl3 (0.25 mmol), 54 mg of bpy-OMe (0.25 mmol), 52 mg of LiCl (1.23 mmol) and 46 μL of Et3N where placed in a 50 mL round bottom flask with 18 mL of ethanol and heated at reflux for 4 h under Ar. The formed purplish solution was evaporated to dryness. Recrystallization was repeated 2 times with an ether/ethanol (3:1) mixture. The obtained solid was purified by chromatography on a neutral Al2O3 column (30 × 2 cm), eluting with a toluene/acetone/methanol (2.5:1:1 v/v) solution. The first eluted band, containing the desired product, was collected, concentrated on a rotary evaporator and the resulting solid was recrystallized from ethanol/ether (1:10). The obtained dark blue solid was dried over P4O10 under vacuum for 24 h. Yield 65 mg (41.7%). C29H34Cl2N6O5Ru (718.60): calcd (%) C 48.5, H 4.8, N 11.7; found (%): C 48.2, H 4.4, N, 11.5. IR (KBr, cm−1): 3130w and 2800w of symmetric and asymmetric C–H stretchings of the N(CH3)2 and the OCH3 substituents, 1612s, 1596sh of CC stretching of the substituted py rings in trpy and bpy, 1486m of CN and CC stretching of trpy, 1317m of symmetric bend and CC of the bpy, 1038 and 1011 of breathing modes of the pyridyl rings of bpy. 1H-NMR (400 MHz, CD3OD): δ 9.87 (d, 1H, H25, 3JHH = 6.47 Hz), 8.49 (d, 2H, H4, H12, 3JHH = 7.96 Hz), 8.30 (d, 1H, H22, 4JHH = 2.53 Hz), 8.04 (d, 1H, H19, 4JHH = 2.64 Hz), 7.91 (s, 2H, H7, H9), 7.84 (td, 2H, H3, H13, 3JHH = 1.30, 7.80 Hz), 7.75 (d, 2H, H1, H15, 3JHH = 5.45 Hz), 7.56 (dd, 1H, H24, 3JHH = 6.44, 4JHH = 2.71 Hz), 7.25 (td, 2H, H2, H14, 3JHH = 7.48, 5.68, 4JHH = 1.38 Hz), 7.15 (d, 1H, H16, 3JHH = 6.59), 6.68 (dd, 1H, H2, 3JHH = 6.57, 4JHH = 2.74), 4.19 (s, 3H, H28), 3.86 (s, 3H, H29), 3.41 (s, 6H, H26, H27) ppm. 13C-NMR (100 MHz, CD3OD): δ 167.8 (C23), 167.1 (C18), 161.6 (C20, C5, C11), 159.5 (C21), 158.4 (C6, C10), 155.9 (C8), 154.6 (C25), 153.7 (C1, C15), 153.2 (C16), 137.4 (C3, C13), 127.7 (C2, C14), 124.2 (C4, C12), 114.3 (C24), 114.0 (C17), 111.1 (C19, C22), 106.9 (C7, C9), 57.1 (C28), 56.9 (C29), 40.4 (C26, C27) ppm. 15N-NMR (40 MHz, CD3OD): δ 265.3 (N4), 253.4 (N2, N5), 238.4 (N1), 223.0 (N6) ppm. ESI MS ion clusters at m/z = 629.2 [M-35Cl]+, 631.1 [M-37Cl]+.
Synthesis of [Ru(Me2Ntrpy)(bpy-OMe)(OH2)](CF3SO3)2·2H2O, 2·2H2O
60 mg of 1·2H2O (0.086 mmol) and 48.6 mg of Ag(CF3SO3) (0.189 mmol) where placed in a 20 mL round bottom flask with 10 mL of an acetone/water (3:1) mixture and heated at reflux in the dark for 4 h. The reddish solution was filtered through celite to separate AgCl and the filtrate was evaporated to dryness. The obtained red solid was recrystallized twice from acetone/ether (1:10) and dried over P4O10 for 24 h. Yield: 60 mg (74.4%). C31H34F6N6O11S2Ru (945.84): calcd (%): C 39.4; H 3.6, N 8.9; found (%): C 39.6, H 3.1, N 8.8. 1H-NMR (400 MHz, (CD3)2CO): δ 9.48 (d, 1H, H25, 3JHH = 6.36 Hz), 8.70 (d, 2H, H4, H12, 3JHH = 8.02 Hz), 8.47 (d, 1H, H22, 4JHH = 2.49 Hz), 8.21 (d, 1H, H19, 4JHH = 2.65 Hz), 8.07 (s, 2H, H7, H9), 8.07–7.89 (m, 4H, H3, H13, H1, H15), 7.75 (d, 1H, H24, JHH = 3 Hz), 7.41 (td, 2H, H2, H14, 3JHH = 7.50, 5.70, 4JHH = 1.30 Hz), 7.36 (d, 1H, H16, 3JHH = 6.57), 6.83 (dd, 1H, H2, 3JHH = 6.43, 4JHH = 2.59), 4.24 (s, 3H, H28), 3.92 (s, 3H, H29), 3.50 (s, 6H, H26, H27) ppm. 13C-NMR (100 MHz, CDCl3): δ 167.5 (C23, C18), 161.4 (C20, C5, C11), 158.3 (C21), 158.3 (C6, C10), 154.4 (C8), 152.8 (C25), 154.7 (C1, C15), 138.5 (C3, C13), 128.4 (C16), 127.8 (C2, C14), 124.3 (C4, C12), 114.8 (C24), 114.1 (C17), 111.2 (C19, C22), 107.2 (C7), 107.6 (C9), 57.2 (C28), 56.9 (C29), 40.6 (C26, C27) ppm. ESI MS ion clusters at m/z = 743.1 [M-(OTf)-H2O]+.
Crystal structure determination
A black needle-like specimen of 1Cl·3H2O, of approximate dimensions 0.060 mm × 0.120 mm × 0.500 mm, was used for the X-ray crystallographic analysis. The X-ray intensity data were measured on a D8 QUEST ECO three-circle diffractometer system equipped with a Ceramic X-ray tube (Mo Kα, λ = 0.71076 Å) and a doubly curved silicon crystal Bruker Triumph monochromator. A total of 1088 frames were collected. The total exposure time was 2.72 hours. The frames were integrated with the Bruker SAINT software package using a narrow-frame algorithm. The integration of the data using a triclinic unit cell yielded a total of 110330 reflections to a maximum θ angle of 29.11° (0.73 Å resolution), of which 8564 were independent (average redundancy 12.883, completeness = 99.7%, Rint = 6.39%, Rsig = 2.95%) and 7188 (83.93%) were greater than 2σ(F2). The final cell constants: a = 10.869(13) Å, b = 11.422(13) Å, c = 14.735(17) Å, α = 107.961°, β = 110.491°, γ = 94.301°, volume = 1595.1 Å3, were based upon the refinement of the XYZ-centroids of 9591 reflections above 20σ(I) with 5.811° < 2θ < 58.27°. Data were corrected for absorption effects using the multi-scan method (SADABS). The ratio of minimum to maximum apparent transmission was 0.885. The calculated minimum and maximum transmission coefficients (based on crystal size) are 0.6599 and 0.7458. The structure was solved and refined using the Bruker SHELXTL Software Package, using the space group P![[1 with combining macron]](https://www.rsc.org/images/entities/char_0031_0304.gif) , with Z = 2 for the formula unit, C29H36Cl2N6O6Ru. The final anisotropic full-matrix least-squares refinement on F2 with 401 variables converged at R1 = 4.45%, for the observed data and wR2 = 12.00% for all data. The goodness-of-fit was 1.057. The largest peak in the final difference electron density synthesis was 3.604 e− Å−3 and the largest hole was −2.276 e− Å−3 with an RMS deviation of 0.126 e− Å−3. On the basis of the final model, the calculated density was 1.533 g cm−3 and F(000), 756 e−.
, with Z = 2 for the formula unit, C29H36Cl2N6O6Ru. The final anisotropic full-matrix least-squares refinement on F2 with 401 variables converged at R1 = 4.45%, for the observed data and wR2 = 12.00% for all data. The goodness-of-fit was 1.057. The largest peak in the final difference electron density synthesis was 3.604 e− Å−3 and the largest hole was −2.276 e− Å−3 with an RMS deviation of 0.126 e− Å−3. On the basis of the final model, the calculated density was 1.533 g cm−3 and F(000), 756 e−.
Conclusions
New ruthenium complexes of formulae [Ru(Me2Ntrpy)(bpy-OMe)(X)]n+ (with X = Cl−, H2O; n = 1, 2) were synthesized as Cl− and CF3SO3− salts and characterized by spectroscopic and electrochemical techniques. The introduction of strongly electron donating groups such as –N(CH3)2 and –OCH3 in the trpy and bpy rings respectively weakens the Ru–Cl and Ru–O bond orders and therefore increases the rate of substitution of water by acetonitrile respect to Ru complexes with unsubstituted bpy and trpy ligands, thus contributing to faster detection of acetonitrile in radiopharmaceutical reagents used in PET studies. On the other hand, introduction of the –N(CH3)2 substituent in the trpy ring proved to be an efficient approach to lower the redox potentials of the Ru couples of the aquo complex, an effect with impact in designing better WOC's than those already studied. The experimental data were rationalized with the aid of DFT and TD-DFT calculations.
Author contributions
P. O. Abate, A. M. Peyrot, X. Fontrodona and I. Romero: data curation, investigation and methodology. F. Fagalde and N. E. Katz: supervision, writing, review and editing.
Conflicts of interest
There are no conflicts to declare.
Acknowledgements
We thank Consejo Nacional de Investigaciones Científicas y Técnicas (CONICET), Agencia Nacional de Promoción Científica y Tecnológica (ANPCyT) and Universidad Nacional de Tucumán (UNT), all from Argentina, for financial support. P. O. A. and A. M. P. thank CONICET for graduate fellowships. F. F. and N. E. K. are Members of the Research Career (CONICET).
Notes and references
- N. E. Katz, Sci. Rev., 2020, 1, 25–44 Search PubMed.
- X. Sala, I. Romero, M. Rodríguez, L. Escriche and A. Llobet, Angew. Chem., Int. Ed., 2009, 48, 2842–2852 CrossRef CAS PubMed.
- S. Romain, L. Vigara and A. Llobet, Acc. Chem. Res., 2009, 42, 1944–1953 CrossRef CAS PubMed.
- J. J. Concepción, J. W. Jurss, M. K. Brennaman, P. G. Hoertz, A. O. T. Patrocinio, N. Y. Murakami Iha, J. L. Templeton and T. J. Meyer, Acc. Chem. Res., 2009, 42, 1954–1965 CrossRef PubMed.
- T. J. Meyer and M. H. V. Huynh, Inorg. Chem., 2003, 42, 8140–8160 CrossRef CAS PubMed.
- M. H. V. Huynh and T. J. Meyer, Chem. Rev., 2007, 107, 5004–5064 CrossRef CAS PubMed.
- D. R. Weinberg, C. J. Gagliardi, J. F. Hull, C. F. Murphy, C. A. Kent, B. C. Westlake, A. Paul, D. H. Ess, D. Granville McCafferty and T. J. Meyer, Chem. Rev., 2012, 112, 4016–4093 CrossRef CAS PubMed.
- I. Romero, M. Rodríguez, C. Sens, J. Mola, M. R. Kollipara, L. Francàs, E. Mas-Marza, L. Escriche and A. Llobet, Inorg. Chem., 2008, 47, 1824–1834 CrossRef CAS PubMed.
- B. Limburg, E. Bouwman and S. Bonnet, Coord. Chem. Rev., 2012, 256, 1451–1467 CrossRef CAS.
- M. D. Karkas, O. Verho, E. V. Johnston and B. Åkemark, Chem. Rev., 2014, 114, 11863–12001 CrossRef PubMed.
- X. Sala, S. Maji, R. Bofill, J. García-Antón, L. Escriche and A. Llobet, Acc. Chem. Res., 2014, 47, 504–516 CrossRef CAS PubMed.
- Q. Zeng, F. W. Lewis, L. M. Harwood and F. Hartl, Coord. Chem. Rev., 2015, 304–305, 88–101 CrossRef CAS.
- L. Francàs, R. Bofill, J. García-Antón, L. Escriche, X. Sala and A. Llobet, Chapter 3: Ru-Based Water Oxidation Catalyst, in Molecular Water Oxidation Catalysis: A Key Topic for New Sustainable Energy Conversion Schemes, John Wiley & Sons, Ltd, UK, 2014, p. 29 Search PubMed.
- J. J. Concepción, M. K. Tsai, J. T. Muckerman and T. J. Meyer, J. Am. Chem. Soc., 2010, 132, 1545–1557 CrossRef PubMed.
- J. J. Concepción, J. W. Jurss, M. R. Norris, Z. Chen, J. L. Templeton and T. J. Meyer, Inorg. Chem., 2010, 49, 1277–1279 CrossRef PubMed.
- J. H. Mecchia Ortiz, A. M. Peyrot, F. Fagalde and N. E. Katz, Inorg. Chem. Commun., 2018, 98, 44–47 CrossRef CAS.
- J. C. Hung, J. Nucl. Med., 2002, 43, 1495–1506 CAS.
- D. J. Wasylenko, C. Ganesamoorthy, M. A. Henderson, B. D. Koivisto, D. Osthoff and C. P. Berlinguette, J. Am. Chem. Soc., 2010, 132, 16094–16106 CrossRef CAS PubMed.
- E. C. Constable, A. M. W. C. Thompson, D. A. Tocher and M. A. Daniels, New J. Chem., 1992, 16, 855–867 CAS.
- D. C. Ware, P. A. Lay, H. Taube, M. H. Chou and C. Creutz, in Inorganic Syntheses, ed. J. M. Shreeve, Wiley, 1986, vol. 24, pp. 299–300 Search PubMed.
- V. S. Mane, A.
S. Kumbhar and R. P. Thummel, J. Chem. Soc., Dalton Trans., 2017, 46, 12901–12907 RSC.
- H. J. Jang, S. L. Hopkins, M. A. Siegler and S. Bonnet, J. Chem. Soc., Dalton Trans., 2017, 46, 9969–9980 RSC.
- E. Manrique, X. Fontrodona, M. Rodríguez and I. Romero, Eur. J. Inorg. Chem., 2019, 15, 2124–2133 CrossRef.
- E. Jakubikova, W. Chen, D. M. Dattelbaum, F. N. Rein, R. C. Rocha, R. L. Martin and E. R. Batista, Inorg. Chem., 2009, 48, 10720–10725 CrossRef CAS PubMed.
- D. C. Marelius, B. Salome, D. J. Charboneau, K. M. Schroeder, J. M. Kamdar, A. R. McGetigan, B. J. Freeman, C. E. Moore, A. L. Rheingold, A. L. Cooksy, D. K. Smith, J. J. Paul, E. T. Papish and D. G. Grotjahn, Eur. J. Inorg. Chem., 2014, 676–689 CrossRef CAS.
- S. Watabe, Y. Tanahashi, M. Hirahara, H. Yamazaki, K. Takahashi, E. A. Mohamed, Y. Tsubonouchi, Z. N. Zahran, K. Saito, T. Yui and M. Yagi, Inorg. Chem., 2019, 58(19), 12716–12723 CrossRef CAS PubMed.
- B. J. Coe and S. J. Glenwrigth, Coord. Chem. Rev., 2000, 203, 5–80 CrossRef CAS.
- D. J. Wasylenko, C. Ganesamoorthy, B. D. Koivisto, M. A. Henderson and C. P. Berlinguette, Inorg. Chem., 2010, 49, 2202–2209 CrossRef CAS PubMed.
- F. Fagalde, N. D. Lis de Katz and N. E. Katz, Polyhedron, 1997, 16, 1921–1923 CrossRef CAS.
- F. Fagalde and N. E. Katz, J. Chem. Soc., Dalton Trans., 1993, 571–575 RSC.
- L. Duan, A. Fischer, Y. Xu and L. Sun, J. Am. Chem. Soc., 2009, 131, 10397–10399 CrossRef CAS PubMed.
- M. A. Hoque, A. D. Chowdhury, S. Maji, J. Benet-Buchholz, M. Z. Ertem, C. Gimbert-Suriñach, G. K. Lahiri and A. Llobet, Inorg. Chem., 2021, 60, 5791–5803 CrossRef CAS PubMed.
- G. Renderos, T. Aquino, K. Gutierrez and Y. M. Badiei, J. Chem. Educ., 2017, 94(7), 922–927 CrossRef CAS.
- Y. M. Badiei, Y. Xie and G. Renderos, J. Catal., 2019, 369, 10–20 CrossRef CAS.
- F. F. Salomón, N. C. Vega, T. Parella, F. E. Morán Vieyra, C. D. Borsarelli, C. Longo, M. Cattaneo and N. E. Katz, ACS Omega, 2020, 5, 8097–8107 CrossRef PubMed.
- M. J. Frisch, G. W. Trucks, H. B. Schlegel, G. E. Scuseria, M. A. Robb, J. R. Cheeseman, J. A. Montgomery Jr, T. Vreven, K. N. Kudin, J. C. Burant, J. M. Millam, S. S. Iyengar, J. Tomasi, V. Barone, B. Mennucci, M. Cossi, G. Scalmani, N. Rega, G. A. Petersson, H. Nakatsuji, M. Hada, M. Ehara, K. Toyota, R. Fukuda, J. Hasegawa, M. Ishida, T. Nakajima, Y. Honda, O. Kitao, H. Nakai, M. Klene, X. Li, J. E. Knox, H. P. Hratchian, J. B. Cross, V. Bakken, C. Adamo, J. Jaramillo, R. Gomperts, R. E. Stratmann, O. Yazyev, A. J. Austin, R. Cammi, C. Pomelli, J. W. Ochterski, P. Y. Ayala, K. Morokuma, G. A. Voth, P. Salvador, J. J. Dannenberg, V. G. Zakrzewski, S. Dapprich, A. D. Daniels, M. C. Strain, O. Farkas, D. K. Malick, A. D. Rabuck, K. Raghavachari, J. B. Foresman, J. V. Ortiz, Q. Cui, A. G. Baboul, S. Clifford, J. Cioslowski, B. B. Stefanov, G. Liu, A. Liashenko, P. Piskorz, I. Komaromi, R. L. Martin, D. J. Fox, T. Keith, M. A. Al-Laham, C. Y. Peng, A. Nanayakkara, M. Challacombe, P. M. W. Gill, B. Johnson, W. Chen, M. W. Wong, C. Gonzalez and J. A. Pople, Gaussian 03, Revision C.02, Gaussian, Inc., Wallingford CT, 2004 Search PubMed.
- A. D. J. Becke, J. Chem. Phys., 1993, 98, 5648–5652 CrossRef CAS.
- C. Lee, W. Yang and R. G. Parr, Phys. Rev. B: Condens. Matter Mater. Phys., 1988, 37, 785–789 CrossRef CAS PubMed.
- P. J. Hay and W. R. Wadt, J. Chem. Phys., 1985, 82, 270–283 CrossRef CAS.
- V. Barone and M. Cossi, J. Phys. Chem. A, 1998, 102, 1995–2001 CrossRef CAS.
- N. M. O'Boyle, A. L. Tenderholt and K. M. Langner, J. Comput. Chem., 2008, 29, 839–845 CrossRef PubMed.
Footnote |
| † Electronic supplementary information (ESI) available: ESI-MS spectrum of 1 in Fig. S1, NMR data of 1 in Fig. S2–S8, crystal structure of 1 in Fig. S9 and crystal data in Tables S1–S3, view of crystal layers in Fig. S10. In Fig. S11 and S12 DPV and CV vs. pH of 2. In Fig. S13 and S14 [O2] vs. t and logvO2 vs. log[cat.] and for complex 2. In Fig. S15, energies and percent contributions of selected MOs of 1–3, selected electronic transitions with their group contributions for 1–3 in Tables S5–S7 and selected EDDM in Fig. S15. CCDC 2097399. For ESI and crystallographic data in CIF or other electronic format see DOI: 10.1039/d1ra09455f |
|
| This journal is © The Royal Society of Chemistry 2022 |
Click here to see how this site uses Cookies. View our privacy policy here. 
 Open Access Article
 This Open Access Article is licensed under a Creative Commons Attribution-Non Commercial 3.0 Unported Licence
 *a and
Néstor E. Katz*a
*a and
Néstor E. Katz*a