 Open Access Article
White light tuning and temperature sensing of NaLu(WO4)2:Ln3+ up-converting phosphor
Zhiyi Wang†
a,
Li Jiang†a,
Dongmei Wanga,
Jie Chengb,
Jingjing lib,
Yanhan Meib,
Shanshan Hu*a and
Jun Yang *a
*a
aSchool of Chemistry and Chemical Engineering, Southwest University, No. 2 Tiansheng Road, Beibei District, Chongqing 400715, China. E-mail: hushan3@swu.edu.cn; jyang@swu.edu.cn
bChongqing Songshuqiao Middle School, Chongqing 401147, China
First published on 5th April 2022
Abstract
NaLu(WO4)2:Ln3+ phosphors were synthesized via a hydrothermal method combined with subsequent calcination. Under excitation at 980 nm, 25%Yb3+, 0.5%Tm3+ and 25%Yb3+, 1%Ho3+-doped phosphors produce blue, green and red emissions. Namely, NaLu(WO4)2:25%Yb3+, 0.1%Ho3+, 0.1%Tm3+ nanocrystals show suitable intensities of blue, green, and red (RGB) emission, resulting in the production of perfect and bright white light with CIE-x = 0.3299 and CIE-y = 0.3293, which is very close to the standard equal energy white light illumination (x = 0.33, y = 0.33). Based on FIR theory, the temperature dependence of NaLu(WO4)2:20%Yb3+, 1%Er3+ was studied, and the maximum value of sensitivity was obtained as 1.38% K−1 at 543 K, which is better than that of previously reported temperature-sensing materials. It proves that the NaLu(WO4)2:Ln3+ phosphors have potential applications in white lighting, optical temperature measurement and other fields.
Introduction
In recent years, rare earth (RE) tungstates have been favored by a large number of researchers because of their excellent theoretical density and remarkable resistance to thermal, chemical, mechanical and optical damage. So far, these compounds are used in optical imaging, biological nanothermometers, LEDs, optical nanothermometers and dye-sensitized solar cells.1–5 RE double tungstates (ARE(WO4)2, A = alkali metal) are widely studied due to their excellent physical and chemical stability owing to their special scheelite structure. Hence, a lot of effort has recently been invested in the synthesis of Lu3+, La3+, Y3+ and Gd3+-based rare earth double tungstates, which have a controlled crystal shape, phase and size.4,6–8 Lu3+ in particular, which is located at the end of the rare earth elements and whose 4f orbital is fully filled with electrons, is widely regarded as an outstanding phosphorus matrix tungstate. Shi's team produced NaLu(WO4)2·2H2O by a hydrothermal reaction of Na2WO4·2H2O and Lu(NO3)3 and investigated the up/down conversion luminescence characteristics of the NaLu(WO4)2:Yb/Ln (Ln = Er, Ho, Tm) phosphor.6 Nexha et al.9 prepared Ho,Tm-doped KLu(WO4)2 nanocrystals through a modified sol–gel method, controlled the amount of doped ions to obtain different regular shapes of nanocrystals with a size of about 150 nm and explored the temperature dependence in the temperature range of 293 to 333 K under short-wave infrared excitation. Barrera et al.10 synthesized KLu(WO4)2:Yb3+, Tm3+, Ho3+ nanocrystals via an improved Pechini sol–gel method and studied the effect of Eu doping on the white light up-conversion of Yb-sensitized KLu(WO4)2:Ho3+, Tm3+ nanocrystals. The matrix material selected in this paper is NaLu(WO4)2, which will be an excellent candidate for temperature measurement and white light production.3,6,11RE doped up-conversion (UC) luminescence is an anti-Stokes process, which emits high-energy visible light under low-energy infrared excitation.12,13 So far, UC phosphors have been widely used in many fields and have developed rapidly. Recently, researchers have considered Yb3+/Er3+-doped up-conversion phosphors as candidates for optical temperature measurement.2,14 The importance of temperature in chemical reactions is self-evident and the accurate understanding of temperature change is extremely critical. There are various techniques for measuring temperature. In addition to traditional temperature measurement techniques, thermistors or thermocouples are also widely used. Optical thermometry based on UC phosphors is different from traditional thermometry.4,14,15 It is a non-contact temperature measurement method that has excellent thermal sensitivity and strong adaptive abilities. The principle of non-contact optical temperature measurement technology is based on the variation of the relative intensity of the emission band between two adjacent thermal coupling energy levels (2H11/2 and 4S3/2) of Er3+ with temperature.12Up to now, Yb3+/Er3+-doped UC phosphors, involving oxides, fluorides, tungstates and molybdates, are very popular in the field of optical temperature measurement.4,14,16–20 Compared with other compounds, tungstates have the advantages of simple preparation, outstanding physical, thermal and chemical stability, controllable size and morphology, etc. Therefore, they have general application prospects in the field of optical temperature measurement.
In recent decades, RE-doped UC white emission materials have attracted great attention due to their advantages of high energy efficiency, long life, low cost, and pro-environment nature.21 Based on the principle of the three primary colors, white light can be produced by mixing red, green and blue in a suitable ratio.21–24 Among the RE elements, Tm3+ is the most popular because of its blue and red emission bands.25,26 In the same material, UC white light is frequently obtained via triple-doping Yb3+, Ho3+ (Er3+), and Tm3+ in an appropriate mixing ratio. Mèndez-Ramos and colleagues prepared YF3:Ln3+ (Ln = Yb, Ho, Tm) phosphors via heat treatment of a sol–gel glass precursor, and obtained standard bright UC white light by controlling the doping ion concentration.27 Xu's group used a microwave hydrothermal method to synthesize the NaGd(WO4)2:Yb3+/Ho3+/Tm3+ phosphor, and added glycerin to change the particle size. Under near-infrared excitation, the NaGd(WO4)2:Yb3+/Ho3+/Tm3+ phosphor showed red, green, and blue emission at the same time with white light.28 However, so far there has been almost no report on the UC white emission of NaLu(WO4)2:Ln3+.
In this work, we successfully synthesized the NaLu(WO4)2:Ln3+ phosphor through a simple hydrothermal method and subsequent calcination. Under near infrared (NIR) excitation, the NaLu(WO4)2:Yb3+/Er3+ phosphor presented green emission, which was detected in the temperature range of 323–523 K and the maximum sensitivity was calculated; the standard white UC luminescence was obtained by triple-doping an appropriate atomic ratio of Yb3+, Ho3+ and Tm3+.
Experiments
Materials
Sodium tungstate (Na2WO4, AR), sodium hydroxide (NaOH, AR), nitric acid (HNO3, AR), lutetium oxide (Lu2O3, 99.99%), ytterbium oxide (Yb2O3, 99.99%), erbium oxide (Er2O3, 99.99%), holmium oxide (Ho2O3, 99.99%) and thulium oxide (Tm2O3, 99.99%) were used as raw materials. None of the materials were further purified. Lu2O3, Yb2O3, Er2O3, Ho2O3 and Tm2O3 were dissolved in concentrated nitric acid with heating and stirring until completely dissolved, excess nitric acid was evaporated at high temperature and finally diluted and cooled to obtain Lu(NO3)3, Yb(NO3)3, Er(NO3)3, Ho(NO3)3 and Tm(NO3)3 solutions, respectively.Synthesis of NaLu(WO4)2:Ln3+
NaLu(WO4)2:Ln3+ phosphors were prepared via a typical hydrothermal method with further calcination. The Ln(NO3)3 (Ln = Lu/Yb/Er/Ho/Tm) solution was added dropwise to 35 ml distilled water at room temperature, and stirred with a strong magnetic force for half an hour. Then, Na2WO4 was added to the above mixed solution, the pH of the mixed solution was adjusted to 8 with HNO3 or NaOH and stirred to obtain a white colloid. After 30 min, the colloid was transferred to a reaction kettle for a 200 °C thermostatic reaction for 12 h. Subsequently, the reaction mixture was cooled to room temperature and centrifuged, washed repeatedly with deionized water and ethanol, and dried at 70 °C for 12 h. Finally, it was evenly ground and calcined at 600 °C for 2 h to obtain the product.6Characterization
The crystal phase was detected using equipment (MSALXD3, using Cu Kα radiation (λ = 0.15405 nm)) provided by Beijing General Analysis General Instrument Co. The emission current and acceleration voltage are 20 mA and 26 kV, respectively. Additionally, the scanning range of 2θ is from 10° to 90°. The crystal morphology was analyzed using scanning electron microscopy (SEM, model S-4800) manufactured by Hitachi, Japan, with an acceleration voltage of 10 kV. A PerkinElmer instrument (model MDL-N-980-8W, ls55) was used to analyze the UC spectrum and temperature dependence of the wavelength from 400 to 750 nm.Results and discussion
Structural analysis
Fig. 1a displays the XRD patterns of NaLu(WO4)2 and NaLu(WO4)2:Ln3+. All diffraction peaks can be as attributed to the pure tetragonal NaLu(WO4)2 phase, highly compatible with the standard cards (JCPDS no. 27-0729). No additional diffraction peaks are detected, showing that high purity products are synthesized and that the Ln3+ ions (Ln = Yb, Er, Ho, Tm) were fully dissolved into NaLu(WO4)2 host. Moreover, the sharp diffraction peaks indicate the high crystallinity of the products, which signifies high luminous intensity. The ion radius of doped Ln3+ (r(Yb3+) = 0.86 Å, r(Er3+) = 0.88 Å, r(Ho3+) = 0.89 Å, r(Tm3+) = 0.87 Å) is larger than that of Lu3+ (r(Lu3+) = 0.85 Å), which leads to lattice expansion, and the diffraction peaks are slightly shifted to smaller 2θ values, as shown in Fig. 1b. It is worth noting that the XRD peaks of (112), (204) and (312) increase with Ln3+ doping, which indicates that larger radius ion doping is more likely to form smaller nanocrystals.29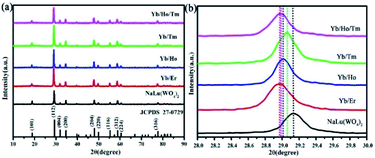 | ||
| Fig. 1 (a) XRD patterns of pure NaLu(WO4)2 and NaLu(WO4)2:Ln3+. (b) Enlarging the main diffraction peak of (112) from (a). | ||
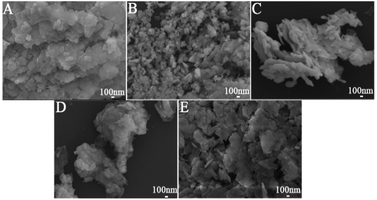
In general, the subsequent calcination temperature does not change the morphology of the product derived from its corresponding hydrothermal precursor. Fig. 2 displays the SEM morphologies of the calcined products with different doped ions at 600 °C. Ln3+ doping has little effect on crystal morphology, but the particle size decreases slightly. The size of the NaLu(WO4)2 nanocrystals decreases slightly with varying Ln3+ ion radius, which is also consistent with the XRD analysis result of Fig. 1b. A larger dopant ion radius can reduce the anisotropic growth rate of the crystal grains, which is the main reason for the size change of the NaLu(WO4)2:Ln3+ nanocrystals. When Ln3+ with a larger ionic radius replaces Lu3+, the exposed charge density of the NaLu(WO4)2 nanocrystals increases. The exposed charge density of the nanocrystals can significantly slow down the movement of the negatively charged WO42− ions to the surface due to the increase in charge repulsion, which leads to decrease size in the NaLu(WO4)2:Ln3+ nanocrystals.29–31
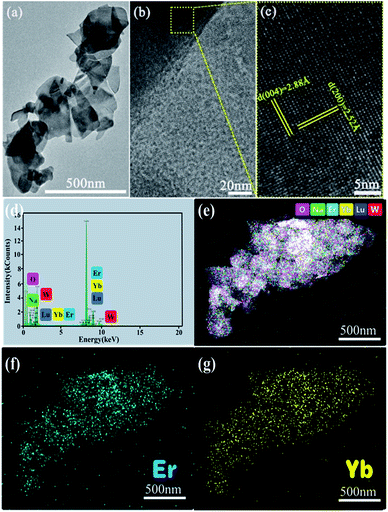
TEM analysis depicts nanosheets of the NaLu(WO4)2 crystals with a diameter of about 200–300 nm (Fig. 3a), which corresponds to the nanoplatelets observed in Fig. 2a. HR-TEM analysis (Fig. 3b and c) showed distinguishable lattice fringes with interplanar spacings of 2.88 Å and 2.52 Å, which can be classified as the (004) and (200) planes of tetragonal NaLu(WO4)2, respectively. In order to further prove the successful doping and uniform distribution of Yb3+ and Er3+ in the NaLu(WO4)2 matrix, we performed EDS tests and mapping analysis. The results are shown in Fig. 3d–e. In Fig. 3d, we can see that Na, Lu, Yb, Er, W and O elements are all detected in the product, which is consistent with the XRD results above. The overall distribution of various elements as well as Yb and Er in the product is shown in Fig. 3e–g, and the elements corresponding to different colors are shown in the upper right corner of Fig. 3e. Namely, we achieved uniform doping of Yb3+ and Er3+ in the NaLu(WO4)2 matrix, which provides support for us to explore the luminescence characteristics of the product in later experiments.
Luminescence of the NaLu(WO4)2:Ln3+ phosphors
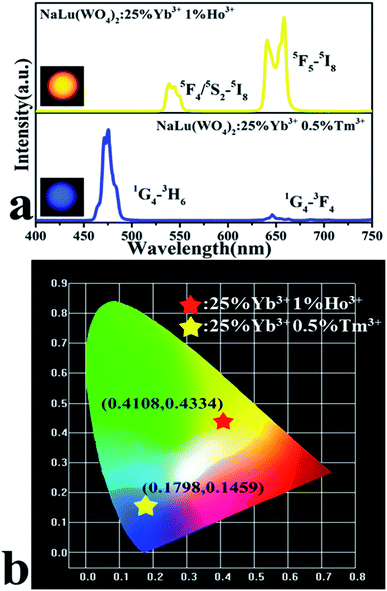
Fig. 4a shows the UC emission spectrum (400–750 nm) of NaLu(WO4)2:Ln3+ nanocrystals under excitation at 980 nm. The UC emission spectra of NaLu(WO4)2:25%Yb3+, 0.5%Tm3+ depicts strong blue emission at 475 nm and weak red emission at 647 nm, which are attributed to the 1G4 → 3H6 and 1G4 → 3F4 transitions of Tm3+, respectively. The emission spectrum of NaLu(WO4)2:25%Yb3+, 1%Ho3+ displays green emission that is mainly located at 539 nm due to the 5F4/5S2 → 5I8 transition of Ho3+ ions, and the red emission located at 658 nm is caused by the 5F5 → 5I8 radiation transition of Ho3+ ions. The chromaticity coordinates of the NaLu(WO4)2:25%Yb3+, 0.5%Tm3+ and NaLu(WO4)2:25%Yb3+, 1%Ho3+ phosphors are (0.1798, 0.1459) and (0.4108, 0.4334), respectively (Fig. 4b), which is consistent with the luminescent photographs obtained under excitation (insets in Fig. 4a).Based on the generation of red, green, and blue emissions in the different doped NaLu(WO4)2:Ln3+ nanocrystals, it is possible to produce luminescence with a wide spectrum of colors, including white, by the appropriate doping of Yb3+, Tm3+, and Ho3+ in the present NaLu(WO4)2 nanocrystals.
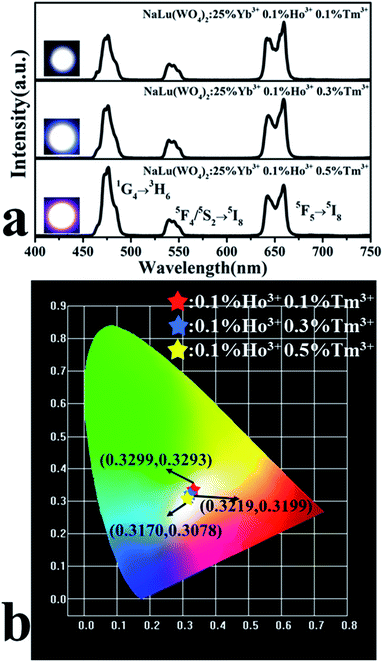
Fig. 5a displays the UC emission spectrum of NaLu(WO4)2:25%Yb3+, 0.1%Ho3+, y%Tm3+ phosphors. It can be observed that the UC emission spectrum of the phosphors are composed of blue emission, green emission and red emission, which are attributed to the 1G4 → 3H6 transition of Tm3+ and the 5F4/5S2 → 5I8 and 5F5 → 5I8 radiation transitions of Ho3+, respectively. The CIE chromaticity coordinates of NaLu(WO4)2:25%Yb3+, 0.1%Ho3+, y%Tm3+ phosphors alter from the blue-white area (0.317, 0.3078) to the white area (0.3299, 0.3293) by changing the Tm3+ doping content (as shown in Fig. 5b). In addition, the white UC photoluminescence of the NaLu(WO4)2 phosphor is obtained at y = 0.1 and its corresponding chromaticity coordinates (0.3299, 0.3293) are almost equivalent to the international standard values (0.33, 0.33). Simultaneously, the corresponding white UC luminescence photographs are also presented in the inset of Fig. 5a, which can be intuitively compared.
As we all know, the functional relationship between the UC emission intensity (I) and the laser pump power (P) can be described as I ∝ Pn, where n represents the number of laser photons.25,28 The value of n is derived from the slope obtained by fitting P and I (Fig. 6a). The n values of blue, green, and red emissions are 2.41, 2.00, and 1.79, respectively. It is concluded that the blue emission is assigned to the three-photon process, and the green and red emission are attributed to the two-photon process. The UC luminescence mechanism of NaLu(WO4)2:25%Yb3+, 0.1%Ho3+, 0.1%Tm3+ was deduced from the above results (as shown in Fig. 6b). Under excitation at 980 nm, the electrons of Yb3+ are filled from 2F7/2 to 2F5/2 by absorbing phonon energy. In the meantime, the electrons of the Ho3+ and Tm3+ activator ions are populated from 5I8 and 3H6 to 5I6 and 3H5, respectively (2F5/2 (Yb3+) + 5I8 (Ho3+) → 2F7/2 (Yb3+) + 5I6 (Ho3+); 2F5/2 (Yb3+) + 3H6 (Tm3+) → 2F7/2 (Yb3+) + 3H5 (Tm3+)). For Ho3+ ions, after the non-radiative transition of Ho3+ from 5I6 to 5I7, the Ho3+ ions are excited from 5I7 to 5F5 (2F5/2 (Yb3+) + 5I7 (Ho3+) → 2F7/2 (Yb3+) + 5F5 (Ho3+). The radiative release of Ho3+ ions from 5F5 to 5I8 generates the red emission (659 nm). Subsequently, the further transitions of Ho3+ from 5I6 to 5F4, 5S2 2F5/2 (Yb3+) + 5I6 (Ho3+) → 2F7/2 (Yb3+) + 5F4, 5S2 (Ho3+) occur, and the green emission (544.5 nm) is obtained by the radiative release of Ho3+ (5F4, 5S2 → 5I8). For Tm3+ ions, the non-radiative relaxation to the 3F4 and 3H4 levels (3H5 → 3F4 and 3F3 → 3H4), and the subsequent excitation transitions of the 3F4 and 3H4 levels to the 3F3 and 1G4 levels occur (2F5/2 (Yb3+) + 3F4 (Tm3+) → 2F7/2 (Yb3+) + 3F3 (Tm3+) and 2F5/2 (Yb3+) + 3H4 (Tm3+) → 2F7/2(Yb3+) + 1G4 (Tm3+)). Finally, the blue emission (476.5 nm) is afforded via the radiative relaxation from 1G4 to the 3H6 level.
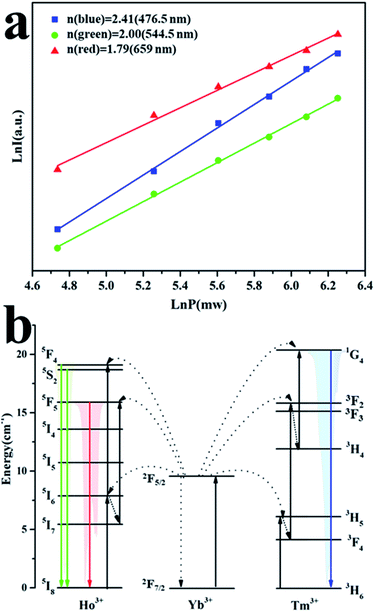 | ||
| Fig. 6 (a) Functional relationship between LnI and LnP, (b) UC mechanism of NaLu(WO4)2:25%Yb3+, 0.1%Ho3+, 0.1%Tm3+. | ||
Temperature sensing behavior and temperature sensing performance
Considering the absorption cross section and the significant difference in concentration between Yb3+ and Er3+, the UC mechanism of NaLu(WO4)2:Yb3+, Er3+ is an energy transfer up-conversion (ETU) mechanism.32 Under 980 nm excitation, the most likely emission mechanism is shown in Fig. 7. The electrons of Yb3+ are excited from 2F7/2 to 2F5/2 by absorbing phonon energy. Firstly, the Er3+ activator ions move from 4I15/2 to 4I11/2 through resonant energy transfer from Yb3+ to Er3+ via ET1: 2F5/2 (Yb3+) + 4I15/2 (Er3+) → 2F7/2 (Yb3+) + 4I11/2 (Er3+). Subsequently, 4I15/2 relaxes to the 4I13/2 level by non-radiation relaxation (NR), and the electrons of Er3+ are filled to the 4F9/2 level via ET2: 2F5/2 (Yb3+) +4I13/2 (Er3+) → 2F7/2 (Yb3+) + 4F9/2 (Er3+). Then, the electrons transfer from 4F9/2 to 4I15/2, which generates red emission at 655 nm (Fig. 8a). Finally, the electrons at 4F9/2 are further populated to the 2H9/2 level via ET3: 2F5/2 (Yb3+) + 4F9/2 (Er3+) → 2F7/2 (Yb3+) + 2H9/2 (Er3+). In addition, the nonradiative transitions of Er3+ ions from 2H9/2 to 2H11/2/4S3/2 occur, which yields green emission at 529 nm (2H11/2 → 4I15/2) and 551 nm (4S3/2 → 4I15/2) (Fig. 8a).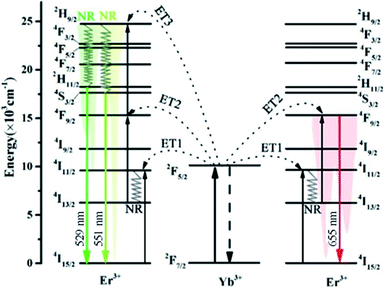 | ||
| Fig. 7 Revealed energy transfer mechanism for the UC luminescence process of the NaLu(WO4)2:Yb3+, Er3+ phosphor. | ||
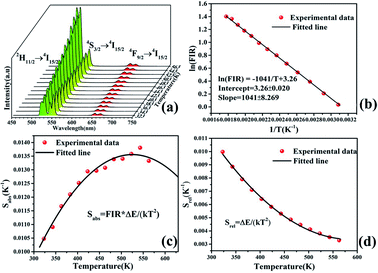
Fig. 8a depicts the UC emission spectrum (450–750 nm) of NaLu(WO4)2:Yb3+/Er3+ phosphors in the range of 323–563 K. As the temperature increases, the fluorescence intensity changes significantly, especially at 529 and 551 nm. Due to the energy levels of 2H11/2 and 4S3/2 of Er3+ being close, the ΔE is less than 2000 cm−1, which permits the upper level to fill from the lower level through rapid thermal population, resulting in the variation of the two thermal coupling states (TCSs).33 The temperature dependence of the fluorescence intensity ratio (FIR) from 2H11/2 → 4I15/2 to 4S3/2 → 4I15/2 can be expressed as follows:34
 | (1) |
![[thin space (1/6-em)]](https://www.rsc.org/images/entities/char_2009.gif) C) obtained via linear fitting are −1041 and 3.26, and ΔE and C are further calculated to be approximately 723.1714 cm−1 and 26.0495, respectively.
C) obtained via linear fitting are −1041 and 3.26, and ΔE and C are further calculated to be approximately 723.1714 cm−1 and 26.0495, respectively.
As we all know, sensitivity is a crucial parameter that intuitively reflects the performance of temperature sensing. The absolute sensitivity (Sabs) is calculated using eqn (2)35 and the relative sensitivity (Srel) is calculated using eqn (3).36
 | (2) |
 | (3) |
Fig. 8c and d show the fitted curves of the relationship between Sabs, Srel and T. The maximum value of Sabs is acquired to be 1.38% K−1 at 543 K and Srel is 1041/T2. These values are similar to those of other Yb3+/Er3+-doped phosphors reported in the literature, as shown in Table 1. However, compared with a majority of the materials listed in the table, the temperature-sensitive parameters of NaLu(WO4)2:20%Yb3+, 1%Er3+ are significantly larger. This indicates that the NaLu(WO4)2:20%Yb3+, 1%Er3+ phosphor is superior to a majority of reported materials in the field of optical temperature measurement in the higher temperature range.
| Matrix | Temperature range (K) | Maximum Sabs (K−1) | Srel (K−1) | Ref. |
|---|---|---|---|---|
| NaLu(WO4)2:Yb3+/Er3+ | 323–563 | 1.38% (543 K) | 1041/T2 | This work |
| NaGd(WO4)2:Yb3+/Er3+ | 298–383 | 1.2% (310 K) | 1070/T2 | 2 |
| NaY(WO4)2:Yb3+/Er3+ | 293–503 | 0.9% (503 K) | 1127/T2 | 4 |
| Lu2TeO6:Yb3+/Er3+ | 323–623 | 1.03% (623 K) | 1241/T2 | 33 |
| NaGdF4:Yb3+/Er3+ | 77–500 | 0.305% (298 K) | 993.44/T2 | 34 |
| BaWO4:Yb3+/Er3+ | 293–363 | 1.47% (393 K) | 911.92/T2 | 36 |
| CaMoO4:Yb3+/Er3+ | 303–873 | 1.43% (575 K) | 1055.15/T2 | 37 |
| NaY(MoO4)2:Yb3+/Er3+ | 303–523 | 0.97% (493 K) | 983.2/T2 | 38 |
| ZnWO4:Yb3+/Er3+ | 83–583 | 0.99% (583 K) | 1134.32/T2 | 39 |
Fig. 9 is a comparison of the upconversion emission spectra of the nano-sample in our present work and the bulk sample according to a previous report.11 Obviously, the position of the emission peak does not change, but the emission intensity is different. Although the upconversion luminescence intensity of the bulk sample is stronger due to its higher crystallinity and fewer surface defects, the upconversion luminescence intensity of the nano-sample also reaches 73% that of the bulk sample. Considering that the calcination temperature of the nano-sample is only 600 °C and the calcination temperature of the bulk sample is 1000 °C, the luminescence of the nano-sample is very good and can fully meet its practical application requirements. Furthermore, the synthesis temperature of our nano-samples is much lower than that of the bulk samples in the literature, providing the choice of a more environmentally friendly and energy-efficient synthetic method.40–42
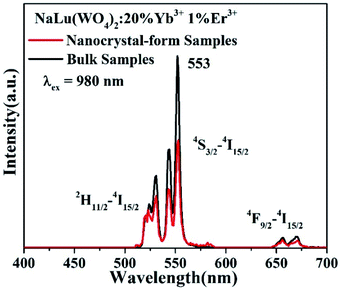 | ||
| Fig. 9 A comparison of the upconversion emission spectra of the nano-sample in our present work and the bulk sample according to a previous report.11 | ||
Conclusion
In summary, we successfully prepared NaLu(WO4)2:Ln3+ phosphors via a hydrothermal method combined with subsequent calcination. Doping Ln ions with larger radii into the matrix causes the XRD diffraction peaks to shift to smaller angles. Under 980 nm near-infrared excitation, the NaLu(WO4)2:25%Yb3+, 0.5%Tm3+ and NaLu(WO4)2:25%Yb3+, 1%Ho3+ phosphors produced strong UC blue, green and red emission. Additionally, white UC emission with CIE-x = 0.3299 and CIE-y = 0.3293 was realized by 25%Yb3+, 0.1%Ho3+, 0.1%Tm3+ ions trip-doped into the NaLu(WO4)2 matrix. Besides, the obtained NaLu(WO4)2:20%Yb3+, 1%Er3+ phosphor shows excellent temperature sensing performance with a maximum sensitivity as high as 1.38% K−1 at 543 K, which is better than that of many other previously reported temperature sensing materials. Thus, the NaLu(WO4)2:Ln3+ phosphors we obtained have potential applications in white lighting and optical temperature measurement.Conflicts of interest
There are no conflicts of interest to declare.Acknowledgements
This project is financially sponsored by the National Natural Science Foundation of China (NSFC 52172154), the Natural Science Foundation of Chongqing (cstc2020jcyj-msxmX0332) and the Chongqing Eagle Project (CY210211).References
- T. Guo, Y. Lin, W. J. Zhang, J. S. Hong, R. H. Lin, X. P. Wu, J. Li, C. H. Lu and H. H. Yang, Nanoscale, 2018, 10(4), 1607–1612 RSC.
- N. Yuan, D. Y. Liu, X. C. Yu, H. X. Sun, C. G. Ming, W. H. Wong, F. Yu, D. Y. Song, E. Pun and Y. B. Zhang, Mater. Lett., 2018, 218, 337–340 CrossRef CAS.
- Z. Wang, J. Zhong, H. Jiang, J. Wang and H. Liang, Cryst. Growth Des., 2014, 14(8), 3767–3773 CrossRef CAS.
- M. Lin, L. Xie, Z. Wang, B. S. Richards, G. Gao and J. Zhong, J. Mater. Chem. C, 2019, 7(10), 2971–2977 RSC.
- M. Yu, H. Xu, Y. Li, Q. Dai, G. Wang and W. Qin, J. Colloid Interface Sci., 2020, 559, 162–168 CrossRef CAS PubMed.
- X. Shi, M. S. Molokeev, X. Wang, Z. Wang, Q. Zhu and J. G. Li, Inorg. Chem., 2018, 57(17), 10791–10801 CrossRef CAS PubMed.
- Y. Zhang, X. Wang, H. Ye, X. Gong, Y. Li and X. Yao, J. Mater. Sci.: Mater. Electron., 2018, 29(23), 19840–19845 CrossRef CAS.
- Y. Zhai, Q. Sun, S. Yang, Y. Liu, J. Wang, S. Ren and S. Ding, J. Alloys Compd., 2019, 781, 415–424 CrossRef CAS.
- A. Nexha, J. J. Carvajal, M. C. Pujol, F. Díaz and M. Aguiló, J. Mater. Chem. C, 2020, 8(1), 180–191 RSC.
- E. W. Barrera, M. C. Pujol, J. J. Carvajal, X. Mateos, R. Sole, J. Massons, A. Speghini, M. Bettinelli and C. Cascales, Phys. Chem. Chem. Phys., 2014, 16(4), 1679–1686 RSC.
- Z. Wang, J. Zhong, H. Liang and J. Wang, Opt. Mater. Express, 2013, 3(3), 418 CrossRef CAS.
- Y. Huang, A. Skripka, L. Skripka, F. Sanz-Rodríguez, P. Haro-González, D. Jaque, F. Rosei and F. Vetrone, Nanoscale, 2018, 10(2), 791–799 RSC.
- G. Gao, D. Busko, S. Kauffmann-Weiss, A. Turshatov, I. A. Howard and B. S. Richards, J. Mater. Chem. C, 2017, 5(42), 11010–11017 RSC.
- R. V. Perrella and P. C. de Sousa Filho, Dalton Trans., 2020, 49(3), 911–922 RSC.
- X. Zhu, J. Li, X. Qiu, Y. Liu, W. Feng and F. Li, Nat. Commun., 2018, 9(1), 2176 CrossRef PubMed.
- A. R. N. Bastos, C. D. S. Brites, P. A. Rojas-Gutierrez, C. DeWolf, R. A. S. Ferreira, J. A. Capobianco and L. D. Carlos, Adv. Funct. Mater., 2019, 29(48), 1905474 CrossRef CAS.
- Y. Huang, A. Skripka, L. Labrador-Paez, F. Sanz-Rodriguez, P. Haro-Gonzalez, D. Jaque, F. Rosei and F. Vetrone, Nanoscale, 2018, 10(2), 791–799 RSC.
- A. Sedlmeier, D. E. Achatz, L. H. Fischer, H. H. Gorris and O. S. Wolfbeis, Nanoscale, 2012, 4(22), 7090–7096 RSC.
- Z. Wang, J. Christiansen, D. Wezendonk, X. Xie, M. A. van Huis and A. Meijerink, Nanoscale, 2019, 11(25), 12188–12197 RSC.
- A. Zhang, Z. Sun, G. Liu, Z. Fu, Z. Hao, J. Zhang and Y. Wei, J. Alloys Compd., 2017, 728, 476–483 CrossRef CAS.
- J. Sarkar, S. Mondal, S. Panja, I. Dey, A. Sarkar and U. K. Ghorai, Mater. Res. Bull., 2019, 112, 314–322 CrossRef CAS.
- B. Samanta, A. K. Dey, P. Bhaumik, S. Manna, A. Halder, D. Jana, K. K. Chattopadhyay and U. K. Ghorai, J. Mater. Sci.: Mater. Electron., 2018, 30(2), 1068–1075 CrossRef.
- P. Xiao, S. Ye, H. Liao, Y. Shi and D. Wang, J. Solid State Chem., 2019, 275, 63–69 CrossRef CAS.
- A. L. Pellegrino, S. La Manna, A. Bartasyte, P. Cortelletti, G. Lucchini, A. Speghini and G. Malandrino, J. Mater. Chem. C, 2020, 8(11), 3865–3877 RSC.
- E. W. Barrera, M. C. Pujol, J. J. Carvajal, X. Mateos, R. Solé, J. Massons, A. Speghini, M. Bettinelli, C. Cascales, M. Aguiló and F. Díaz, Phys. Chem. Chem. Phys., 2014, 16(4), 1679–1686 RSC.
- K. Cho, J. Choi, K. M. Kim, J. I Lee and J. H. Ryu, Ceram. Int., 2015, 41, S668–S674 CrossRef CAS.
- J. Méndez-Ramos, A. Santana-Alonso, A. C. Yanes, J. del-Castillo and V. D. Rodríguez, J. Lumin., 2010, 130(12), 2508–2511 CrossRef.
- H. Xu, K. Xu, A. Lu, X. Wang and J. Hu, J. Mater. Sci.: Mater. Electron., 2015, 26(6), 3921–3925 CrossRef CAS.
- B. Zhao, D. Shen, J. Yang, S. Hu, X. Zhou and J. Tang, J. Mater. Chem. C, 2017, 5(13), 3264–3275 RSC.
- F. Wang, Y. Han, C. S. Lim, Y. Lu, J. Wang, J. Xu, H. Chen, C. Zhang, M. Hong and X. Liu, Nature, 2010, 463(7284), 1061–1065 CrossRef CAS PubMed.
- D. Chen, Y. Yu, F. Huang, A. Yang and Y. Wang, J. Mater. Chem., 2011, 21(17) Search PubMed.
- H. Dong, L. D. Sun and C. H. Yan, Chem. Soc. Rev., 2015, 44(6), 1608–1634 RSC.
- Z. Ma, J. Gou, Y. Zhang, Y. Man, G. Li, C. Li and J. Tang, J. Alloys Compd., 2019, 772, 525–531 CrossRef CAS.
- I. Mikalauskaite, G. Pleckaityte, M. Skapas, A. Zarkov, A. Katelnikovas and A. Beganskiene, J. Lumin., 2019, 213, 210–217 CrossRef CAS.
- X. Chai, J. Li, Y. Zhang, X. Wang, Y. Li and X. Yao, RSC Adv., 2016, 6(68), 64072–64078 RSC.
- L. Xu, J. Liu, L. Pei, Y. Xu and Z. Xia, J. Mater. Chem. C, 2019, 7(20), 6112–6119 RSC.
- F. Huang, Y. Gao, J. Zhou, J. Xu and Y. Wang, J. Alloys Compd., 2015, 639, 325–329 CrossRef CAS.
- X. Yang, Z. Fu, Y. Yang, C. Zhang, Z. Wu, T. Sheng and A. Srivastava, J. Am. Ceram. Soc., 2015, 98(8), 2595–2600 CrossRef CAS.
- X. Chai, J. Li, X. Wang, Y. Li and X. Yao, Opt. Express, 2016, 24(20) CrossRef PubMed.
- L. Jiang and J. Yang, Journal of Liaocheng University, 2021, 34(5), 21–26 Search PubMed.
- R. Ye and J. Yang, Journal of Liaocheng University, 2021, 34(4), 37–42 Search PubMed.
- W. P. Xia, L. Jiang and S. S. Hu, Journal of Liaocheng University, 2020, 33(5), 60–65 Search PubMed.
Footnote |
| † These authors contributed equally to this work. |
| This journal is © The Royal Society of Chemistry 2022 |

