
 Open Access Article
 This Open Access Article is licensed under a Creative Commons Attribution-Non Commercial 3.0 Unported Licence
In situ EPR and Raman spectroscopy in the curing of bis-methacrylate–styrene resins†
Linda E. Eijsink a,
Andy S. Sardjana,
Esther G. Sinnemaa,
Hugo den Bestena,
Keimpe J. van den Bergb,
Jitte Flapperc,
Rogier van Gemertb,
Ben L. Feringaa and
Wesley R. Browne*a
a,
Andy S. Sardjana,
Esther G. Sinnemaa,
Hugo den Bestena,
Keimpe J. van den Bergb,
Jitte Flapperc,
Rogier van Gemertb,
Ben L. Feringaa and
Wesley R. Browne*a
aStratingh Institute for Chemistry, Faculty of Science and Engineering, University of Groningen, Nijenborgh 4, Groningen, 9747AG, The Netherlands. E-mail: w.r.browne@rug.nl
bAkzo Nobel Car Refinishes N.V., Rijksstraatweg 31, Sassenheim, 2171 AJ, The Netherlands
cAkzo Nobel Decorative Coatings B.V., Rijksstraatweg 31, Sassenheim, 2171 AJ, The Netherlands
First published on 19th January 2022
Abstract
The curing of bis-methacrylate–styrene resins initiated by the cobalt catalyzed decomposition of cumyl hydroperoxide is monitored at ambient temperatures in situ by EPR and Raman spectroscopy. EPR spectroscopy shows the appearance of organic radicals after ca. 1 h from initiation with an increase in intensity from both polystyrene and methacrylate based radical species over a further ca. 2 h period to reach a maximum spin concentration of ca. 2–3 mM. Alkene conversion to polymer was monitored by Raman spectroscopy in real time in situ with EPR spectroscopy and reveals that the appearance of the radical signals is first observed only as the conversion approaches its maximum extent (70% at room temperature), i.e., the resin reaches a glass-like state. The radicals persist for several months on standing at room temperature. Flash frozen samples (77 K) did not show EPR signals within 1 h of initiation. The nature of the radicals responsible for the EPR spectra observed were explored by DFT methods and isotope labelling experiments (D8–styrene) and correspond to radicals of both methacrylate and polystyrene. Combined temperature dependent EPR and Raman spectroscopy shows that conversion increases rapidly upon heating of a cured sample, reaching full conversion at 80 °C with initially little effect on the EPR spectrum. Over time (i.e. subsequent to reaching full conversion of alkene) there was a small but clear increase in the EPR signal due to the methacrylate based radicals and minor decrease in the signal due to the polystyrene based radicals. The appearance of the radical signals as the reaction reaches completion and their absence in samples flash frozen before polymerization has halted, indicate that the observed radicals are non-propagating. The formation of the radicals due to stress within the samples is excluded. Hence, the observed radicals are a representative of the steady state concentration of radicals present in the resin over the entire timespan of the polymerization. The data indicate that the lack of EPR signals is most likely due to experimental aspects, in particular spin saturation, rather than low steady state concentrations of propagating radicals during polymerization.
Introduction
The retardation and ideally prevention of metal corrosion is a contemporary challenge of considerable economic and societal importance. Passive protection using barriers, i.e. performance coatings, is the primary method used currently for limiting corrosion, e.g., in transportation vessels.1 The state of the art in polymer-based coatings are the epoxy resins and the so-called ‘vinylester–styrene’ resins in which the vinylester is typically a crosslinking compound such as bisphenol-A diglycidyl ether methacrylate (BADGE-MA) bearing, despite its common name, several methacrylate units, while styrene is a so-called ‘reactive diluent’ as it acts as both diluent to reduce viscosity and forms part of the polymer network (Scheme 1A).2–4 ‘Vinylester–styrene’ coatings are used especially in applications demanding acid resistance and are prepared by radical polymerization of resin mixtures, with radicals generated by initiators through thermal or photochemical bond cleavage, or through metal catalyzed decomposition of alkyl hydroperoxides (Scheme 1B).3–6 Polymerization initiated by peroxy radicals generated with metal catalysts is used primarily in preparing protective coatings on large structures and in confined environments where the scale of application precludes the use of photochemical, or thermal initiation.2,7 | ||
| Scheme 1 Structure of the monomers and cured resin, where R denotes the bisphenol-A core of BADGE-MA and n = 1.2 (A), initiation by cobalt catalyzed hydroperoxide decomposition (B), and radicals observed by EPR spectroscopy in the polymerization of bis-methacrylate (MA1, MA2) and styrene (St1 and St2) monomers (C). | ||
Currently, mainly cobalt catalysts are used in the activation of alkyl hydroperoxide initiators in resin curing, as they provide robust coatings and allow for control over curing profiles, in which the onset of polymerization is delayed sufficiently to allow time to apply the coatings. Concerns with regard to cobalt8–10 have prompted efforts to seek replacements for these catalysts focusing primarily on manganese and iron-based catalysts.11,12 ‘Drop-in’ replacements, where only the catalyst is changed, have met with only limited success, which is unsurprising given the complex kinetics of the radical based copolymerization that leads to curing. Hence, understanding of the mechanism of polymerization and the impact of catalyst replacement on radical generation is essential.
The curing of these resins by radical polymerization can be divided into four stages: inhibition, solution polymerization, auto-acceleration (Trommsdorff effect)13 and glassy state (Scheme 2). The inhibition stage is important to allow for mixing of the hydroperoxide with the resin before application on a surface and is controlled typically with the use of additives such as 2,6-tert-butyl-4-methylphenol (BHT).14 Once the radical polymerization is initiated the solution's viscosity increases due to formation of crosslinked polymer chains and eventually the reactive diluent (styrene and remaining methacrylate monomer) is gelated by the polymer. It is at this point that the kinetics of polymerization change and the onset of auto-acceleration is observed with rapid hardening of the coating, forming a mixed polymer that depends on monomer reactivity ratios15,16 (Table 1). The well-defined curing profile required of these resins (Scheme 2) challenges the development of catalysts that are suitable alternatives to those based on cobalt. Since the catalyst's role is primarily in initiation by decomposition of alkyl hydroperoxides, non-linear effects are to be expected and hence a detailed understanding of the radical polymerization and the radicals involved is essential.
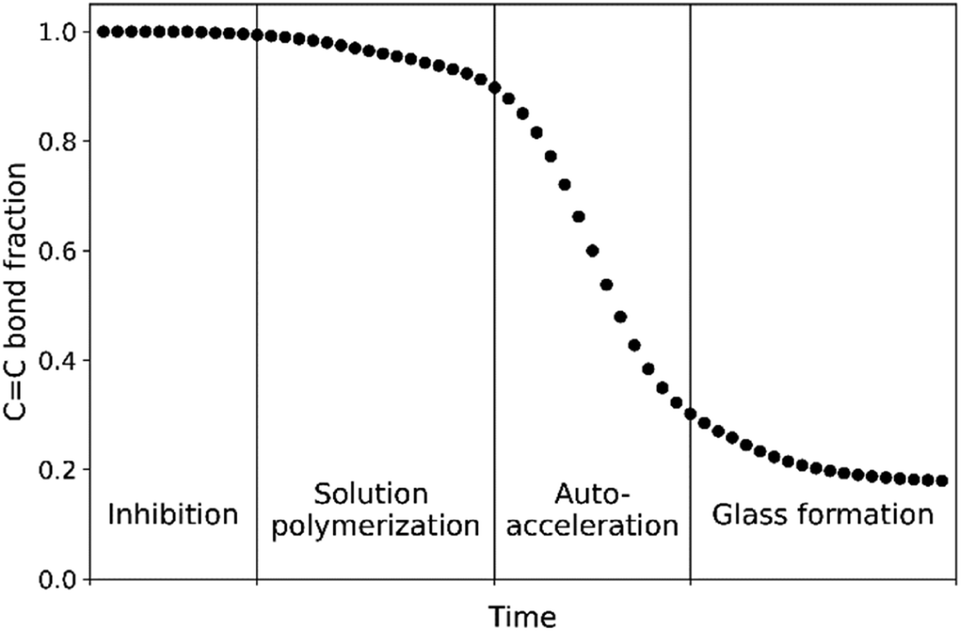 | ||
| Scheme 2 Ideal reaction profile for protective coating applications. | ||
| Conditions | r1 (styrene) | r2 (BADGE-MA) | r2 (MMA) |
|---|---|---|---|
| 30 °C, cobalt soap, CumOOH20 | 0.45 ± 0.00 | 1.54 ± 0.02 | |
| 90 °C, CumOOH20 | 0.47 ± 0.01 | 0.61 ± 0.1 | |
| 25 °C, cobalt soap, DMA, MEKP21 | 0.19 | 0.35 | |
| 60 °C, BPO21 | 0.19 | 0.50 | |
| 90 °C, BPO21 | 0.22 | 0.82 | |
| 140 °C, BPO21 | 0.23 | 0.88 | |
| 80 °C, BPO38 | 0.43 ± 0.03 | 0.41 ± 0.05 | |
| 35 °C (ref. 16) | 0.50 | 0.44 | |
| 15.2 °C, PLP39 | 0.523 | 0.421 |
Vibrational spectroscopy is particularly suited to determine changes in the concentration of reactive monomers over time as, although the resin changes from a mixture of small molecules to a polymer network, the fingerprint nature of these techniques allow for all major reaction compounds to be determined (semi)quantitatively.17–19 For example, cobalt/hydroperoxide initiated polymerizations have been studied with FTIR spectroscopy to study the effect of temperature (25 to 140 °C) on monomer reactivity and coating properties.7,20–22
The radical nature of the polymerization and the timescales over which curing takes place (e.g., 1 to 4 h) in principle lends it to be studied by EPR spectroscopy, as demonstrated in several studies of photochemical, thermal and redox-initiated systems. Photoinitiated radical reactions have seen most attention in regard to studies with EPR spectroscopy, aided by the possibility that optical access to the EPR cavity allows for at will initiation of polymerization and control over the rate of initiation (decomposition of photoinitiator) by the intensity of the actinic pulse of light used.
Photoinitiated radical polymerizations with phosphine oxides are used widely in dental resins, which typically consist of methacrylate based crosslinking monomers only. The stable methacrylic radicals observed in cured dental resins are typically a mixture of an allylic and a tertiary carbon radical (Scheme 1C: MA1 and MA2, 9 and 5-line species, respectively).23,24 In several studies it was noted that irradiation of the photoinitiator present in these resins results in an increase in the total concentration of radical over time,24,25 and the ratio between the allylic and tertiary carbon radical changes also.
In resins based on mixtures of methacrylate crosslinking monomers and styrene, the contribution of styryl based radicals to the EPR spectrum obtained after curing is not linearly dependent on the initial concentration of styrene and the total radical concentration in the sample decreases with increase in the fraction of styrene.25 A similar broad 4-line signal has been observed after radiooxidation of polystyrene and in heat/peroxide26 and photoinitiated styrene homopolymerization.27 Close inspection of the spectra obtained in photopolymerisation, with high intensity irradiation, of styrene, containing only the photoiniator, using long acquisition times28 or SP–PLP–EPR (single pulse – pulsed laser polymerization – EPR) spectroscopy29 showed the presence of an 18+-line spectrum assigned to the propagating styryl radical, whereas the 4-line signal was assigned to a mixture of tertiary benzyl and cyclohexadiene radicals (Scheme 1C: St1 and St2 resp.).26 Parallel monitoring of conversion by FT-NIR spectroscopy and radical concentration by EPR spectroscopy shows that the radical concentration increases as conversion increases, after which the concentration does not change.25 If the irradiation is halted prior to reaching the maximum extent of conversion, however, the radical concentration drops rapidly.30
In contrast to photoinitiated polymerizations, metal/hydroperoxide initiated polymerizations can take up to several hours, allowing for greater overall relative time resolution in spectroscopic studies. A key question arising, however, is to what extent the signals observed by EPR spectroscopy correspond to radicals participating in polymerization and especially the time dependence of spectral changes considering the specific time course of the polymerization (Scheme 2, e.g., lag period, autoacceleration and formation of glass-like state etc.). In this contribution we follow the curing of methacrylate styrene resins by cobalt-catalyzed alkyl hydroperoxide decomposition with EPR and in situ Raman spectroscopy. The latter technique allows for monomer conversion to be determined in real time and allows direct correspondence to be made between the changes observed by EPR spectroscopy, and reveals that the observed radicals appear only towards the end of the curing process as polymerization slows and even after it has halted. These radicals persist essentially indefinitely even with further curing at elevated temperatures and hence their actual involvement in polymerization is unlikely. However, their appearance is indicative of the radical concentration during polymerization, estimated to be in the millimolar range, and that the absence of signals during polymerization is most likely due to slow relaxation and hence saturation, rather than a low steady state concentration of observable radicals.
Experimental
Materials
H8–styrene, D8–styrene, cumene hydroperoxide (80% solution in cumene), Al2O3 90 active 70–230 mesh, ethylbenzene, Co(II) 2-ethylhexanoate (65 wt% of complex in mineral spirits), and Mn(II)(neodecanoate)2 (8 wt% of manganese in mineral spirits) were obtained from commercial sources. H8–styrene was passed over neutral aluminum oxide (Al2O3) to remove stabilizers prior to the reaction. Other chemicals were used as received. Bisphenol-A diglycidyl ether methacrylate (BADGE-MA, contains 1000 ppm 2,6-di-tert-butyl-4-methylphenol (BHT)) was prepared by standard methods and the number of repeat units (n) was determined at 1.2 by GPC, and 1H-NMR and FTIR spectroscopy (Fig. S1–S4†). See ESI† for synthesis, characterization and determination of the number of repeat units.Experimental procedure
In a typical experiment, 10 g of BADGE-MA (containing 10 mg or 45.4 μmol BHT) was mixed with 3.75 mL (3.40 g, 32.6 mmol) of styrene (C![[double bond, length as m-dash]](https://www.rsc.org/images/entities/char_e001.gif) C bond ratio BADGE-MA/styrene 1
C bond ratio BADGE-MA/styrene 1![[thin space (1/6-em)]](https://www.rsc.org/images/entities/char_2009.gif) :1) and 13.17 mg (24.8 μmol) of cobalt catalyst solution. 228 μL (235 mg, 1.23 mmol) of cumene hydroperoxide was added and the reaction mixture was stirred using a vortex mixer to initiate the reaction. Samples for EPR spectrometry were drawn using a 200 μL brand capillary which was thereafter sealed with Teflon grease.
:1) and 13.17 mg (24.8 μmol) of cobalt catalyst solution. 228 μL (235 mg, 1.23 mmol) of cumene hydroperoxide was added and the reaction mixture was stirred using a vortex mixer to initiate the reaction. Samples for EPR spectrometry were drawn using a 200 μL brand capillary which was thereafter sealed with Teflon grease.
Spectroscopy
UV-vis absorption spectra were recorded on a Specord210 (AnalytikJena) in 1 cm cuvettes. EPR spectra were recorded at room temperature with a Bruker EMXNano X-band EPR spectrometer with optical access to the cavity. Low temperature EPR spectra (77 K, liquid N2) were recorded using a finger Dewar accessory. Temperature-dependent EPR spectra were recorded using a VTU accessory. The limit of detection under the conditions used in monitoring curing (power 0.1585 mW (28 dB), gain 60 dB, sweep width 200 G, sweep time 60 s, 10 accumulation, modulation amplitude 1.0 G, frequency 9.646186 GHz) was estimated at ca. 0.5 μM, using TEMPO in the BADGE-MA–styrene mixtures. Raman spectra were recorded either using a Raman microscope with optical head from PerkinElmer with excitation at 785 nm (Ondax, 5–50 mW at sample) typically with a 50× long working distance objective or a homebuilt Raman probe with Raman scattering feed to a Shamrock163i spectrograph with a 600 l mm−1 750 nm blazed grating and a SMA fiber coupler and correction lens with spectra collected using an Andor Technology iVac-316-LDC-DD or iDus-420-OE CCD, respectively. Spectra were calibrated with polystyrene or cyclohexane (ASTM E 1840). Spectra were typically 0.5 to 1 s acquisitions and 60 accumulations. Raman/DSC measurements were carried out using a Mettler Toledo DSC FP84HT microscope stage with a FP90 controller. Raman spectra recorded in situ during EPR measurements were obtained using a home built sampling probe at 785 nm. Briefly, the laser (Ondax 785 Surelock RO module, 75 mW) was reflected by a long pass dichroic (Semrock Brightline Di02-R785-25) to a 30 cm focal length planoconvex lens and the Raman scattering collected at 180° (backscattering geometry) through the dichroic through a long pass filter (Semrock Brightline BLP01-785R-25, with 50% cut-off at 805 nm, 309 cm−1) and feed to a 100 micron round to line bundle fiber with a Thorlabs SMA fiber port (PAF2S-A7B).Results
Resins available commercially, which are used in the preparation of commercial paints, typically contain additional components in proprietary formulations. For mechanistic studies the well-defined resin bisphenol-A diglycidyl ether methacrylate (BADGE-MA) was prepared specifically with known composition and stabilizer content (BHT = 2,6-di butylhydroxytoluene, 1000 ppm), and characterized by GPC, FTIR and 1H-NMR spectroscopy (see ESI† for details). Typical compositions used in the present study correspond to commercial samples with 30 wt% styrene corresponding to a 1:1 mole ratio of methacrylate units to styrene (see ESI†). The resin styrene mixtures were cured at room temperature using cumyl hydroperoxide (80 wt%, 92 mM) as initiator with a Co(II) 2-ethylhexanoate catalyst solution in mineral spirits (65 wt%, 1.8 mM). For comparative purposes [Mn(II)(neodecanoate)2] (8 wt% in Mn, 1.8 mM) is used also. The samples were cured (i.e. conversion of alkenes ceased, vide infra) typically within 1–2 h of initiation.
EPR spectroscopy of cured resin
The EPR spectrum of cured resin shows signals corresponding to at least two distinct organic radicals. Simulation of spectra, with parameters determined from DFT calculations (vide infra), as well as comparison with spectra obtained with BADGE-MA/ethylbenzene resins (vide infra) and with literature,25 indicates that the dominant signal is from in chain radicals in a polystyrene block with minor amounts of methacrylate based radicals, which is apparent from signals at g = 2.032 and 1.977 (339.7 and 349.2 mT) (Fig. 1). The observed radicals persist over several months following curing. Comparison with a spectrum of a resin mixture (uncured) containing TEMPO (100 μM) indicates that the spin concentration in the cured resin is 2.7 mM. With manganese soap (Mn(II)(neodecanoate)2) the spectral changes and final spectra were essentially the same indicating that the signals are largely independent of the catalyst used for initiation (Fig. S5†). EPR signals due to Co(II) species were not observed at room temperature or at 77 K consistent with immediate oxidation to Co(III) which is consistent with changes to the UV-vis absorption spectrum of the resin upon addition of peroxide (see Fig. S6†). | ||
| Fig. 1 X-Band EPR spectrum of cured resin at room temperature (20 °C). Note that the shape of the spectrum is highly dependent on microwave power (see Fig. S7†). Parameters: power 0.001 mW (50 dB), gain 70 dB, sweep width 200 G, sweep time 120 s, 10 accumulations, 1 G modulation amplitude, frequency 9.661781 GHz. | ||
Monitoring of polymerization by in situ EPR spectroscopy
The polymerization of styrene/BADGE-MA was monitored by in situ EPR spectroscopy over time at room temperature. In parallel, samples were freeze quenched to 77 K at specified times after addition of hydroperoxide and EPR spectra were recorded at 77 K. Samples of curing resin were flash-frozen to 77 K (by immersion of resin filled capillaries in liquid nitrogen) between 7.5 and 180 min, and after 1 day, after initiation of polymerization. The spectrum recorded at 77 K for a 1 day old sample was similar to that recorded at room temperature (Fig. 1 and 2). The spectra recorded for samples flash frozen within 70 min of initiation show little or no evidence for the presence of organic radicals (Fig. 2). | ||
| Fig. 2 EPR spectra (77 K) of samples flash-frozen at various times following addition of cumyl hydroperoxide to the reaction mixture. Parameters: power 0.0001 mW (60 dB), gain 60 dB, sweep width 300 G, sweep time 60 s, 5 accumulations, 2 G modulation amplitude. A figure with x-axis in field (mT) is available in ESI (Fig. S8†). | ||
The EPR spectrum of the resin was recorded at room temperature over time from within ca. 1 min of addition of alkyl hydroperoxide to the resin containing catalyst. Within the first minutes, occasionally weak signals corresponding to the BHT radical were observed (Fig. S9†). Thereafter the spectrum was silent for typically 1 h, consistent with the absence of signals in the flash frozen samples. A weak broad signal appears after the first hour, the intensity of which increases initially rapidly and then more slowly over several hours to reach a maximum (Fig. 3). The growth of the signals across the spectrum was monotonic, and in situ spectra obtained during room temperature curing and samples flash-frozen at particular times were essentially identical (Fig. S10†). The spectrum does not undergo significant further change over several months standing at ambient temperature.
 | ||
| Fig. 3 EPR spectra of resins while curing at room temperature over time (blue to orange). BADGE-MA left: with H8–styrene, right: with D8–styrene. Parameters H8–styrene: 0.01 mW (40 dB), gain 50 dB, sweep width 300 G, sweep time 45 s, 1 accumulation, 2 G modulation amplitude. Parameters D8–styrene: 0.3162 mW (25 dB), gain 40 dB, sweep width 200 G, sweep time 60 s, 5 accumulations, 1 G modulation amplitude. | ||
With D8–styrene (Fig. 3), the EPR spectrum shows the same time dependent evolution. The difference between an EPR spectrum of a perprotio and perduetero compound is a decrease in magnitude of hyperfine coupling due to the lower gyromagnetic ratio of the deuteron (0.411 × 10⁸ s−1 T−1 vs. 2.67 × 10⁸ s−1 T−1) and increased number of lines due to the increase in nuclear spin quantum number (1 vs. ½). Furthermore, the spectra with D8–styrene are potentially less affected by saturation due to nuclear quadrupole relaxation. The major part of the signal with D8–styrene does not show discernible hyperfine coupling and appears as a single broad line, which then dominates the spectrum, with the second signal unaffected (assigned to a methacrylate based radical, vide infra). The changes upon deuteration allow for assignment of the two signals, with the dominant signal due to a radical derived from styrene/polystyrene and the weaker signal with well resolved hyperfine coupling due to a BADGE-MA derived radical.
Temperature dependence of the EPR spectrum on cured resins
Raman spectroscopy (vide infra) reveals that resins cured at room temperature show incomplete polymerization of available monomer. Subsequent heating of a cured resin sample results in a restart of polymerization (curing) until eventually all monomer is incorporated as polymer (see below for Discussion of changes in Raman spectra).22,31 Subjecting a sample cured at room temperature to a post curing temperature ramp in situ while recording EPR spectra results in several pronounced changes (Fig. 4). The initial decrease in integrated intensity is consistent with the effect of temperature on spin polarization (see ESI†). The most pronounced change obtained upon heating the sample to 80 °C is an increase in the contribution of the methacrylate based radical to the overall spectrum. This assignment is based on EPR spectra obtained during curing of ethylbenzene/BADGE-MA mixtures, i.e. in the absence of styrene (vide infra). Despite the pronounced increase in the signals arising from this methacrylate based radical, it contributes only modestly to the total signal (Fig. S12† for MCR analysis). Furthermore, the total spin concentration is relatively unchanged (see ESI†). The change in the EPR spectrum is irreversible; cooling the sample to room temperature does not result in further changes to the shape of the spectrum (Fig. S13†).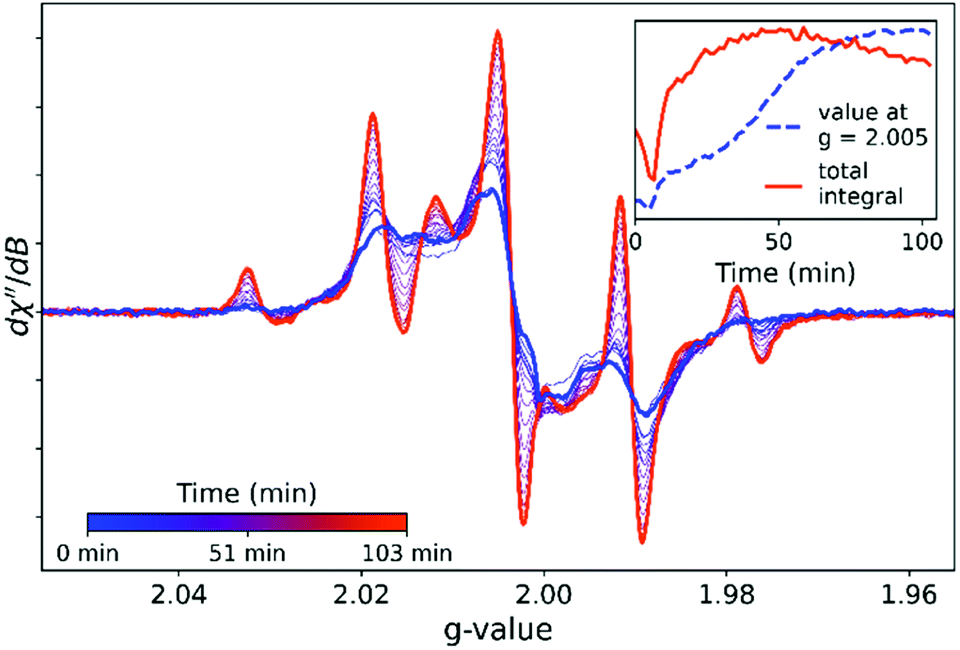 | ||
| Fig. 4 EPR spectra (at 80 °C) over time of a room temperature cured resin held at 80 °C. The sample was introduced to the preheated EPR temperature-controlled cell. The time taken for the sample to reach 80 °C was estimated from the turning point in signal intensity (ca. 5 min, see inset). Parameters: 0.01 mW (40 dB), gain 40 dB, sweep width 300 G, sweep time 90 s, 1 accumulation, 2 G modulation amplitude, temperature 80 °C. | ||
Fitting of EPR spectral data
The EPR spectra were fitted using Easyspin32 (Fig. 5). Two species were used to fit the methacrylate based radical observed in the spectrum of BADGE-MA/ethylbenzene: the tertiary and the allylic radical (MA1 and MA2 in Scheme 1C, 5 and 4 interacting protons resp.) in a ratio of 4.4:1. The parameters from this fit were carried over to fit the spectra of H8–styrene and D8–styrene.‡ This shows that the contribution of styrene radical to the EPR spectrum is 90% for H8–styrene and 63% for D8–styrene, which reflects the more efficient relaxation in the latter case.
 | ||
| Fig. 5 Observed (blue) and fitted (orange) EPR spectra for BADGE-MA/ethylbenzene (left), BADGE-MA/H8–styrene (center) and BADGE-MA/D8–styrene (right). See ESI† for fit parameters. | ||
DFT calculations of EPR spectra
The ORCA software package33,34 was used to calculate EPR spectra of various compounds to account for the structure of the radicals responsible for the spectra (Fig. 3, see ESI† for details). Conformers were taken into account by calculating the 10 lowest energy conformers, which were then used as a starting point for calculation of EPR spectral properties. Multiple conformers were calculated to account for minor differences in environments within the polymer matrix.Three distinct structures were used for calculations: a BADGE-MA–styrene˙–BADGE-MA, a styrene–styrene˙–styrene and a styrene–styryl˙ molecule (˙ indicates location of the radical, Fig. 6). The spectra calculated for a terminal styryl radical show a high degree of variation in hyperfine coupling patterns and a weighted sum cannot be obtained that matches the experimental spectrum well (Fig. 6C). DFT calculations are consistent with the 18+-line signal observed by Buback et al.,29 including the complete collapse of hyperfine coupling upon deuteration. Interestingly, most (9/10) conformers of the BADGE-MA–styrene˙–BADGE-MA molecule show an isotropic signal without resolvable hyperfine coupling. Only one conformer shows a spectrum that is comparable to the H8–styrene EPR spectra. Upon deuteration coupling to protons from the BADGE-MA unit is retained (Fig. 6A, conformer 2).
 | ||
| Fig. 6 DFT calculations of (A) BADGE-MA–styrene˙–BADGE-MA, (B) a styrene–styrene˙–styrene and (C) a styrene–styryl˙ with structures used for DFT calculations (left) and the calculated spectra for 10 conformers with H8–styrene (middle) and D8–styrene (right) generated with EasySpin33 using DFT calculated parameters. The red part in A shows the part of the molecule derived from BADGE-MA which is unaffected by deuteration in the experimental spectra. Note that the spectra in C are stacked for clarity. | ||
In the case of styrene–styrene˙–styrene, most conformers show features similar to the experimental spectra and deuteration causes a complete collapse of the signal, as is also observed experimentally (Fig. 6B). Thus, the observed styrenic radical is referred to as a polystyrene based species. Although in-chain radical species are not observed frequently in styrene and methacrylate polymerization, it should be noted that similar EPR spectra are observed with divinyl benzene, used as a ‘difunctional styrene’,25 as well as after γ-irradiation of polystyrene.26 The rapid change in viscosity during the auto-acceleration stage restricts diffusion and may lead to reactivity not observed in non-crosslinking styrene/methacrylate polymerizations.
Reaction progress monitored by Raman spectroscopy
The curing of the resin was monitored over time by Raman spectroscopy (Fig. 7). The spectrum is dominated by Raman scattering from styrene, however, changes due to polymerization of methacrylate units can be discerned also (vide infra, see ESI† for detailed description of spectra and assignments, Fig. S14 and Tables S5–S7†). Specifically, changes in alkene stretching at ca. 1630 cm−1 and in- and out-of-plane bending modes (1400 cm−1 and 750 cm−1, respectively) largely reflect the loss of styrene due to polymerization. Integration of the area of the bands associated with alkene (CC) stretching modes reveal three distinct phases in curing: initially consumption of alkene proceeds at a modest rate (phase 1), which is followed by a phase (2) in which the reaction accelerates until the reaction comes to a halt (phase 3) with ca. 70% conversion of styrene to polymer. The overlap of the CC stretching bands of styrene and methacrylate (1630 and 1637 cm−1, respectively) means the rate of conversion of each of the resin components cannot be distinguished readily by Raman spectroscopy and indeed the observed reaction rates are essentially those of polymerization of the monomer styrene. Reported reactivity ratios suggest they disappear almost at an equal rate. The alkene stretching band of D8–styrene is shifted to lower wavenumber with respect to H8–styrene, revealing the methacrylate stretching band. The intensity of the methacrylate band relative to that of the D8–styrene alkene stretching band shows clearly that the former is considerably (ca. 10 fold) weaker (Fig. 7 and S13–S15†).§ The Raman spectra with D8–styrene show that the conversion of styrene and methacrylate proceeds at approximately the same rate over the entire course of curing. These data deviate somewhat from earlier studies, for example, by Dua et al. in which the polymerization of styrene appeared to continue for longer than polymerization of methacrylate.7 In the present study, negligible conversion of styrene was observed after the reaction ceased (ca. 1 hour after addition of cumyl hydroperoxide) under isothermal conditions. Iodometric studies35–37 show an initial burst of hydroperoxide decomposition followed by a slow decrease in oxidant concentration over time (Fig. S15†). 20–25% of hydroperoxide still persists after 5 days in a styrene/methyl methacrylate model mixture.
 | ||
| Fig. 7 Raman spectra obtained during room temperature curing (polymerization) of BADGE-MA with H8–styrene (A, top) and D8–styrene (B, bottom). Expansions (lower spectra, right) show the disappearance of the CC bonds of H8–styrene (1630 cm−1), BADGE-MA (1637 cm−1) and D8–styrene (1577 cm−1). The change in integral over time is shown (lower spectra, left). Note that the band at 1600 cm−1 (H8–styrene) and 1536 cm−1 (D8–styrene), arising from the styrene CC ring stretch is decreased due to a loss in conjugation. Spectroscopic assignment of observed bands can be found in ESI (Fig. S14 and Tables S5–S7†). | ||
The expected inhibition and acceleration phases of the curing are apparent in the time dependent Raman spectral data and it is clear that curing has reached completion within 1 h. This result contrasts with the time dependence of the EPR spectrum of a curing resin, which does not show the appearance of signals from polymer based radicals in the first hour following initiation. The difference in time dependence even between samples of the same resin mixture monitored with different techniques may, however, be due to the marked sensitivity of the polymerization to temperature (Fig. S16†) and therefore simultaneous recording of EPR and Raman spectra of the same sample is required for direct comparison of apparent reaction rates. Optical access to the cavity of the EPR spectrometer allows for combined in situ operando EPR and Raman spectroscopy (Fig. 8), which confirms that the sudden appearance of the EPR signals after ca. 1 h coincides with the rapid decrease in reaction rate apparent from the Raman spectra.
 | ||
| Fig. 8 Simultaneous in situ Raman (left) and EPR (center) spectroscopy during the room temperature reaction of BADGE-MA with the non-reactive diluent ethylbenzene. The EPR signal (orange) emerges as the alkene conversion (Raman, blue) reaches its limit (right). Integrations over time (EPR and Raman spectra) were a rolling average over 10 spectra. EPR parameters: 0.01 mW (40 dB), gain 50 dB, sweep width 300 G, sweep time 45 s, 1 accumulation, 1 G modulation amplitude. Fig. S17:† graph with EPR spectra in mT. | ||
Raman and EPR spectroscopy of ethylbenzene/methacrylate resin mixtures
The curing of a resin containing ethylbenzene, a non-reactive diluent in place of styrene, was followed by Raman and EPR spectroscopy (Fig. 9). The absence of the strong alkene stretching band of the styrene allows for the polymerization of methacrylate to be determined, with ca. 70% consumption of methacrylate units. Conversion proceeds at a relatively constant rate over the entire curing period and did not show an auto-acceleration phase. Again, the characteristic in-chain polymethacrylate radicals appear only as conversion reaches its limit. The spectrum recorded of the cured resin reveals both the 5-line signal as well as additional weaker signal, 9 line, that corresponds to the signals obtained for methacrylate in styrene/BADGE-MA resins at higher temperatures (Fig. 4). Notably the cured ethylbenzene/BADGE-MA resin is relatively malleable and hence the appearance of radicals in both this and the styrene/BADGE-MA resin are unlikely to be due the build-up of mechanical stress as the glassy state is approached. Indeed, flash freezing to 77 K and subsequent warming to room temperature does not affect the EPR spectra of the cured resins either (Fig. 2).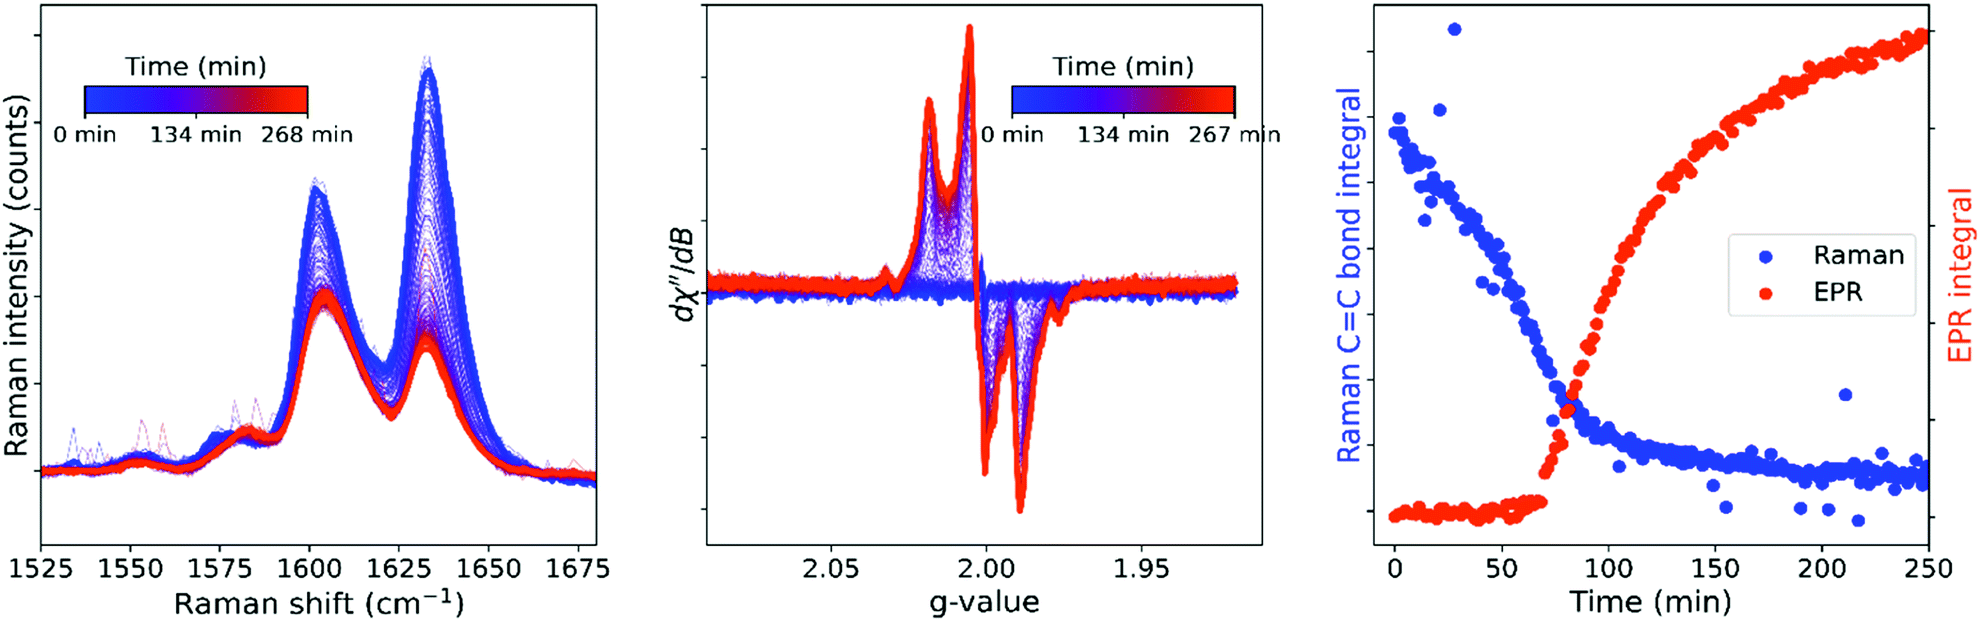 | ||
| Fig. 9 Simultaneous in situ Raman (left) and EPR (middle) spectroscopy during polymerization at room temperature. The CC stretch integral and EPR integral over time (right) show the emergence of the EPR signal as the CC stretch conversion comes to a halt. EPR parameters: 0.01 mW (40 dB), gain 50 dB, sweep width 300 G, sweep time 90 s, 1 accumulation, 2 G modulation amplitude. | ||
Raman spectroscopy of cured resin during thermal cycling
Resins cured at room temperature show approximately 70% incorporation of monomer into the polymer with negligible further conversion even over several weeks. However, heating a cured resin sample to 90 °C results in an increase in conversion (Fig. 10). The polymerization of the monomers in the resin starts again as the temperature of the sample reaches 50 °C and almost complete conversion is observed within the time taken to reach 90 °C, after which further conversion is not observed. These data confirm that the cessation of polymerization (curing) at ambient temperatures is not due to loss of propagating radicals. EPR and Raman spectra were recorded simultaneously on a cured resin sample also with a rapid ramping to 80 °C, showing again further conversion of alkene during the heating phase over the first minutes of the experiment (Fig. 11). The concomitant decrease in the intensity of the signals in the EPR spectrum is consistent with the temperature dependence of the spin polarization (vide supra) with no further changes in spectral shape. Over time and ca. 25 min after polymerization had ceased again, the intensity of the methacrylate based radical increases over 30 min before stabilizing. The overall change in spin concentration, however, is relatively minor. | ||
| Fig. 10 CC stretching band integral (left) of a sample originally cured at room temperature, which was subsequently heated to 90 °C. Temperature profile is shown in the graph on the left. Raman spectra are shown on the right. | ||
 | ||
| Fig. 11 Simultaneous in situ Raman (left) and EPR (middle) spectroscopy on a sample cured at room temperature during subsequently heating to 80 °C in the EPR spectrometer cavity. Alkene conversion precedes the change in EPR spectrum by >20 min (right). The value at g = 2.005 was chosen as a measure to follow the change in EPR spectrum (right, orange). | ||
Discussion
The polymerization of alkenes initiated through decomposition of alkyl hydroperoxides is a radical reaction in which a mixture of styryl and methacryl radicals are certainly present in the curing resin. In the present study direct spectral evidence for such radicals proved elusive, which could be rationalized by assuming that their concentration is below the detection limit (0.1–0.5 μM). However, the signals that appear towards the end and after resin curing are not those assigned to propagating radicals. DFT calculations, simulations and styrene deuteration confirm that the major part of these radicals is polystyrenic in-chain radicals with a minor contribution of terminal methacrylate radicals. Upon deuteration the hyperfine coupling of the polystyryl radicals is reduced and unresolved and hence the polystyrenic signal appears isotropic. Although alternating copolymerization is expected from reported reactivity ratios (Table 1), the data presented here indicates substantial block-copolymerization as alternating polymerization would result in only half of the proton-coupling being lost upon styrene deuteration.The EPR spectra recorded in the present study for cured styrene/methacrylate resins are comparable with those reported by Scott et al. in the photopolymerization of similar resin compositions,25 as well as those reported by Dondi et al. in the post-cure irradiation of polystyrene.26 The spectra are distinct from those obtained by Yamada et al. and Buback et al. in their efforts to obtain the spectrum of the propagating α-styryl radical.28,29
The radicals appear relatively suddenly towards the end of the autoacceleration (Trommsdorff) phase. The current understanding of the Trommsdorff effect is that the initiation and propagation rates are unaffected during this phase, while the increase in chain length and viscosity reduces the diffusion and thus the termination rate.14 The decrease in termination events leads to a net increase in radical concentration during this phase. Iodometric studies of the concentration of oxidant in the polymerizing resin show that hydroperoxide consumption is slow beyond a rapid burst of activity at the start. Following the initial burst in decomposition, the steady and slower decomposition of the initiator should lead to a relatively constant rate of generation and termination of propagating radicals. In the present study the EPR signals due to radicals do not appear during the autoacceleration phase. Instead, it is only towards the end of this phase that radical signals due to in-chain polystyrene based and terminal BADGE-MA radicals appear and continue to increase in concentration well after polymerization had halted. The final concentration of radicals is ca. 2 mM, and hence an equal concentration of radicals capable of generating them is necessary. It is of note that although the methacrylate radical EPR signal is relatively unaffected by acquisition power (i.e., saturation effects) that of the styryl radical is highly sensitive to spectrometer power. It is therefore conceivable that the radicals responsible for propagation are present but not observed by EPR spectroscopy due to saturation, even with maximum power attenuation. The absence of signals in flash frozen samples at 77 K obtained during the acceleration phase indicates that broadening due to rapid relaxation is unlikely to play a role either. Furthermore, in the polymerization of the methacrylate based crosslinking monomer (BADGE-MA), in the absence of styrene, a similar conversion dependence for the appearance of non-propagating radicals is observed. Since this resin mixture does not form a hard glassy polymer, and indeed both styrene/BADGE-MA and ethylbenzene/BADGE-MA resins are flexible, stress-induced radical formation can be excluded. An alternative explanation for the absence of signals from propagating radicals is that they are subject to rapid relaxation by paramagnetic ions such as Co(II). UV-vis absorption spectroscopy and EPR spectroscopy indicate that the resting state of the cobalt catalyst is Co(III) and indeed the spectra with other catalysts, such as Mn(II) soaps, are identical in structure.
Heating a sample cured at room temperature to elevated temperatures (80 or 90 °C) induces a rapid increase in conversion. The observed radical concentration does not change in the early stages of the process and hence the observed styrene based species is thus not a resting state of the propagating radical that is responsible for the continuation of polymerization as the temperature is raised. After approximately 30 min and well after full conversion of alkene is observed, the concentration of methacrylate based radicals increases in samples held at higher temperatures. The total concentration of these radicals however remains lower than the concentration of styrene based radicals.
Conclusions
In the Co(II) 2-ethylhexanoate/cumene hydroperoxide initiated polymerization of a bisphenol A-based vinylester–styrene resin, organic radicals are observed only late in the polymerization, as the conversion comes to a halt. The radicals observed are mainly polystyrene based, with a small contribution of methacrylate based radicals. The concentration of these radicals was estimated at ca. 2 mM, well above the estimated concentrations for propagating radicals. When the sample is heated to 80 °C following a room temperature cure, conversion goes to completion rapidly but the contribution of the methacrylate based radicals increases more slowly and only to a minor extent. The polystyrene based radicals are still dominant, and the total radical concentration is largely unaffected.The sudden increase in observed radical concentration as the polymerization halts and then the continued increase in radical concentration for some time after polymerization has stopped is inconsistent with these radicals forming due to a late burst of initiator activation. Indeed, initiator decomposition is slow after an initial rapid burst in hydroperoxide consumption. Furthermore, the observed radicals are of a polystyrenic and methacrylic nature and do not arise from the initiator directly during polymerisation but may form either by reaction with propagating radicals or initiator radicals once the glassy state is reached and diffusion of monomer is no longer possible. The late appearance and growth of the signals as well as the obvious microwave power dependence of the polystyrene based radical signal suggests that propagating radicals are not responsible for the signals observed. Generation by mechanical stress developed within the cured resin was excluded based on experiments forming a non-glassy polymer. Similarly, Co(II) 2-ethylhexanoate does not influence the EPR spectra as the resting state of the catalyst is Co(III). Indeed, identical spectra are observed with other catalysts such as Mn(II) soaps. The absence of signals assignable to propagating radicals in the period leading up to and including the auto-acceleration phase was unexpected. The limit of detection for organic radicals under the conditions used was 0.1 to 0.5 μM and hence it is possible that concentration of propagating radicals was below this range. However, the rapid increase in radical concentration to 2 mM once conversion had ceased (i.e. in the glassy state) and the continued conversion seen when cured samples were heated to 80 °C, leads to the conclusion that radicals are present at higher concentrations but are simply not observable. Slow relaxation and saturation even at low power affects strongly the styrenic radical signal (but not the methacrylate based radical) and hence it is not unreasonable that the propagating radicals are affected by saturation even more so.
Efforts to replace cobalt from the initiator system rely on an understanding of the factors that control reaction kinetics, for example the use of inhibitors. The present study indicates that the radical concentrations during the polymerization are likely to be quite high and hence small variations due to the relative concentrations of propagating radicals may affect overall chain lengths in the cured resin, and hence performance of the final coating. Differences such as chain length are not apparent from Raman spectroscopy as this technique provides only a measure of conversion. However, although EPR spectroscopy does not reveal the concentration of propagating radicals directly, it may prove useful to estimate the total radical concentration during curing from the final observed spin concentration of the in-chain radicals. A change of initiator efficiency by a change in hydroperoxide decomposition catalyst will affect the concentration of radicals. This difference may in turn affect chain length and thus the physical properties of the material. Hence the focus on replacements for cobalt initiators may need to be on the pathways for peroxide decomposition rather than on the reaction kinetics themselves.
Author contributions
All authors contributed to the design of experiments and writing of the manuscript.Conflicts of interest
There are no conflicts to declare.Acknowledgements
This work is part of the Advanced Research Center for Chemical Building Blocks, ARC CBBC, which is co-founded and co-financed by the Netherlands Organisation for Scientific Research (NWO) and the Netherlands Ministry of Economic Affairs (2016.000.RUG). We thank the Center for Information Technology of the University of Groningen for their support and for providing access to the Peregrine high performance computing cluster.Notes and references
- G. H. Koch, M. P. H. Brongers, N. G. Thompson, Y. P. Virmani and J. H. Payer, Corrosion Cost and Preventive Strategies in the United States, 2002 Search PubMed.
- P. A. Sørensen, S. Kiil, K. Dam-Johansen and C. E. Weinell, J. Coat. Technol. Res., 2009, 6, 135–176 CrossRef.
- V. B. Møller, K. Dam-Johansen, S. M. Frankær and S. Kiil, J. Coat. Technol. Res., 2017, 14, 279–306 CrossRef.
- A. Kandelbauer, G. Tondi, O. C. Zaske and S. H. Goodman, in Handbook of Thermoset Plastics, Elsevier, 2014, pp. 111–172 Search PubMed.
- G. Moad and D. H. Solomon, in The Chemistry of Radical Polymerization, Elsevier, 2005, pp. 49–166 Search PubMed.
- A. Rudin and P. Choi, in The Elements of Polymer Science & Engineering, Elsevier, 2013, pp. 341–389 Search PubMed.
- S. Dua, R. L. Mccullough and G. R. Palmese, Polym. Compos., 1999, 20, 379–391 CrossRef CAS.
- H. Kesteloot, J. Roelandt, J. Willems, J. H. Claes and J. V. Joossens, Circulation, 1968, 37, 854–864 CrossRef CAS PubMed.
- A. Oller and H. Bates, J. Environ. Monit., 2003, 5, 71N RSC.
- W. Stopford, J. Turner, D. Cappellini and T. Brock, J. Environ. Monit., 2003, 5, 675–680 RSC.
- R. Van Gorkum and E. Bouwman, Coord. Chem. Rev., 2005, 249, 1709–1728 CrossRef CAS.
- J. W. De Boer, P. V. Wesenhagen, E. C. M. Wenker, K. Maaijen, F. Gol, H. Gibbs and R. Hage, Eur. J. Inorg. Chem., 2013, 3581–3591 CrossRef CAS.
- V. E. Trommsdorff, H. Köhle and P. Lagally, Makromol. Chem., 1948, 1, 169–198 CrossRef.
- K. J. Abbey and D. J. Zalucha, in Handbook of Industrial Chemistry and Biotechnology, ed. J. A. Kent, Springer US, Boston, MA, 2012, pp. 549–572 Search PubMed.
- F. R. Mayo, F. M. Lewis and C. Walling, J. Am. Chem. Soc., 1948, 70, 1529–1533 CrossRef CAS.
- F. R. Mayo and C. Walling, Chem. Rev., 1950, 46, 191–287 CrossRef CAS PubMed.
- B. Sandner, S. Kammer and S. Wartewig, Polymer, 1996, 37, 4705–4712 CrossRef CAS.
- R. P. Brill and G. R. Palmese, J. Appl. Polym. Sci., 2000, 76, 1572–1582 CrossRef CAS.
- Q. Mao, L. Bian and M. Huang, J. Polym. Res., 2011, 18, 1751–1756 CrossRef CAS.
- S. Ziaee and G. R. Palmese, J. Polym. Sci., Part B: Polym. Phys., 1999, 37, 725–744 CrossRef CAS.
- A. C. Rosario, E. Burts-Cooper and J. S. Riffle, Polymer, 2007, 48, 1203–1211 CrossRef CAS.
- H. Yang and L. J. Lee, Polym. Compos., 2001, 22, 668–679 CrossRef CAS.
- D. Truffier-Boutry, X. A. Gallez, S. Demoustier-Champagne, J. Devaux, M. Mestdagh, B. Champagne and G. Leloup, J. Polym. Sci., Part A: Polym. Chem., 2003, 41, 1691–1699 CrossRef CAS.
- A. da Silva Fontes, B. L. S. Vicentin, D. F. Valezi, M. F. da Costa, W. Sano and E. Di Mauro, Appl. Magn. Reson., 2014, 45, 681–692 CrossRef.
- T. F. Scott, W. D. Cook, J. S. Forsythe, C. N. Bowman and K. A. Berchtold, Macromolecules, 2003, 36, 6066–6074 CrossRef CAS.
- D. Dondi, A. Buttafava, A. Faucitano, M. Arimondi, O. Ballabio and P. Caracino, Radiat. Phys. Chem., 2009, 78, 521–524 CrossRef CAS.
- B. Yamada, M. Kageoka and T. Otsu, Macromolecules, 1991, 24, 5234–5236 CrossRef CAS.
- B. Yamada, M. Kageoka and T. Otsu, Macromolecules, 1992, 25, 4828–4831 CrossRef CAS.
- H. Kattner and M. Buback, Macromolecules, 2015, 48, 309–315 CrossRef CAS.
- K. A. Berchtold, T. W. Randolph and C. N. Bowman, Macromolecules, 2005, 38, 6954–6964 CrossRef CAS.
- W. D. Cook, G. P. Simon, P. J. Burchill, M. Lau and T. J. Fitch, J. Appl. Polym. Sci., 1997, 64, 769–781 CrossRef CAS.
- S. Stoll and A. Schweiger, J. Magn. Reson., 2006, 178, 42–55 CrossRef CAS PubMed.
- F. Neese, Wiley Interdiscip. Rev.: Comput. Mol. Sci., 2012, 2, 73–78 CAS.
- F. Neese, Wiley Interdiscip. Rev.: Comput. Mol. Sci., 2018, 8, 4–9 Search PubMed.
- R. D. Mair and A. J. Graupner, Anal. Chem., 1964, 36, 194–204 CrossRef CAS.
- S. Fukuzumi, S. Kuroda and T. Tanaka, J. Am. Chem. Soc., 1985, 107, 3020–3027 CrossRef CAS.
- Y.-H. Wang, M. L. Pegis, J. M. Mayer and S. S. Stahl, J. Am. Chem. Soc., 2017, 139, 16458–16461 CrossRef CAS PubMed.
- W. F. Schroeder, M. I. Aranguren and J. Borrajo, J. Appl. Polym. Sci., 2010, 115, 3081–3091 CrossRef CAS.
- R. X. E. Willemse and A. M. Van Herk, J. Am. Chem. Soc., 2006, 128, 4471–4480 CrossRef CAS PubMed.
Footnotes |
| † Electronic supplementary information (ESI) available. See DOI: 10.1039/d1ra09386j |
| ‡ As a simple model H8–styrene was fitted with 2 interacting nuclei, D8–styrene was fitted as a singlet. |
| § The overall reaction time for the polymerization with D8–styrene is longer than with H8–styrene. The difference is likely due to the higher concentration of inhibitor present in this reaction mixture rather than a kinetic isotope effect since the inhibitor was removed from H8–styrene but not from D8–styrene. |
| This journal is © The Royal Society of Chemistry 2022 |