
 Open Access Article
 This Open Access Article is licensed under a
 Creative Commons Attribution 3.0 Unported Licence
Correlation among the structural, electric and magnetic properties of Al3+ substituted Ni–Zn–Co ferrites
Nusrat Jahan *ab,
M. N. I. Khanc,
M. R. Hasanc,
M. S. Bashard,
A. Islame,
M. K. Alamf,
M. A. Hakimg and
J. I. Khandakera
*ab,
M. N. I. Khanc,
M. R. Hasanc,
M. S. Bashard,
A. Islame,
M. K. Alamf,
M. A. Hakimg and
J. I. Khandakera
aDepartment of Physics, Jahangirnagar University, Savar, Dhaka 1342, Bangladesh. E-mail: nusrat1974@yahoo.co.uk; hoqueh2003@yahoo.com; jahir-nanophysics@juniv.edu
bDepartment of Physics, American International University Bangladesh (AIUB), Dhaka 1229, Bangladesh
cMaterials Science Division, Atomic Energy Centre, Dhaka 1000, Bangladesh. E-mail: ni_khan77@yahoo.com; razibhasan68@gmail.com
dSustainable Energy Technology, Institute of Fuel Research & Development, BCSIR, Ministry of Science & Technology, Bangladesh. E-mail: bashar@agni.com
eDepartment of Physics, Magura Govt. Mahila College, Magura, Bangladesh. E-mail: amin418847@gmail.com
fDepartment of Physics, Materials Science Lab, Bangladesh University of Engineering & Technology, Dhaka 1000, Bangladesh. E-mail: khurshedphy@phy.buet.ac.bd
gDepartment of Glass and Ceramic Engineering, Bangladesh University of Engineering and Technology (BUET), Dhaka 1000, Bangladesh. E-mail: hakim.akm@gmail.com
First published on 18th May 2022
Abstract
This study explored the structural, electrical, and magnetic properties of diamagnetic aluminium (Al3+) substituted nickel-zinc-cobalt (Ni–Zn–Co) mixed spinel ferrites, though the research on this area is in the infancy stage. Single-phase cubic spinel structures with the Fd![[3 with combining macron]](https://www.rsc.org/images/entities/char_0033_0304.gif) m space group of the synthesized Ni0.4Zn0.35Co0.25Fe(2−x)AlxO4 (0 ≤ x ≤ 0.12) ferrite samples were confirmed by X-ray diffraction (XRD) analysis. The average particle size ranged from 0.67 to 0.39 μm. Selected area electron diffraction (SAED) patterns were indexed according to the space group Fd3m, representing the particle's crystallinity. The optical band gaps ranged from 4.784 eV to 4.766 eV. Frequency-dependent dielectric constants and ac conductivity measurement suggested that the prepared ferrites were highly resistive. Relaxation times were reduced to a low value from 45.45 μs to 1.54 μs with the composition x. The Curie temperatures (Tc) were 615–623 K for all samples. Real part permeabilities (μ/) were relatively stable up to an extended frequency range of 106 Hz with relative quality factors (RQF) of around 103. Tuning of the properties indicates that the fabricated ferrites may be promising for high-frequency electronic devices.
m space group of the synthesized Ni0.4Zn0.35Co0.25Fe(2−x)AlxO4 (0 ≤ x ≤ 0.12) ferrite samples were confirmed by X-ray diffraction (XRD) analysis. The average particle size ranged from 0.67 to 0.39 μm. Selected area electron diffraction (SAED) patterns were indexed according to the space group Fd3m, representing the particle's crystallinity. The optical band gaps ranged from 4.784 eV to 4.766 eV. Frequency-dependent dielectric constants and ac conductivity measurement suggested that the prepared ferrites were highly resistive. Relaxation times were reduced to a low value from 45.45 μs to 1.54 μs with the composition x. The Curie temperatures (Tc) were 615–623 K for all samples. Real part permeabilities (μ/) were relatively stable up to an extended frequency range of 106 Hz with relative quality factors (RQF) of around 103. Tuning of the properties indicates that the fabricated ferrites may be promising for high-frequency electronic devices.
1. Introduction
Recently, ferrimagnetic oxides, or ferrites, have risen to significance due to their intelligent designs of chemical compositions and crystal structures with suitable characteristics.1 Spinel-based cubic ferrite possesses dual electric and magnetic properties depending on its structural compositions, cationic arrangements, sintering temperature, and fabrication methodology.1–4 Several synthesis techniques, including solid-state reactions, sol–gel, hydrothermal, ball milling, co-precipitation, etc., have been established over the years to fabricate ferrites of different sizes and shapes.5–8 Ferrites are ideal for high-quality multifaceted applications like home and industrial electronic devices, biomedical devices, catalysts, and EMI shielding in absorber materials because of their relatively high dielectric/magnetic loss, excellent chemical stability, and low cost.9 The features like the high permeability in ferrite make it an attractive candidate for wide-ranging applications such as microwaves, gas sensing, multilayer chip inductor, etc.4 Moreover, high Curie temperatures and moderate magnetic losses in the kHz range make ferrites promising for constructing heating inductors in the catalytic chemical reactors.10 Other than that, the function of ferrites for microwave heating and magnetic separation in chemical reactors offers a new scientific platform for hi-tech integration.10Mn–Zn ferrite has the largest production and market share among ferrimagnetic oxides due to their outstanding efficiency under the ac field at frequencies until 1 MHz.11 However, for the growing electronics, telecommunication, and power applications at higher frequencies, Ni–Zn ferrites are functioning remarkably.11 These materials retain higher electrical resistivity that certifies sufficiently low power losses and high magnetic responses in this high-frequency zone.11 Ni–Zn ferrite is generally touted among the spinel ferrites for its applications in magnetic, magnetoptical, and magnetodielectric devices.12 Besides, in recent years, Ni–Zn ferrites have paid attention to microwave applications, high-frequency devices like multilayer chip inductors, and electromagnetic interference filters because of their extraordinary magnetic properties and dielectric values while revealed to high frequencies.13,14
It was reported in the literature that the characteristics of spinel ferrite are tuned when doped with divalent and trivalent cations. It was also informed that substituting tetravalent ions improves ferrite's electromagnetic properties.15 Hosting Co in Ni–Zn ferrites can extend the operational band at higher frequencies, ranging until cut off.11 Thus, the Ni–Zn–Co ferrites can alter themselves to work effectively for devices that function above 1 MHz frequency.11
However, Das and Singh16 explored the structural, magnetic, and dielectric properties of Cu-doped Ni–Zn ferrites.13 They stated that the coercivity and saturation magnetization of Ni–Zn ferrites enhanced by substituting Cu content.13 Additionally, introducing Co2+ ions in Ni–Zn ferrites improves the strain sensitivity and resistive properties with a reduction in dielectric loss.17 Substitution of Zn2+ in Co ferrites leads to enhancement of dielectric and magnetic properties.17 Li et al.18 understood that charge carrier reorganization induced by magnetic field enhanced electron–electron correlation, increasing the electron-hopping between cations leads to resistance declination. Atif et al.19 investigated the magnetic and dielectric properties in Zn doped cobalt ferrite. They recorded the dielectric constant at low frequencies, implying its use as a stress sensor.8 Yaseneva et al.20 found that the Zn substitution caused a reduction of Tc.8 Li et al.21 stated that the partial inversion of cations (Ni, Fe) in nickel ferrite reallocated them inside the sublattices to generate magnetic hardening. Furthermore, adding Ni2+ ions in Co ferrites hindered the grain formation, resulting in low surface roughness.17 Ni–Zn–Co ferrites are an exciting system due to their wide range of biomedical and microwave devices.22
The substitution of nonmagnetic Al3+ in the nickel ferrites declined the charge transfer mechanism between Fe3+ and Fe2+ ions. Thus, a composition with less dielectric loss and high resistivity was found.3 These unique properties are suitable for manufacturing radio and microwave devices operating at L, S, and C bands.23 Other than that, Al3+ ions addition in Ni-ferrite inhibits grain growth and improves the ferrites' mechanical strength.24 Besides, Al–O–Al areas hinder grain growth after Al3+ ion substitution in Ni–Zn–Co ferrites.1 The substitution of Al3+ ions in nickel ferrites reduced the ferrites' coercivity and tuned the compositions suitable for high-frequency applications.23,24 Substitution of Al3+ ions in the cobalt ferrites reduces magnetic hardness and enhances electrical resistivity. Al3+ substituted cobalt ferrites' electrical and magnetic properties were perfect for power transformer core materials in communication applications.23
In the present work Al3+ doped Ni0.4Zn0.35Co0.25Fe(2−x)AlxO4 (0 ≤ x ≤ 0.12) mixed ferrites were fabricated through conventional ceramic technique. Ni0.4Zn0.35Co0.25Fe(2−x)AlxO4 (0 ≤ x ≤ 0.12) was a newly studied composition.1 However, these studied compositions' optical, electrical, and magnetic properties remain unexplored. Thus, the newly made ferrites studies appear intriguing to see how doping changes properties that make them appropriate to high-frequency devices.
2. Experimental
2.1 Sample preparation
Magnetic cubic spinels with chemical compositions Ni0.4Zn0.35Co0.25Fe(2−x)AlxO4 (0 ≤ x ≤ 0.12) prepared by the conventional ceramic technique. Merck, Germany's high purity (99.95–99.98%) raw materials (Ni2O3, ZnO, Co3O4, Fe2O3, and Al2O3) were weighted stoichiometric ratio. Oxides were hand-milled carefully for 6 h by using an agate mortar and pestle.25 The homogeneous mixtures were mixed with deionized (DI) water and compressed (5 kN) into circular tablets. The tablets were pre-sintered at 800 °C for 4 h at a heating rate of 5 °C min−1. Tablets were crushed and grounded again for 2 h. The grounded fine powders mingled with polyvinyl alcohol (5% PVA) as a binder and pressed at a pressure of 10 kN and 15 kN to prepare the pellet (8.4 mm) and toroid (11.8 mm) shape samples. Finally, the samples were sintered at a temperature of 1200 °C for 5 h in air and allowed to cool down gradually inside the furnace at room temperature. The prepared ferrites were ready for characterizations. The mechanism of the chemical synthesis in equation form is shown below:| Ni2O3 + ZnO + Co3O4 + Fe2O3 + Al2O3 → Ni0.4Zn0.35Co0.25Fe(2−x)AlxO4 (0 ≤ x ≤ 0.12) |
2.2 Characterizations
Single-phase structural identifications of the studied ferrites were conducted by the Fast Detector X-ray diffractometer (Model: SmartLab SE, Rigaku Corporation, Japan) using Cu-Kα radiation of wavelengths 1.54059 Å and 1.54441 Å at room temperature. Energy-Dispersive X-ray spectra and surface morphology of the typical samples with x = 0−x = 0.12 were directly examined by the high-resolution Field Emission Scanning Electron Microscopy (FE-SEM) (JEOL, JSM-7610F). Duel Beam UV-VIS spectrophotometer (Model no: U-2900, Hitachi High-Tech Corporation, Tokyo, Japan) recorded absorption spectra data. The bandgap of the samples was measured from the absorption spectra of wavenumbers 190 to 1100 cm−1. Dielectric and permeability measurements were carried out through the Impedance analyzer (Wayne Kerr 6500B). The temperature dependence magnetizations and Curie's temperature were measured using Quantum Design's physical properties measurement system (PPMS).3. Results and discussion
3.1 X-ray diffraction analysis
The X-ray diffraction spectra of all the synthesized ferrites were observed at room temperature (Fig. 1a). The X-ray pattern of the studied samples confirmed single-phase cubic spinels' formation without any secondary phase and impurities. The peaks indexed as (111), (220), (311), (222), (400), (422), (511), (440), (620), (533), (622), (444) according to the standard JCPDS card no. 52-0277and JCPDS card no. 08-0234.1 Rietveld refinement of the X-ray diffraction data using FULLPROF suite program26 brought from the Jahan et al. 2021(1). Refinement of the XRD data also confirmed the formation of Ni0.4Zn0.35Co0.25Fe(2−x)AlxO4 (0 ≤ x ≤ 0.12) spinel ferrite system with the space group Fdm (227) (27 22). The metal ions (Ni2+, Co2+, Zn2+, Fe3+, and Al3+) occupied the tetrahedral (8a) and octahedral (16d) crystallographic sites according to their site preferences.27 Rietveld's refinement of XRD data proceeded by refining the lattice parameters, background coefficient, and profile parameters first, followed by the refinement of Wyckoff positions and occupancy of the existing cations and anions. Table 1 represents the Wyckoff site with atomic coordinates (x, y, z) and occupancy of the ions that are present inside the compositions. The profile parameters found from the fitted patterns for all the samples are given in Jahan et al. 2021(1). The samples' noisy XRD data and the strongest reflections' intensities to the background ratios were very low, and slightly high values of profile factor (Rp) were obtained.1 The chi2 values range from 1.02 to 1.19,1 indicating refinements are reliable in the goodness of fitting approach towards the samples' specific structures. The crystal structure of the composition x = 0 drew through the Rietveld refinement XRD parameters CIF file and is shown in Fig. 1b.
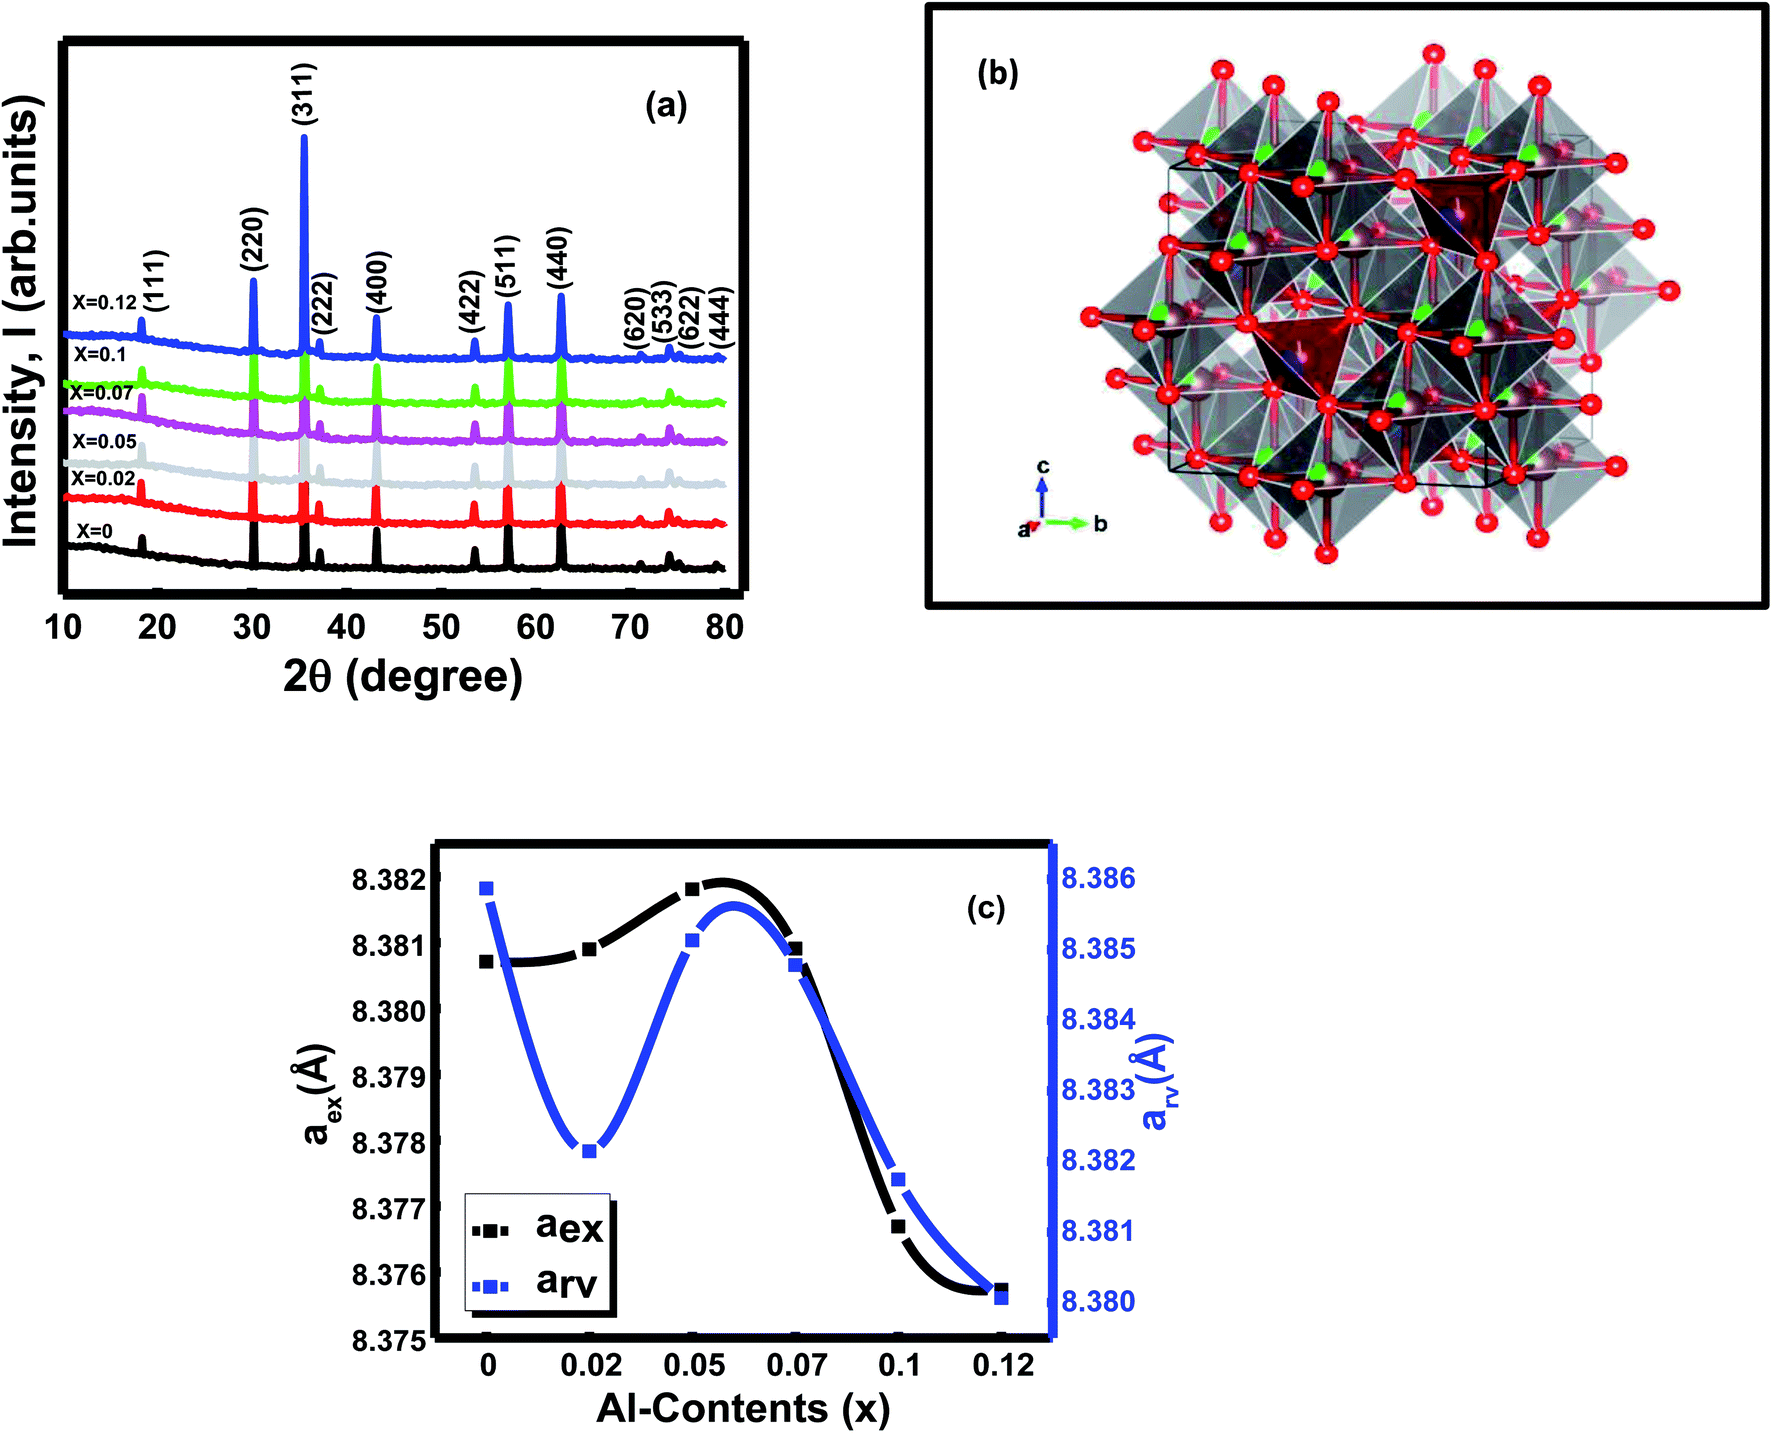 | ||
| Fig. 1 (a) X-ray patterns of Ni0.4Zn0.35Co0.25Fe(2−x)AlxO4 (0 ≤ x ≤ 0.12) ferrites (b) crystal structure of composition x = 0 and (c) variation of lattice constants (aexp and arv) with compositions x. | ||
| Ions | WS | x = 0 | x = 0.02 | x = 0.05 | x = 0.07 | x = 0.1 | x = 0.12 | ||||||
|---|---|---|---|---|---|---|---|---|---|---|---|---|---|
| x = y = z | Occ | x = y = z | Occ | x = y = z | Occ | x = y = z | Occ | x = y = z | Occ | x = y = z | Occ | ||
| O | 32(e) | 0.2552 | 0.1667 | 0.2565 | 0.1667 | 0.2542 | 0.1667 | 0.2572 | 0.1667 | 0.2566 | 0.1667 | 0.2569 | 0.1667 |
| FeT | 8(a) | 0.125 | 0.2125 | 0.125 | 0.0275 | 0.125 | 0.0283 | 0.125 | 0.0238 | 0.125 | 0.0283 | 0.125 | 0.0254 |
| FeO | 16(d) | 0.500 | 0.0621 | 0.500 | 0.055 | 0.500 | 0.0529 | 0.500 | 0.0567 | 0.500 | 0.0529 | 0.500 | 0.0529 |
| AlT | 8(a) | 0.125 | — | 0.125 | — | 0.125 | — | 0.125 | — | 0.125 | — | 0.125 | 0.0017 |
| AlO | 16(d) | 0.500 | — | 0.500 | 0.0008 | 0.500 | 0.0021 | 0.500 | 0.0029 | 0.500 | 0.0038 | 0.500 | 0.0033 |
| NiO | 16(d) | 0.500 | 0.0168 | 0.500 | 0.0168 | 0.500 | 0.0168 | 0.500 | 0.0168 | 0.500 | 0.0168 | 0.500 | 0.0168 |
| ZnT | 8(a) | 0.125 | 0.0146 | 0.125 | 0.0142 | 0.125 | 0.0133 | 0.125 | 0.0146 | 0.125 | 0.0133 | 0.125 | 0.0146 |
| ZnO | 16(d) | 0.500 | — | 0.500 | 0.0042 | 0.500 | 0.0013 | 0.500 | — | 0.500 | 0.0013 | 0.500 | — |
| CoT | 8(a) | 0.125 | 0.0058 | 0.125 | — | 0.125 | — | 0.125 | 0.0033 | 0.125 | — | 0.125 | — |
| CoO | 16(d) | 0.500 | 0.0046 | 0.500 | 0.0104 | 0.500 | 0.0104 | 0.500 | 0.0071 | 0.500 | 0.0104 | 0.500 | 0.0104 |
The lattice constants [experimental (aex) and Rietveld refined (arv)] were estimated by Nelson–Riley (N–R) extrapolation and Rietveld refinement method, respectively (Fig. 1c). The Al3+ (0.535 Å) ions were introduced by partially replacing Fe3+ (0.645 Å) ions in the octahedral site as a doping substance in the Ni–Zn–Co mixed ferrites. Depending upon the dopant's ionic radius and the cations distributions of the spinels, lattice parameters of the spinels show a decreasing trend with compositions of x = 0 − x = 0.12 (Fig. 1c).1 In addition, the lattice parameters and particle size of ferrite samples declined due to cation/anion vacancies, finite-size effect, lattice stress, etc.12
3.2 Porosities and densities
Bulk and X-ray densities play a crucial role in governing the polycrystalline ferrites' properties.28,29 The effect of Al3+ ions on the X-ray densities, bulk densities, and porosities is presented in Table 2. According to Jahan et al. 2021(1), grain size shows in Table 2. During synthesis, pores create inside the crystal structures of the samples. Hence, the compositions with x = 0 to x = 0.12 show less bulk densities than the theoretical (X-ray) densities (Table 2).28 The X-ray densities show a slight declination with Al contents x because Al3+ ions (26.98 g mol−1) have less molecular weight than the cations Fe3+ (55.84 g mol−1).29,30| Compositions | X-ray density ρx (g cm−3) | Bulk Density, ρB (g cm−3) | Porosity, P (%) | Grain size, D (μm) |
|---|---|---|---|---|
| Ni0.4Zn0.35Co0.25Fe2O4 | 5.45 | 5.2 | 4.50 | 0.55 |
| Ni0.4Zn0.35Co0.25Fe1.98Al0.02O4 | 5.43 | 5.18 | 4.64 | 0.47 |
| Ni0.4Zn0.35Co0.25Fe1.95Al0.05O4 | 5.41 | 5.07 | 6.29 | 0.43 |
| Ni0.4Zn0.35Co0.25Fe1.93Al0.07O4 | 5.40 | 5.09 | 5.72 | 0.45 |
| Ni0.4Zn0.35Co0.25Fe1.9Al0.1O4 | 5.39 | 5.06 | 6.08 | 0.42 |
| Ni0.4Zn0.35Co0.25Fe1.88Al0.12O4 | 5.38 | 4.98 | 7.37 | 0.38 |
Porosities, P (%), of the x = 0 − x = 0.12 samples can explain through the intragranular porosity (Pintra) and intergranular porosity (Pinter).31 During sintering, the thermal energy causes a force that pushes the grain boundaries to grow over pores. Thus the pore volume decreases and densifies the material.24 Sintering temperature (1200 °C) for the prepared ferrites remains the same throughout the studies; hence, intragranular porosities significantly have no effects on the compositions.29,31 During sintering inside the ferrites, intergranular porosities occur because of irregular particles.1,28 Besides, intergranular pores can change with the grain boundaries related to the grain growth (Table 2),1 demanding that the pores move together and merge, and a different transport mechanism indicates.28 Thus, an inverse relationship follows between the compositions' porosities and bulk densities.28 Furthermore, the gaseous oxygen flows through the pores, and the cations can diffuse around the pores. Due to more cations vacancies with reduced oxygen, the studied ferrites' porosities increase with Al concentrations x.28
3.3 TEM analysis
Fig. 2a shows the TEM micrographs and discloses that particles are irregular, and agglomerated. The average particle size estimated through TEM images indicates a decreasing trend with the composition that ranges from 0.67 to 0.39 μm (Fig. 2d). Thin areas of Al–O–Fe/Al–O–Al were generated during the particle growth with aluminum contents x that hindered further particle growth.1,32 Hence, particle size shows a decreasing trend with compositions. The agglomerated particles, on some level, are indicated due to the inter-magnetic interface between the particles.33 Besides, a reduction in surface energy is another cause of particle agglomeration.34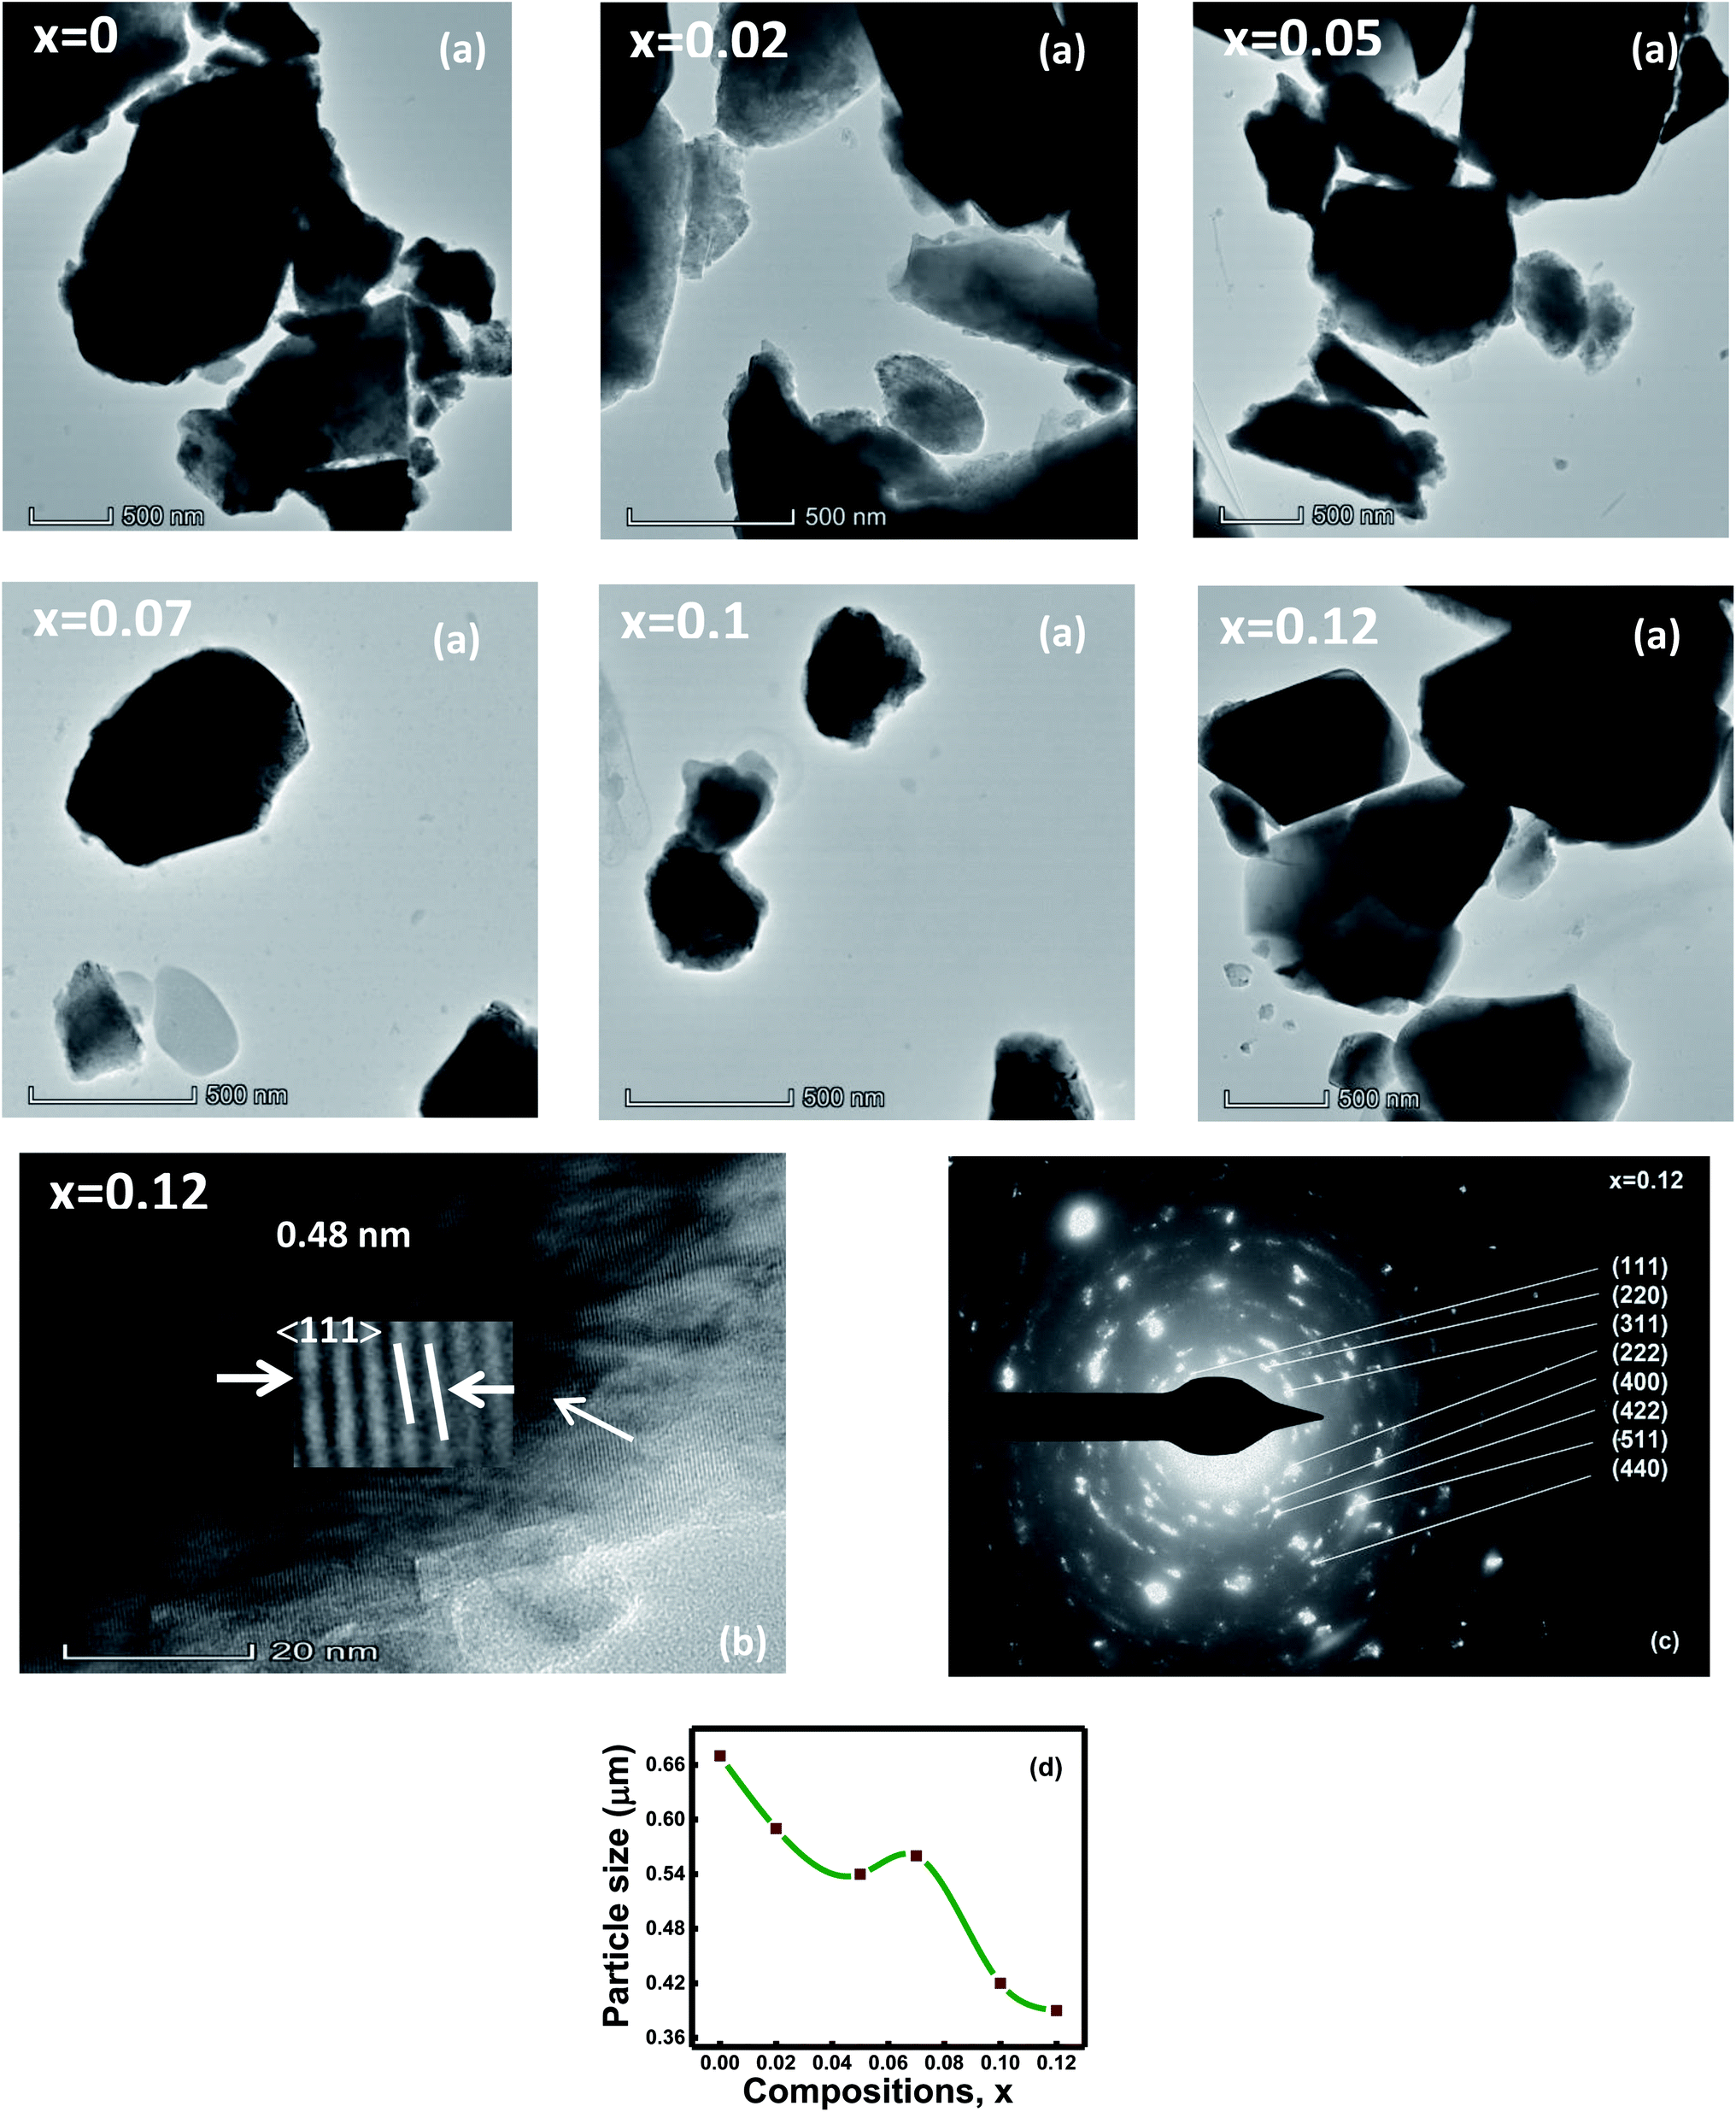 | ||
| Fig. 2 (a) TEM micrographs of all samples, (b) high-resolution transmission electron microscopy (HR-TEM) image of x = 0.12 sample, (c) selected area electron diffraction (SAED) pattern of x = 0.12 sample, and (d) variation of particle size (μm) with compositions x of the Ni0.4Zn0.35Co0.25Fe(2−x)AlxO4 (x = 0, x = 0.02, x = 0.05, x = 0.07, x = 0.1, and x = 0.12) spinel ferrites. | ||
The HR-TEM micrograph discloses an extremely ordered lattice fringes with the d-spacings of 0.25, 0.48, 0.29, and 0.48 nm estimated by ImageJ software, demonstrating the (311), (111), (220), and (111) planes for the compositions with Al content x = 0, 0.02, 0.05, 0.07, 0.1, and 0.12, correspondingly. These d-spacing values are well-matched with the XRD analysis. The lattice images show equally spaced lattice rows suggesting that the areas are well-crystalline and free from any lattice defects.33 Fig. 2b represents the HR-TEM micrograph of composition with x = 0.12.
The selected area (electron) diffraction (SAED) pattern of the ferrite samples displays the bright or dark bands due to the beams of light that are in phase or out of phase with one another.35 The SAED pattern of the composition with x = 0.12 is displayed in Fig. 2c. The diffraction rings of the SAED patterns are represented according to the space group Fd3m of the spinel-cubic lattice.
3.4 UV-vis absorption spectra studies
The absorption spectroscopy (UV-Vis) is one of the most important devices to measure the optical band gap energies (Eg in eV) of semiconductor materials like Al substituted Ni–Zn–Co mixed spinel ferrites. The ultraviolet-visible ray's absorption spectra were recorded in the wavelength range from 190 nm to 1100 nm at room temperature, but 249 nm to 265 nm is displayed (Fig. 3a). Hence, absorption peaks indicate that the photons are absorbed in the UV region around 253 nm. The electrons' photo-excitation between the valence and conduction bands or 3d5-3d44s1 transition occurs for Fe3+ ions inside the studied mixed ferrites.12 However, both the redshift and blueshift are observed for the samples. The probable reason is the changes in their morphologies, grain size, carrier concentrations, surface microstructures, tiny amounts of impurities, lattice strain, and oxygen vacancy.12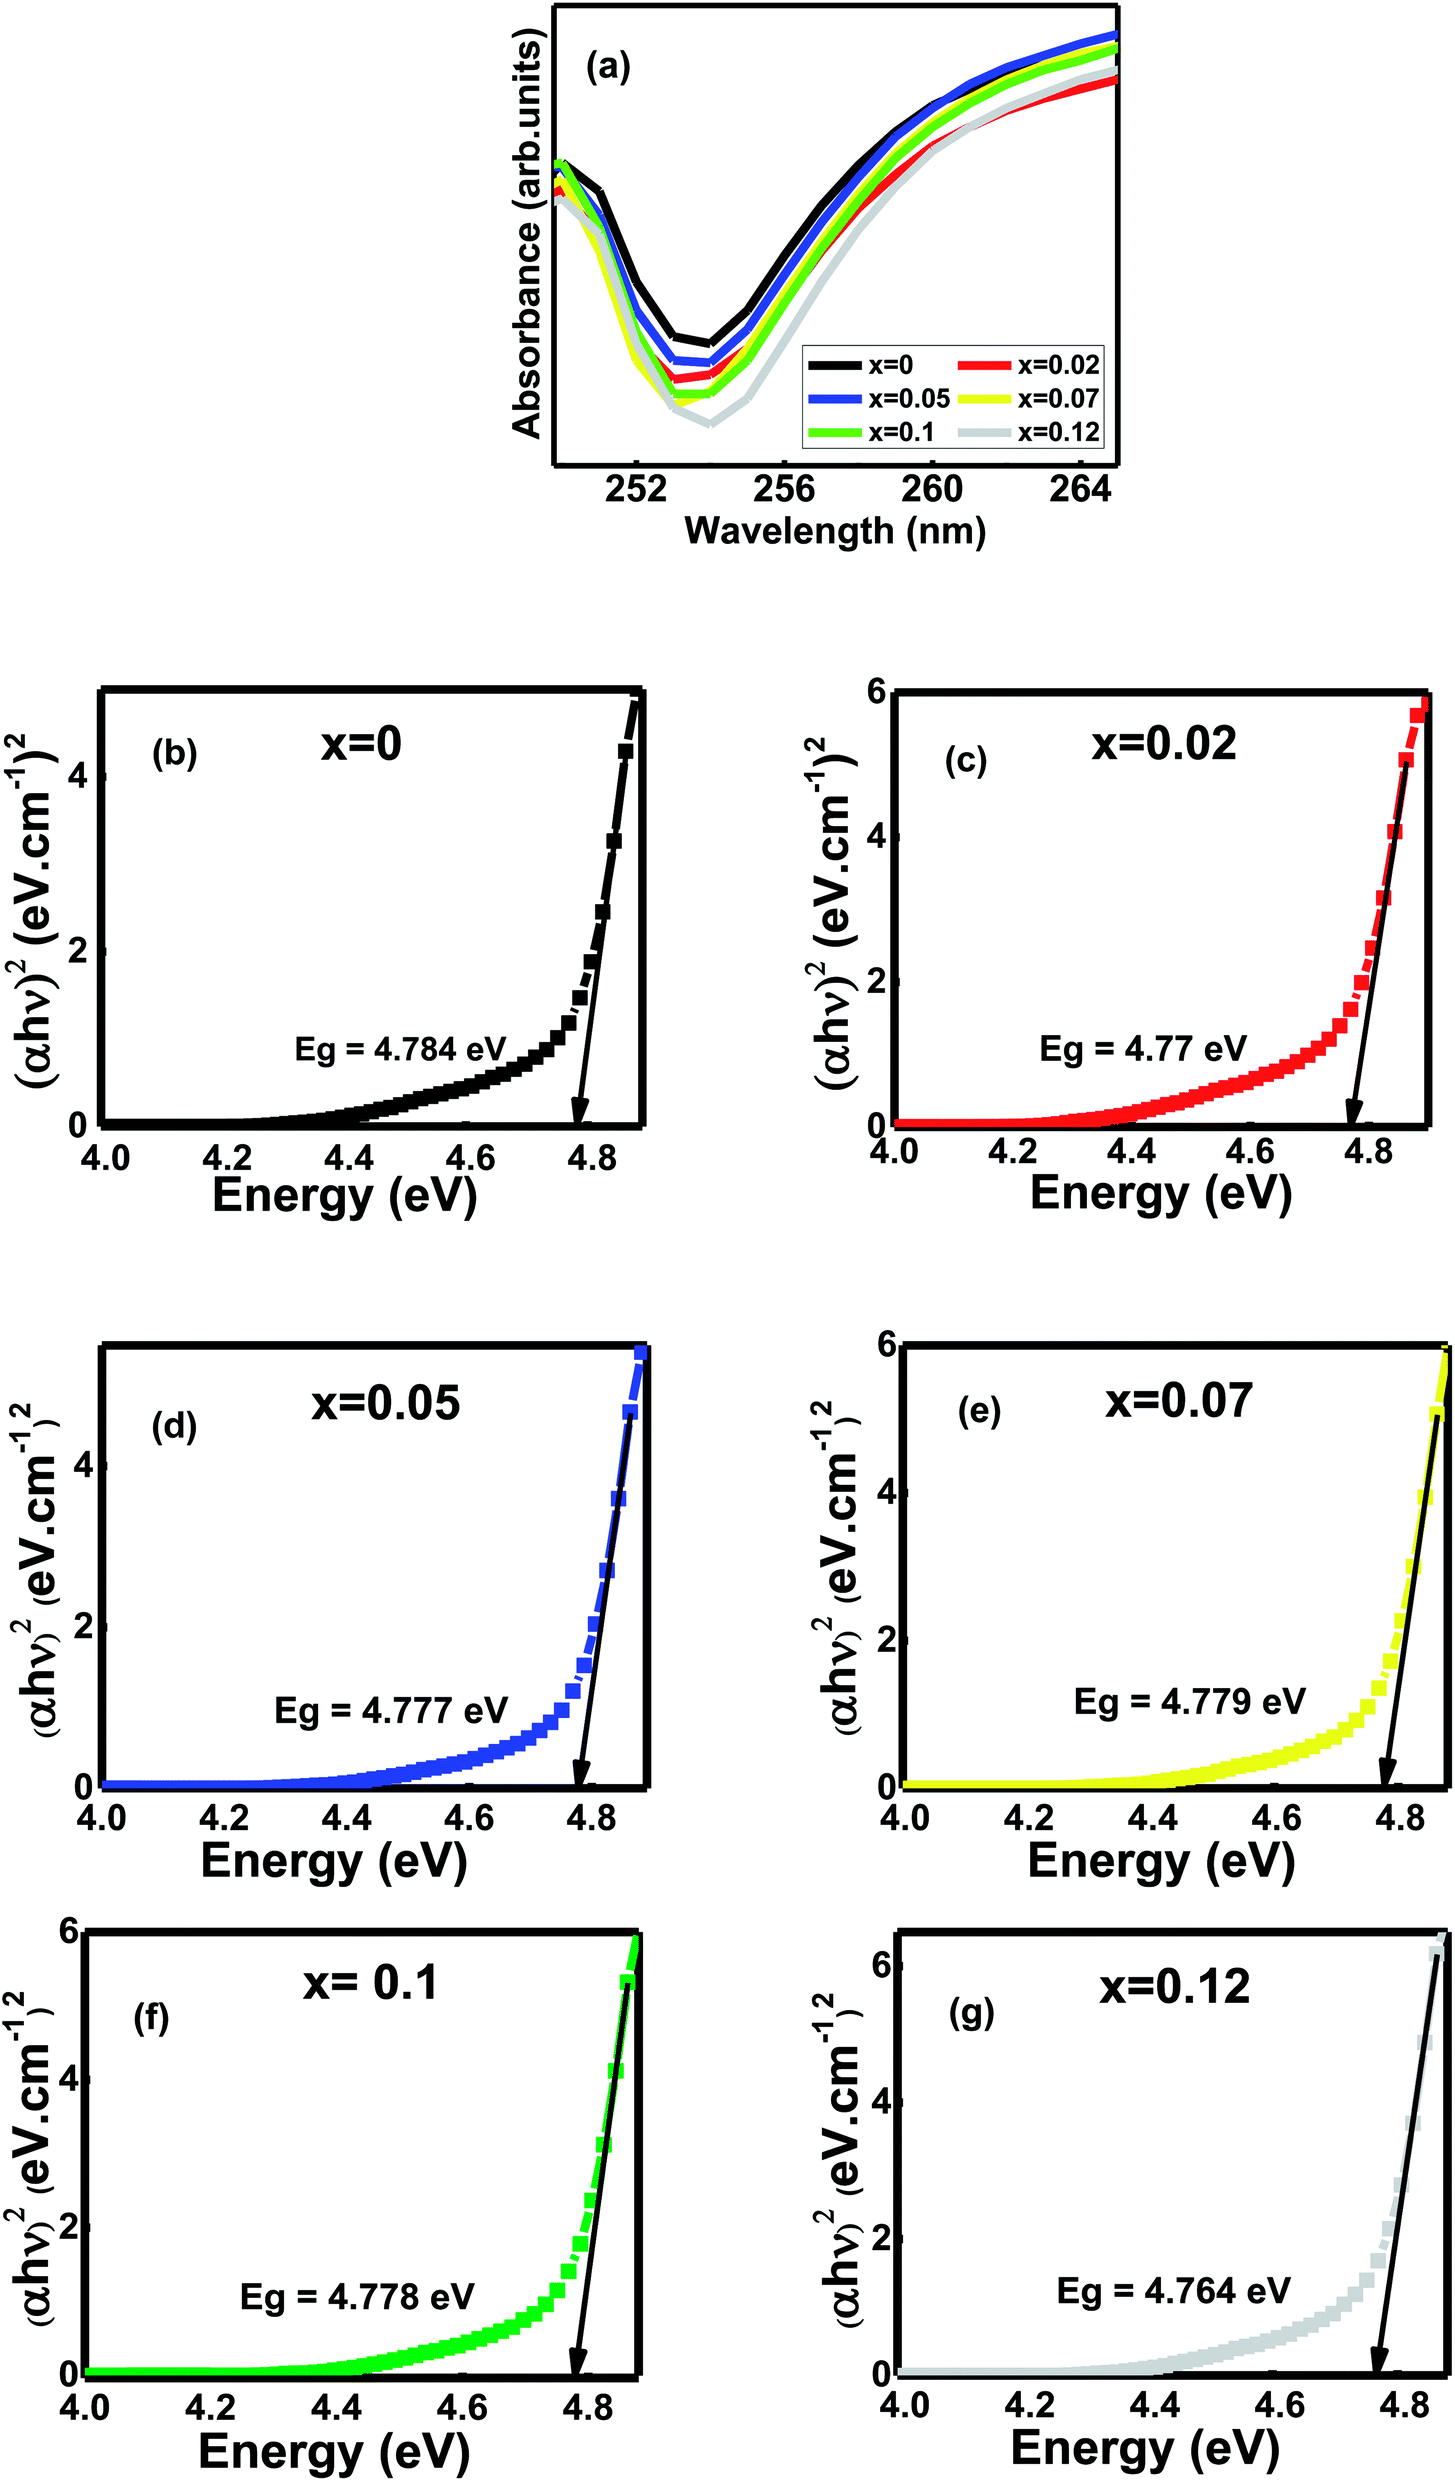 | ||
| Fig. 3 (a) UV-vis absorbance patterns at room temperature of Ni0.4Zn0.35Co0.25Fe(2−x)AlxO4 Ni0.4Zn0.35Co0.25Fe(2−x)AlxO4 (0 ≤ x ≤ 0.12) (b–g) Tauc plots of the compositions, x. | ||
The optical band gap (Eg) is the most significant material feature suitable for optoelectronic applications.12 The samples' optical energy band gaps were calculated from the Tauc's plots using the UV-Vis absorbance spectral data (Fig. 3b–g). Energy band gaps range from 4.784–4.764 eV. The slight blue shift and redshifts observe as the grain size decreases from 0.55–0.38 μm with Al contents x (Table 2).1 The main reason for bandgap energies variation is the grains' defects and sub-bandgap energy levels generated during sintering.12 Moreover, annealing temperature influences the concentration of oxygen vacancies inside the samples.12 It creates trapped exciton states that form a series of metastable energy levels within the energy gap, resulting in the redshift/blueshift of the optical bandgap that varies the absorption band's in the wavelength region around 253 nm.12
3.5 Electrical properties analysis
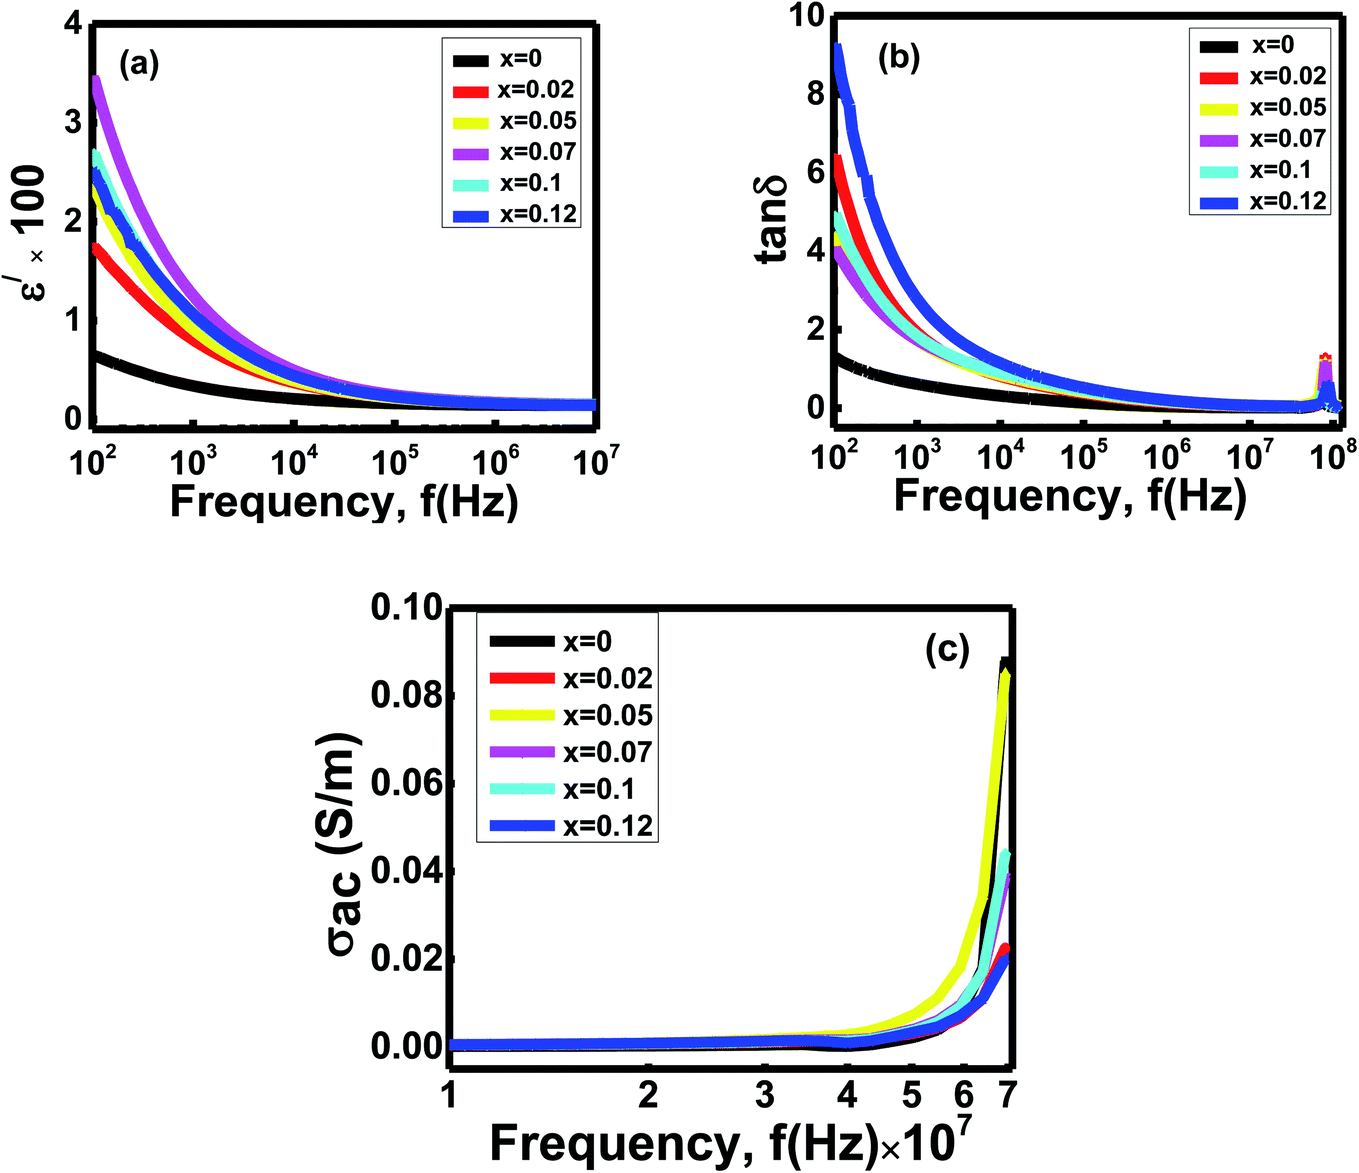 | ||
Fig. 4 Variation of (a) dielectric constants (ε/) (b) loss tangent (tan![[thin space (1/6-em)]](https://www.rsc.org/images/entities/char_2009.gif) δ) and (c) ac conductivity with frequency (f in Hz) of Ni0.4Zn0.35Co0.25Fe(2−x)AlxO4 (0 ≤ x ≤ 0.12) ferrites. δ) and (c) ac conductivity with frequency (f in Hz) of Ni0.4Zn0.35Co0.25Fe(2−x)AlxO4 (0 ≤ x ≤ 0.12) ferrites. | ||
Koop's two-layer model and Maxwell–Wagner polarization theory explain the variation ε/ with frequency.36 It assumes electrons' hoping occurs between cations (Fe3+ and Co2+ ions, etc.) and O2 in a network that creates interactions.36,37 But when the electrons try to cross the insulating barriers (grain boundaries), electrons face an obstacle and cannot move from one grain to another. As a result, the trapped electrons pile up across the grain boundaries, and space charge polarization happens inside the studied ferrites' grains.36,37 Moreover, during sintering, there is a possibility of creating oxygen ions vacancies and free charge carriers inside the voids. Later they also take part in space charge polarization.38 At low frequency, the electrons get enough time to move across the grains by following the ac field and can participate in space charge polarization. Due to the rapid swing of the ac field at high frequencies, the electrons try to change their direction too quickly. Hence, the charge carriers cannot follow the area's path because of insufficient time. They cannot accumulate across the grain boundaries, and space charge polarization disappears inside the grains. Therefore, as frequency increases, the polarization gradually reduces and is independent in the high-frequency range.36,38
There is a dispersion of dielectric constants for the x = 0 to x = 0.12 samples at a low-frequency region. The grain boundaries' interfacial areas alter due to the differences in grain sizes with Al concentrations x (Table 2).36 Hence, the accumulations of charge carriers across the grain boundaries vary with compositions x. Thus, the space charge polarization shows slight deviations as Al3+ ions doping x carry on,37 and dispersion occurs for the samples' dielectric constants at the low-frequencies zone.
The frequency-dependent loss tangent graph (Fig. 4b) follows the same trend as the dielectric constants vs. frequency graph (Fig. 4a). The dielectric loss tangents for the samples x decline with increasing frequencies but reach a small peak in the high-frequency range around 7 × 10⁷ Hz.
Relaxation and resistive loss are the two mechanisms responsible for showing this dielectric loss inside the spinels. During the resistive loss mechanism, the charge carriers take energy from the materials due to the hoping, which occurs at low frequencies. But as frequency increases, the charge carriers do not get enough time to absorb energy from the ac field and accumulate across the grain walls. As a consequence, the loss minimizes. Significant resistive losses are observed at low frequencies but reduced at high frequencies. At high frequencies, the relaxations of dipoles waste energy inside the grains of the studied ferrites. Hence, relaxation loss becomes predominant in a high-frequency zone.36 During the sintering process, charge defect dipoles form because of the rearrangements of cations states. The small peaks of loss tangent are observed at high frequency because the hopping electron's frequency gets the same value as the applied field frequency. The spectra' peaks of the loss tangents identify the ferrite samples' resonance at the high frequencies around 9 × 10⁷ Hz.36,38 Due to different electronic configurations and grain sizes of the compositions x, the carriers' mobility fluctuates with the applied fields. Hence, dielectric loss values scatter at the low-frequency zone, and dispersion occurs for the samples x.38
Variation of ac conductivities (σac = ωε0ε//)39 with frequencies of the studied ferrites are given in Fig. 4c. All the compositions exhibit almost flat plateaus until 107 Hz for conduction. After that, sharp changes occur in conductivities with dispersion at 107 to 108 Hz.
The increase in the ferrites' ac conductivity with frequencies is described through Koop's two-layer model and the space charge. Ferrites materials have high conducting grains separated by grain boundaries having a resistive nature.40 The grains are highly conductive at high frequencies but exhibit low conductivity at a low frequency depending on electrons' hopping and space charge polarization.41 When the frequency of the applied field rises, the grains become more lively by increasing the hopping between ions, enhancing the hopping frequency.38 Moreover, the applied frequency's pumping forces support the charge carriers to transfer between the different localized states and release the trapped charges from the other trapping centers. The electrons and charge carriers contribute to the conduction mechanism triggered by valence exchange between the cations present inside the sublattices.38,42 Thus a sharp enhancement in ac conductivities is observed for all the compositions. However, these hopping charge carriers strongly correlate to the conduction mechanism and dielectric behavior. As the applied field frequency increases, the dielectric constant decreases and obtains a constant value because the polarization could not follow the ac fields fluctuations. So the total polarization decreases and enhances the conductivities for all the ferrite samples.41
But in the low-frequency region, the ac field does not provide adequate energy to the carriers to overcome these insulating barriers. The samples behave like semiconductors, and a flat plateau is observed.43 A dispersion of conductions is occurred at a high-frequency zone because of several microstructural features and band gaps (Fig. 3c) of the studied ferrites. Besides, oxygen deficiency plays a vital role in charge carriers' mobility.44 Conductivity increases with the oxygen vacancy concentration.44 The changing of particle sizes with compositions, x, changes the number of grain boundaries that vary the electron mobility from one grain to another.44 Due to the grain boundary's conductive property, the samples' oxygen vacancy concentration may influence the conductivity. Hence, the hoping of electrons plays a significant role in increasing the conductivity of the studied ferrites.44
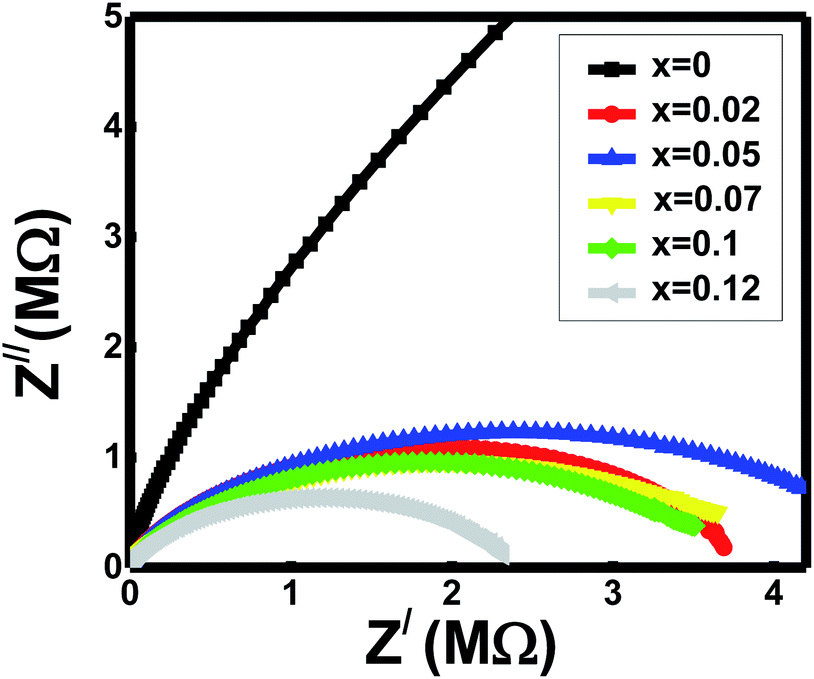 | ||
| Fig. 5 Cole–Cole plot of impedance of the Al-substituted Ni–Zn–Co ferrites. | ||
Cole–Cole plot represents the semicircle at the axis of the real part (Z/) in the low-frequency zone (right side) gives the values of total resistance (RT = Rg + Rgb) for spinels x. All the ferrites show high resistance values around 107 to 108 ohm. The samples' grain resistance (Rg) values were taken from the semicircle intersection with the real axis at the high-frequency zone (left side). The obtained values of Rg for the ferrites are within 50 ohms. Thus, Rgb calculates the relationship between the resistances, Rgb = RT − Rg. It observes from the spectra that the grain resistances are almost negligible in respect of total resistances. Hence, the grain boundary resistances (Rgb) for the compositions x are nearly equal to total resistance values, RT. The grain boundary resistances (Rgb) contribute to the present studied samples' conductions. It also reveals that the semicircles represented mainly the grain boundaries' characteristic behaviours.43,46
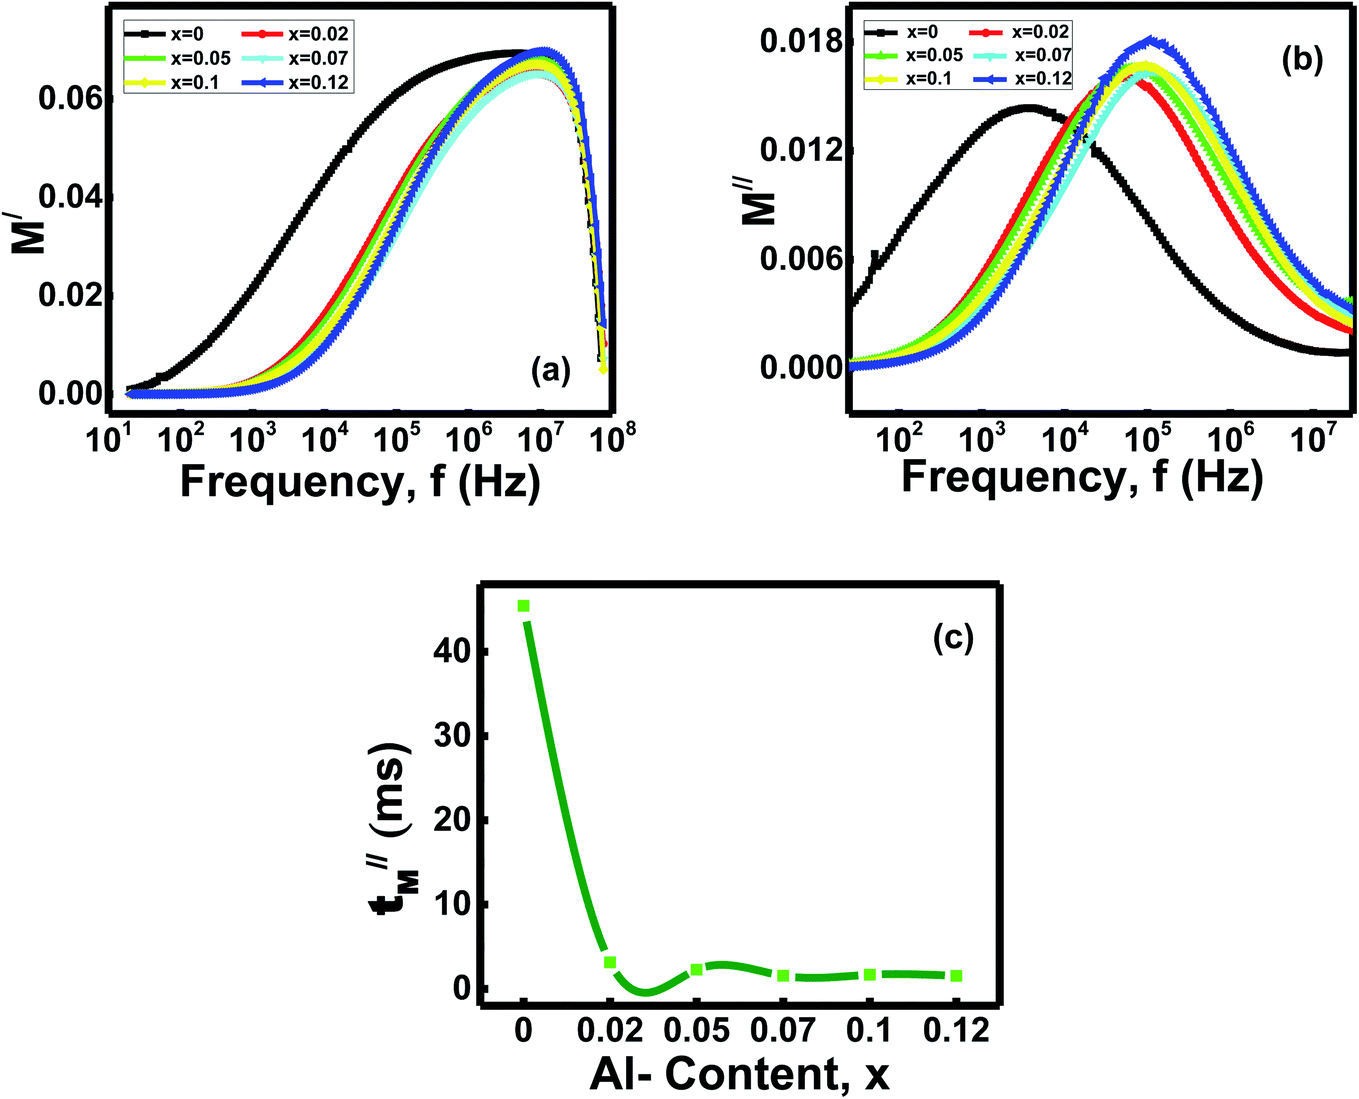 | ||
| Fig. 6 (a) Variation of real part complex electrical modulus with frequency (b) variation of imaginary part complex electrical modulus with frequency and (c) relaxation time (τ//M) with compositions of Ni0.4Zn0.35Co0.25Fe(2−x)AlxO4 (0 ≤ x ≤ 0.12) ferrites. | ||
Fig. 6b showed the variation of imaginary parts of electrical modulus [M//(ω) = ε///(ε/2 + ε//2)] with frequencies for the ferrites x.47 It observes M//(ω) yields low values at lower frequencies, but when the frequency reaches the range around 104 to 105 Hz, M//(ω) shows broad maxima for the samples x. Later on, the peaks of M//(ω) for the ferrites x gradually decrease to low values with other higher frequencies. The charge carriers can move long distances inside the grains at low frequencies and show very high capacitance values. As a result, the ferrite samples show very low M//(ω) values. The carriers are confined inside the potential wells and do not follow the ac fields at the high-frequency zone. Hence, the charges move in short-range distances.43 The ferrites at high frequencies exhibit wide and asymmetry peaks on both sides of the maxima.
Variation of relaxation times (τ//M = 1/2πfM//) with compositions x are shown in the Fig. 6c.48 The relaxation time for the x = 0 composition is 45.45 μs but drops down from 3.13–1.54 μs for the samples with x = 0.02 − x = 0.12. Thus, it identifies that the Al-doped ferrites have less relaxation time than ferrite without Al-doping.
3.6 Study of magnetic parameters
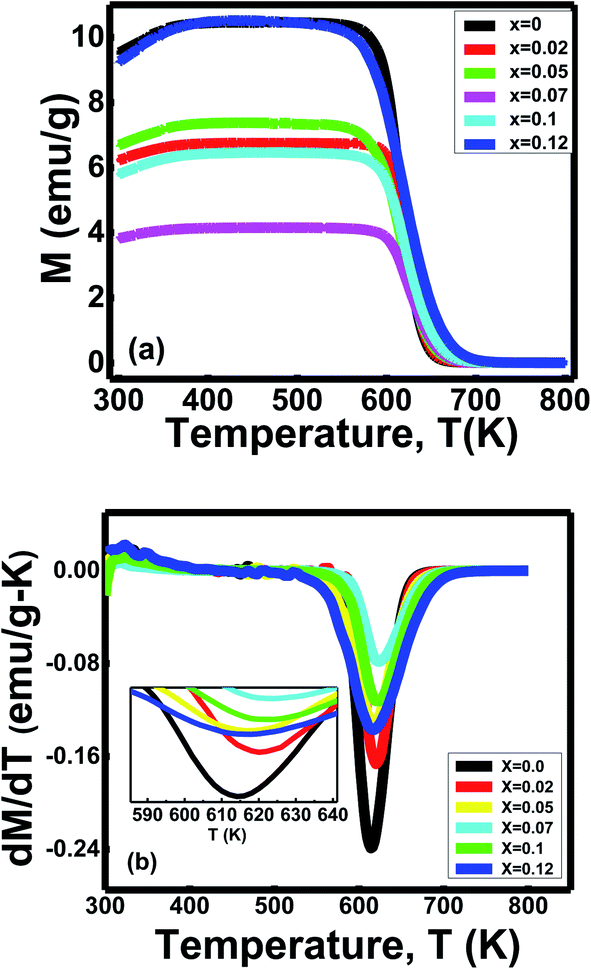 | ||
| Fig. 7 (a) Variation of magnetization with temperature, (b) dM/dT vs. T graph of Ni0.4Zn0.35Co0.25Fe(2−x)AlxO4 (0 ≤ x ≤ 0.12) ferrites. | ||
Ferrites' Curie temperature (Tc) fundamentally depends on A–B exchange interaction.12 The substitution of Al3+ ions reduces the Curie temperature due to the distortion of some ferromagnetic ordering inside the systems.49 The electronic configuration 2p6 of nonmagnetic ion Al3+ influences the ferromagnetic double exchange between Fe3+–O2––Fe3+.49 Therefore, a new coupling between Al3+–O2––Al3+ generates without contributing to the magnetic interactions.49 Hence, Curies temperature decreases for the sample with x = 0.05, x = 0.1 and x = 0.12. Moreover, the oxygen deficiency inside the spinels plays a significant role in the magnetic structures due to the changing valence states.50 It also diluted the superexchange interaction between cations through intervening oxygen, reducing Curie's temperature.50
Furthermore, Curie temperature is also influenced by grain size.12 The variation of Curie temperature with grain sizes is due to a change in cation arrangement between the A site and B site of the spinel lattice based on the strength of the exchange interactions.12 The decrease in lattice parameters caused increased A–B exchange interaction.12 As the exchange interaction is relatively strong, consistently higher energy is required to disorient the moment representing higher TC values with decreasing particle size for the sample with x = 0.02 and x = 0.07.12 Therefore, variation in Curie's temperature (Tc) indicates the formation of new ferrites with an overall enhancement of phase transition temperature (Tc).
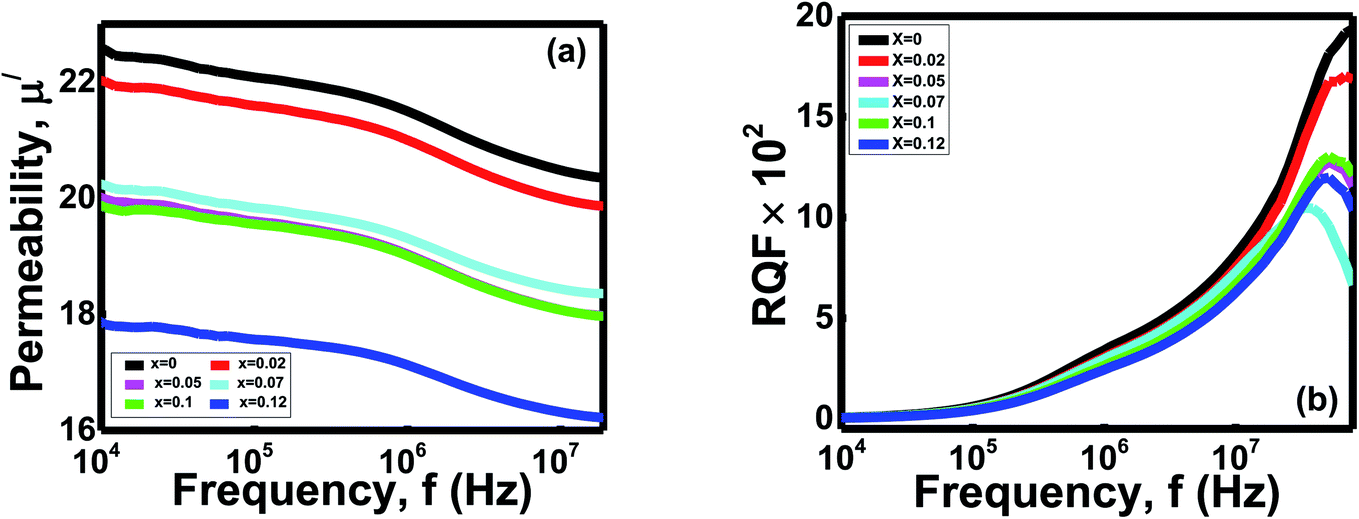 | ||
| Fig. 8 Variation of (a) real part of permeability (μ/) with frequency (b) RQF with frequency of Ni0.4Zn0.35Co0.25Fe(2−x)AlxO4 (0 ≤ x ≤ 0.12) ferrites. | ||
The μi of ferrites are affected by intrinsic features like favoured site residence and extrinsic properties such as density, porosity, and grain size.10,52 Polycrystalline ferrites' permeability is influenced by the superposition of the spin rotation and domain wall motion during synthesis.52 As μi is delicate with some factors, it is still exciting to conclude a specific conclusion for changing μi with concentration. Permeability is proportional to grain size for normal grain growth in ferrites.43 Variations in grain size of the samples can cause a change in every grain's domain walls number.43 As the domain wall movement controls the μi, any variation in the domain walls number manipulates μi/.52 Moreover, the declining trend of μi/demonstrated that the ionic radii of Al3+ might be larger than the lattice of spinel, so Al3+ finds the struggle to enter the spinel lattice. Hence, significant amounts of Al3+ resided at grain boundaries and formed a thin structure of Al–O–Al.1,52 This narrow structure around the magnetic domain hinders the grain boundary mobility and grain growth for the Ni0.4Zn0.35Co0.25Fe(2−x)AlxO4 (0 ≤ x ≤ 0.12) ferrites.51 Besides, μi/ displays a reducing trend with increasing frequency due to nonmagnetic impurities between grains and intragranular pores.52 It functions as a pinning center at higher frequencies and obstructs spin and domain wall motion.52 In the current study, density is inversely proportional to the porosity (Table 1), and bulk density is proportional to particle size. The correlation between the ferrite samples' porosity, bulk density, and particle size x indicates the highest μi/ obtain with the lowest porosity and maximum particle size.
The ferrites' relative quality factor (RQF) shows that the peak at the high-frequency range is around 107 to 108 Hz and then gradually decreases to low values (Fig. 8b). The ferrite with x = 0 shows the highest RQF than the samples with x = 0.02 − x = 0.12. The porosity and thin Al–O–Al area act as obstacles and pining centers against the studied compositions' domain wall motion.1,51 Thus, energy dissipates as a hysteresis loss due to overcoming these barriers to continue the domain wall motion,51 and different values of RQF obtain.
4. Conclusions
In the current study, Al3+-doped Ni–Zn–Co ferrite samples were successfully synthesized through the conventional ceramic technique. X-ray diffraction analysis evidenced the formation of the single-phase cubic spinel structures with phase group Fdm for all compositions. As demonstrated by TEM examinations, average particle sizes ranged from 0.67 to 0.39 μm. An insignificant conductivity until the frequency of 107 Hz and a sudden rise hereafter exhibited that the samples were very resistive. Relaxation times were reduced to a low value from 45.45 μs to 1.54 μs with increasing doping contents x, implying that the Al3+ played a vital role in the change carriers' mobility. Curie temperature (Tc) was 615 K–623 K, which showed an overall enhancement. Permeability was directly proportional to the grain size demonstrated for all samples. The undoped composition corresponds to the highest μi/ obtained with the lowest porosity and maximum particle size. The real part of permeability (μi/) was independent of frequency until 106 to 107 Hz with relative quality factors of around 103. Al3+ substitution implemented a central role in tuning the Ni–Zn–Co system's electromagnetic properties that can be promising materials for high-frequency devices.
Author contributions
Nusrat Jahan: conceptualization, methodology, software, validation, formal analysis, investigation, resources, data curation, roles/writing - original draft, visualization, writing-reviewing, and editing, M. N. I. Khan: supervision, writing-reviewing, and editing, M. R. Hasan: investigation, M. S. Bashar: investigation, A. Islam: investigation, M. K. Alam: investigation, M. A. Hakim: writing-reviewing, and editing, J. I. Khandaker: supervision, writing-reviewing, and editing.Conflicts of interest
The authors announce that they have no known competing financial interests or personal relationships that could have appeared to influence the work reported in this paper.References
- N. Jahan, J. I. Khandaker, S. I. Liba, S. M. Hoque and M. N. I. Khan, Structural analysis through cations distributions of diamagnetic Al3+ ions substituted Ni-Zn-Co ferrites, J. Alloy. Compd., 2021, 159226, DOI:10.1016/j.jallcom.2021.159226.
- R. Qindeel, N. H. Alonizan, E. A. Alghamdi and M. A. Awad, Synthesis and characterization of spinel ferrites for microwave devices, J. Sol-Gel Sci. Technol., 2021, 97, 593–599, DOI:10.1007/s10971-021-05470-9.
- T. K. Bromho, K. Ibrahim, H. Kabir, M. M. Rahman, K. Hasan, T. Ferdous, H. Taha, M. Altarawneh and Z. Jiang, Understanding the impacts of Al3+ substitutions on the enhancement of magnetic, dielectric and electrical behaviors of ceramic processed nickel-zinc mixed ferrites: FTIR assisted studies, Mater. Res. Bull., 2018, 97, 444–451, DOI:10.1016/j.materresbull.2017.09.013.
- P. Tiwari, S. N. Kane, F. Mazaleyrat and U. P. Deshpande, Composition assisted tuning properties of CoCrxFe2−xO4 spinel nano ferrites, Mater. Today: Proc., 2020, 32(2), 350–353, DOI:10.1016/j.matpr.2020.01.603.
- P. S. J. Bharadwaj, K. Prasad Gannavarapu, V. Sai Kollipara and R. Babu Dandamudi, Study of magneto-supercapacitance properties of nickel cobalt ferrite-activated carbon composite, J. Energy Storage, 2021, 36, 102444, DOI:10.1016/j.est.2021.102444.
- T. Tatarchuk, A. Shyichukc, I. Trawczyńskac, I. Yaremiyd, A. T. Pędziwiatre, P. Kurzydłoe, B. F. Bogacze and R. Gargula, Spinel cobalt(II) ferrite-chromites as catalysts for H2O2 decomposition: synthesis, morphology, cation distribution and antistructure model of active centers formation, Ceram. Int., 2020, 46(17), 27517–27530, DOI:10.1016/j.ceramint.2020.07.243.
- R. Tiwaria, M. Dea, H. S. Tewaria and S. K. Ghoshalb, Structural and magnetic properties of tailored NiFe2O4 nanostructures synthesized using auto-combustion method, Results Phys., 2020, 16, 102916, DOI:10.1016/j.rinp.2019.102916.
- M. I. A. A. Maksoud, A. El-Ghandour, G. S. El-Sayyad, R. A. Fahim, A. H. El-Hanbaly, M. Bekhit, E. K. Abdel-Khalek, H. H. El-Bahnasawy, M. Abd Elkodous, A. H. Ashour and A. S. Awed, Unveiling the Effect of Zn2+ Substitution in Enrichment of Structural, Magnetic, and Dielectric Properties of Cobalt Ferrite, J. Inorg. Organomet. Polym. Mater., 2020, 30, 3709–3721, DOI:10.1007/s10904-020-01523-8.
- M. Derakhshani, E. Taheri-Nassaj, M. Jazirehpour and S. M. Masoudpanah, Structural, magnetic, and gigahertz-range electromagnetic wave absorption properties of bulk Ni–Zn ferrite, Sci. Rep., 2021, 119468, DOI:10.1038/s41598-021-88930-0.
- D. A. Vinnik, V. E. Zhivulin, D. P. Sherstyuk, A. Y. Starikov, P. A. Zezyulina, S. A. Gudkova, D. A. Zherebtsov, K. N. Rozanov, S. V. Trukhanov, K. A. Astapovich, V. A. Turchenko, A. S. B. Sombra, D. Zhou, R. B. Jotania, C. Singh and A. V. Trukhanov, Electromagnetic properties of zinc–nickel ferrites in the frequency range of 0.05–10 GHz, Mater. Today Chem., 2021, 20, 100460, DOI:10.1016/j.mtchem.2021.100460.
- C. Stergiou, Microstructure and Electromagnetic Properties of Ni-Zn-Co Ferrite up to 20 GHz, Adv. Mater. Sci. Eng., 2016, 2016, 1934783, DOI:10.1155/2016/1934783.
- J. Massoudi, M. Smari, K. Nouri, E. Dhahri, K. Khirouni, S. Bertaina, L. Bessais and E. K. Hlil, Magnetic and spectroscopic properties of Ni–Zn–Al ferrite spinel: from the nanoscale to microscale, RSC Adv., 2020, 10, 34556, 10.1039/d0ra05522k.
- B. B. Patil1, A. D. Pawar, D. B. Bhosale, J. S. Ghodake, J. B. Thorat and T. J. Shinde, Effect of La3+ substitution on structural and magnetic parameters of Ni–Cu–Zn nano-ferrites, J. Nanostructure Chem., 2019, 9, 119–128, DOI:10.1007/s40097-019-0302-0.
- Q. Abbasa, G. Murtazaa, N. Muhammada, M. Ishfaqa, H. M. T. Iqbala, A. Asadb, G. A. Ashrafc and M. Z. Iqbald, Structural, dielectric and magnetic properties of (ZnFe2O4/polystyrene)nanocomposites synthesized by micro-emulsion technique, Ceram. Int., 2020, 46, 5920–5928, DOI:10.1016/j.ceramint.2019.11.045.
- B. A. Patil1, J. S. Kounsalye, A. V. Humbe and R. D. Kokate, Structural, magnetic, dielectric and hyperfine interaction studies of titanium (Ti4+)-substituted nickel ferrite (Ni1+xTixFe2−2xO4) nanoparticles, J. Mater. Sci.: Mater. Electron., 2021, 32, 4556–4567, DOI:10.1007/s10854-020-05197-3.
- P. S Das and G. P. Singh, Structural, magnetic and dielectric study of Cu substituted NiZn ferrite nanorod, J. Magn. Magn. Mater., 2016, 401, 918–924, DOI:10.1016/j.jmmm.2015.10.132.
- T. Dippong, E. A. Levei, I. G. Deac, E. Neag and O. Cadar, Influence of Cu2+, Ni2+, and Zn2+ Ions Doping on the Structure, Morphology, and Magnetic Properties of Co-Ferrite Embedded in SiO2 Matrix Obtained by an Innovative Sol-Gel Route, J. Nanomater., 2020, 10(1–12), 580, DOI:10.3390/nano10030580.
- J. Li, A. C. H. Huan, L. Wang, Y. Du and D. Feng, Interface effects on magnetoresistance and magnetic-field-reduced Raman scattering in magnetite, Phys. Rev. B, 2000, 61, 6876, DOI:10.1103/PhysRevB.61.6876.
- M. Atif, M. Asghar, M. Nadeem, W. Khalid, Z. Ali and S. Badshah, Structural, magnetic and dielectric study of Cu substituted NiZn ferrite nanorod, J. Phys. Chem. Solids, 2018, 123, 36–42, DOI:10.1016/j.jmmm.2015.10.132.
- P. Yaseneva, M. Bowker and G. Hutchings, Structural and magnetic properties of Zn-substituted cobalt ferrites prepared by co-precipitation method, Phys. Chem. Chem. Phys., 2011, 13, 18609–18614, 10.1039/c1cp21516g.
- J. Li, X. Zeng and Z. Xu, Partial cationic inversion-induced magnetic hardening of densely packed 23-nm-sized nanocrystallite-interacting nickel ferrite electrospun nanowires, Appl. Phys. Lett., 2013, 103, 232410, DOI:10.1063/1.4840320.
- A. M. Afzal, A. Manzoor, M. Z. Khan, M. F. Khan, A. Skindar, U. Anwer and Z. Ahmad, Effect of Cobalt Substitution on Magnetic, Resistivity and Dielectric Properties of Nickel–Zinc Ferrite (CoxNix−0.5Zn0.5Fe2O4), J. Nanoelectron. Optoelectron., 2019, 14, 1–9, DOI:10.1166/jno.2019.2566.
- R. V. Kumar, A. V. Anupama, R. Kumar, H. K. Choudhary, V. B. Khopkar and G. Aravind, Cation distributions and magnetism of Al-substituted CoFe2O4 – NiFe2O4 solid solution synthesis by sol-gel auto-combustion method, Ceram. Int., 2018, 44(17), 20708–20715, DOI:10.1016/j.ceramint.201808.065.
- V. A. Bharati, S. B. Somvanshi, A. V. Humbe, V. D. Murumkar, V. V. Sondur and K. M. Jadhav, Influence of trivalent Al-Cr co-substitution on the structural, morphological, and Mossbauer properties of nickel ferrite nanoparticles, J. Alloys Compd., 2020, 82, 153501, DOI:10.1016/j.jallcom.2019.153501.
- M. D. Hossain, A. T. M. K. Jamil, M. Sarowar Hossain, S. J. Ahmed, H. N. Das, R. Rashid, M. A. Hakim and M. N. I. Khan, Investigation on structure, thermodynamic and multifunctional properties of Ni–Zn–Co ferrite for Gd3+ substitution, RSC Adv., 2022, 12, 4656–4671, 10.1039/d1ra04762k.
- J. Rodríguez-Carvajal, Recent advances in magnetic structure determination by neutron powder diffraction, Phys. B, 1993, 192, 55–69, DOI:10.1016/0921-4526(93)90108-I.
- G. Datt, M. S. Bishwas, M. M. Raja and A. C. Abhyankar, Observation of magnetic anomalies in one-step solvothermally synthesized nickel–cobalt ferrite nanoparticles, Nanoscale, 2016, 8, 5200–5213, 10.1039/c5nr06791j.
- S. Akhter, D. P. Paul, M. A. Hakim, D. K. Saha, M. Al-Mamun and A. Parveen, Synthesis, Structural and Physical Properties of Cu1–xZnxFe2O4 Ferrites, JMSA, 2011, 2, 1675–1681, DOI:10.4236/msa.2011.211223.
- A. K. M. A. Hossain and M. L. Rahman, Enhancement of microstructure and initial Permeability due to Cu substitution in Ni0.50−xCuxZn0.50Fe2O4 ferrites, J. Magn. Magn. Mater., 2011, 323, 1954–1962, DOI:10.1016/j.jmmm.2011.02.031.
- S. B. Somvanshi, M. angesh V. Khedkar, P. B. Kharat and K. M. Jadhav, Influential diamagnetic magnesium (Mg2+) ion substitution in nano-spinel zinc ferrite (ZnFe2O4): thermal, structural, spectral, optical and physisorption analysis, Ceram. Int., 2020, 46(7), 8640–8650, DOI:10.1016/j.ceramint.2019.12.097.
- M. K. Raju, M. R. Raju, K. R. Babu, J. R. G. Patnaik and K. Samatha, Structural Observations, Density and Porosity Studies of Cu Substituted Ni-Zn Ferrite through Standard Ceramic Technique, Chem. Sci. Trans., 2015, 4(2), 325–330, DOI:10.7598/cst2015.983.
- R. V. Kumar, A. V. Anupama, R. Kumar, H. K. Choudhary, V. B. Khopkar and G. Aravind, Cation distributions and magnetism of Al-substituted CoFe2O4 – NiFe2O4 solid solution synthesis by sol-gel auto-combustion method, Ceram. Int., 2018, 44(17), 20708–20715, DOI:10.1016/j.ceramint.201808.065.
- A. V. Humbe, J. S. Kounsalye, S. B. Somvanshi, A. Kumar and K. M. Jadhav, Cation distribution, magnetic and hyperfine interaction studies of Ni−Zn spinel ferrites: role of Jahn Teller ion (Cu2+) substitution, Mater. Adv., 2020, 1, 880–890, 10.1039/d0ma00251h.
- S. Shrestha, B. Wang and P. Dutta, Nanoparticle processing:Understanding and controlling aggregation, Adv. Colloid Interface Sci., 2020, 279, 102162, DOI:10.1016/j.cis.2020.102162.
- P. Vlazan, I. Miron and P. Sfirloaga, Cobalt ferrite substituted with Mn: Synthesis method, characterization and magnetic properties, Ceram. Int., 2015, 41, 3760–3765, DOI:10.1016/j.ceramint.2014.11.051.
- H. B. Duvuru, S. K. Alla, S. K. Shaw, S. S. Meena, N. Gupta, B. B. V. S. V. Prasad, M. M. Kothawale, M. K. Kumar and N. K. Prasad, Magnetic and dielectric properties of Zn substituted cobalt oxide nanoparticles, Ceram. Int., 2019, 45, 16512–16520, DOI:10.1016/j.ceramint.2019.05.185.
- M. Atif, M. Idrees, M. Nadeem, M. Siddique and M. W. Ashraf, Investigate on structural, Dielectric, and impedance analysis of manganese substituted cobalt ferrite i.e., Co1−xMnxFe2O4 (0.0 ≤ x ≤ 0.4), RSC Adv., 2016, 6(25), 20876, 10.1039/c5ra20621a.
- P. Kaur, S. K. Chawla, S. S. Meena, S. M. Yusuf and S. B. Narang, Synthesis of Co-Zr doped nanocrystalline strontium hexaferrites by sol-gel auto- combustion route using sucrose as fuel and study of their structural, magnetic and electrical properties, Ceram. Int., 2016, 42, 14475–14489, DOI:10.1016/j.ceramint.2016.06.053.
- P. Donta, V. K. Katrapally and V. R. Pendyala, Dielectric Response of Nix Zn1−xAl Fe O4 Nanoferrites, NanoWorld J., 2016, 2(2), 27–34, DOI:10.17756/nwj.2016-028.
- A. S. Furhaj, K. Muhammad, S. S. Muhammad, H. M. N. H. K. Asghar, A. Sameen, P. Ayesha, U. R. Jalil, A. K. Muhammad and A. G. Zaheer, Effects of bismuth on structural and dielectric properties of cobalt-cadmium spinel ferrites fabricated via micro-emulsion route, Phys. B, 2019, 28(8), 088701 Search PubMed . http://cpb.iphy.ac.cn/article/2019/1996/cpb_28_8_088701.html.
- M. A. Darwish, A. V. Trukhanov, O. S. Senatov, A. T. Morchenko, S. A. Saafan, K. A. Astapovich, S. V. Trukhanov, E. L. Trukhanova, A. A. Pilyushkin, A. S. B. Sombra, D. Zhou, R. B. Jotania and C. Singh, Investigation of AC-Measurements of Epoxy/Ferrite Composites, Nanomater, 2020, 10, 492, DOI:10.3390/nano10030492.
- M. Hashim, S. Hcini, S. Kumar, S. E. Shirsath, E. M. Mohammed and R. Kumar, Structural, Dielectric, AC Conductivity, and Magnetic Properties of Cr3+ Substituted Ni–Mg Ferrite Nanoparticles, J. Nanoeng. Nanomanuf., 2013, 3, 1–8, DOI:10.1166/jnan.2013.1108.
- E. Oumezzine, S. Hcini, F. I. H. Rhouma and M. Oumezzine, Frequency and temperature dependence of conductance, impedance, and electrical modulus studies of Ni0.6Cu0.4Fe2O4 spinel ferrite, J. Alloys Compd., 2017, 726, 187–194, DOI:10.1016/j.jallcom.2017.07.298.
- M. Bouzayen, R. Dhahri, A. Benali, S. Chaabouni, K. Khirouni and B. F. O. Costa, Synthesis and investigation of oxygen deficiency effect on electric properties of La0.75Ba0.10Sr0.15FeO2.875−δ (δ = 0.00, 0.125 and 0.25) ferrites, J. Mater. Sci.: Mater. Electron., 2021, 32, 13000–13013, DOI:10.1007/s10854-020-04379-3.
- S. Kim, The intrinsic origin of the grain-boundary resistance in Sr-doped LaGaO3, Monatsh. Chem., 2009, 140, 1053–1057, DOI:10.1007/s00706-009-0136-4.
- H. Rahmouni, A. Selmi, K. Khirouni and N. Kallel, Chromium effects on the transport properties in La0.7Sr0.3Mn1−xCrxO3, J. Alloys Compd., 2012, 533, 93–96, DOI:10.1016/j.jallcom.2012.02.123.
- K. K. Bharathi, G. Markandeyulu and C. V. Ramana, Impedance Spectroscopic Characterization of Sm and Ho Doped Ni Ferrites, J. Electrochem. Soc., 2011, 158(3), G71–G78, DOI:10.1149/1.3534800.
- M. D. Hossain, M. N. I. Khan, A. Naharb, M. A. Ali, M. A. Matin, S. M. Hoque, M. A. Hakim and A. T. M. K. Jamil, Tailoring the properties of Ni-Zn-Co ferrites by Gd3+ substitution, J. Magn. Magn. Mater., 2020, 497, 165978, DOI:10.1016/j.jmmm.2019.165978.
- M. Baazaoui, Kh. Farah, F. Hosni, W. Cheikhrouhou-Koubaa and M. Oumezzine, Magnetocaloric Effect and Electron Paramagnetic Resonance Study of Gallium-Doped La0.65Bi0.05Sr0.3Mn1−xGaxO3 (x = 0 and 0.06) manganites, J. Low Temp. Phys., 2019, 196, 401–409, DOI:10.1007/s10909-019-02191-w.
- J. Sugiyama, T. Atsumi, A. Koiwai, T. Sasaki, T. Hioki, S. Noda and N. Kamegashira, The effect of oxygen deficiency on the structural phase transition and electronic and magnetic properties of the spinel LiMn2O4−δ, J. Phys.: Condens. Matter, 1997, 9, 1729–1741, DOI:10.1088/0953-8984/9/8/006.
- M. A. Ali, M. N. I. Khan, F.-U.-Z. Chowdhury, M. M. Hossain, A. K. M. A. Hossain, R. Rashid, A. Nahar, S. M. Hoque, M. A. Matin and M. M. Uddin, Yttrium-substituted Mg-Zn ferrites: correlation of physical properties with Yttrium content, J. Mater. Sci.: Mater. Electron., 2019, 30, 3258–13270, DOI:10.1007/s10854-019-01689-z.
- M. H. Rashid and A. K. M. A. Hossain, Structural, morphological and electromagnetic properties of Sc3+ doped Ni-Cu-Zn ferrites, Results Phys., 2018, 11, 888–895, DOI:10.1016/j.rinp.2018.10.050.
| This journal is © The Royal Society of Chemistry 2022 |