 Open Access Article
Preparation of Ag3PO4/α-Fe2O3 hybrid powders and their visible light catalytic performances
Ya Gaoa,
Haodong Mab,
Chengliang Hanb,
Chengmei Gui *bc and
Chonghai Dengb
aCenter of Analysis and Testing, Hefei University, Hefei 230601, China
bSchool of Energy Materials and Chemical Engineering, Hefei University, Hefei 230601, China. E-mail: guichengmei@163.com
cSchool of Chemistry and Chemical Engineering, Chaohu University, Hefei 230009, China
First published on 23rd February 2022
Abstract
The inefficiency of conventional photocatalytic treatment for removing rhodamine B is posing potential risks to ecological environments. Here, we construct a highly efficient photocatalyst consisting of Ag3PO4 and α-Fe2O3 hybrid powders for the treatment of rhodamine B. Ag3PO4 nanoparticles (nanoparticles, about 50 nm) are uniformly dispersed on the surface of α-Fe2O3 microcrystals (hexagonal sheet, about 1.5 μm). The Ag3PO4-deposited uniformity on the α-Fe2O3 surface first increased, then decreased on increasing the hybrid ratio of Ag3PO4 to α-Fe2O3. When the hybrid ratio of Ag3PO4 to α-Fe2O3 is 1![[thin space (1/6-em)]](https://www.rsc.org/images/entities/char_2009.gif) :
:![[thin space (1/6-em)]](https://www.rsc.org/images/entities/char_2009.gif) 2, the distribution of Ag3PO4 particles on the sheet α-Fe2O3 is more uniform with excellent Ag3PO4/α-Fe2O3 interface performance. The catalytic degradation efficiency of hybrids with the introduction of Ag3PO4 nanoparticles on the α-Fe2O3 surface reached 95%. More importantly, the hybrid material exhibits superior photocatalytic stability. Ag3PO4/α-Fe2O3 hybrids have good reusability, and the photocatalytic efficiency could still reach 72% after four reuses. The excellent photocatalytic activity of the as-prepared hybrids can be attributed to the heterostructure between Ag3PO4 and α-Fe2O3, which can effectively inhibit the photoelectron–hole recombination and broaden the visible light response range.
2, the distribution of Ag3PO4 particles on the sheet α-Fe2O3 is more uniform with excellent Ag3PO4/α-Fe2O3 interface performance. The catalytic degradation efficiency of hybrids with the introduction of Ag3PO4 nanoparticles on the α-Fe2O3 surface reached 95%. More importantly, the hybrid material exhibits superior photocatalytic stability. Ag3PO4/α-Fe2O3 hybrids have good reusability, and the photocatalytic efficiency could still reach 72% after four reuses. The excellent photocatalytic activity of the as-prepared hybrids can be attributed to the heterostructure between Ag3PO4 and α-Fe2O3, which can effectively inhibit the photoelectron–hole recombination and broaden the visible light response range.
1. Introduction
Due to its green, high efficiency, stability and environmental friendliness, photocatalytic wastewater treatment has become one of the most promising water treatment technologies.1–4 Nano-TiO2 photocatalyst is the most widely used catalyst.5–8 However, the application of TiO2 nanomaterials is limited due to their wide band gap (Eg = ∼2.4 eV), low quantum efficiency and low visible light utilization rate. It is well known that Ag3PO4 has a band gap of 2.36 eV and can absorb visible light and ultraviolet light with wavelengths less than 525 nm. The high quantum efficiency makes Ag3PO4 a potential visible light catalyst.9–13 However, the high cost and poor stability of Ag3PO4 limit its large-scale application. The reduction of silver ions to silver on the surface can be effectively inhibited by semiconductor compositing, metal ion doping and introducing carbon materials, and a heterostructure can be formed to improve the stability and photocatalytic activity of Ag3PO4. Du et al.14 successfully constructed novel Z-scheme Ag3PO4/g-C3N4 heterostructures with a high photocatalytic effect. The improved photocatalytic efficiency of Ag3PO4/g-C3N4 may be attributed to the formation of Z-scheme heterostructure structure and matching valence band and conduction band. Zhouyue Wu et al.15 designed and synthesized hybrid AgI@Ag3PO4 nanostructures for visible-light photodegradation of norfloxacin via a facile self-assembly formation strategy. The experimental results indicated that the AgI@Ag3PO4-15 sample presented the best visible-light photocatalytic performance, which was far better than that of pristine AgI and 2.96 times that of pristine Ag3PO4. Hematite (α-Fe2O3) has a narrow band gap (Eg ∼ 2.2 eV) and a maximum absorption wavelength of about 560 nm. It has a high utilization rate of visible light such as sunlight. Moreover, α-Fe2O3 is a very promising visible light catalyst with low price, environmental protection and high stability, and has a good application prospect in the field of water treatment. It has become one of the hot topics of research in recent years.16–19In this study, Ag3PO4/α-Fe2O3 hybrids were prepared by hydrothermal methods. Ag3PO4 nanoparticles were loaded on the hexagonal α-Fe2O3 sheets, which greatly improved the dispersion of Ag3PO4 nanoparticles and increased the specific surface area of hybrids. Thus, the visible light catalytic activity of Ag3PO4 will be further improved. The excellent photocatalytic activity of as-prepared hybrids can be attributed to the heterostructure between Ag3PO4 and α-Fe2O3, which can effectively inhibit the photoelectron–hole recombination and broaden the visible light response range.20–23
2. Experiment section
2.1 Preparation of Ag3PO4/α-Fe2O3 hybrids
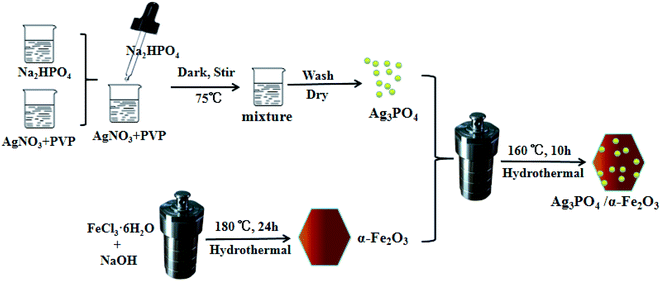
![[thin space (1/6-em)]](https://www.rsc.org/images/entities/char_2009.gif) :
:![[thin space (1/6-em)]](https://www.rsc.org/images/entities/char_2009.gif) 4, 1
4, 1![[thin space (1/6-em)]](https://www.rsc.org/images/entities/char_2009.gif) :
:![[thin space (1/6-em)]](https://www.rsc.org/images/entities/char_2009.gif) 3, 1
3, 1![[thin space (1/6-em)]](https://www.rsc.org/images/entities/char_2009.gif) :
:![[thin space (1/6-em)]](https://www.rsc.org/images/entities/char_2009.gif) 2 and 1
2 and 1![[thin space (1/6-em)]](https://www.rsc.org/images/entities/char_2009.gif) :
:![[thin space (1/6-em)]](https://www.rsc.org/images/entities/char_2009.gif) 1 of Ag3PO4 to α-Fe2O3 were also prepared, as shown in Fig. 1.
1 of Ag3PO4 to α-Fe2O3 were also prepared, as shown in Fig. 1.2.2 Photocatalytic experiments
First, 50 mg Ag3PO4/α-Fe2O3 hybrid powder was ultrasonically dispersed in 100 mL rhodamine B solution with a concentration of 5 mg L−1. Then, the solution was magnetically stirred for 30 min in a darkroom to enable the catalyst and dye reach the equilibrium of adsorption and desorption. The photocatalytic performance was tested using a xenon lamp as the light source to simulate sunlight. 4 mL of the solution was taken every 5 min, and the absorbance of the solution was measured by UV-Vis spectrophotometer after centrifugation.3. Results and discussions
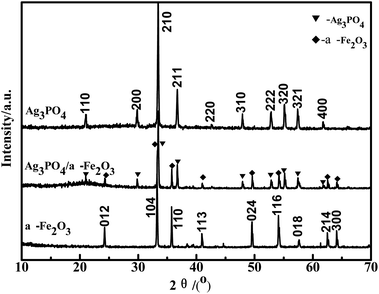
The crystal phase of pure Ag3PO4, α-Fe2O3 and the Ag3PO4/α-Fe2O3 hybrid (1![[thin space (1/6-em)]](https://www.rsc.org/images/entities/char_2009.gif) :
:![[thin space (1/6-em)]](https://www.rsc.org/images/entities/char_2009.gif) 2) was confirmed by XRD, as shown in Fig. 2. The characteristic peaks of Ag3PO4 in Fig. 2 correspond to PDF# 06-0505, which is the cubic phase silver phosphor. Diffraction peaks at 20.83°, 29.64°, 33.25°, 36.53°, 47.75°, 52.65°, 54.97°, 57.24° and 61.60° correspond to (110), (200), (210), (211), (310), (222), (320), (321), (400) crystal surfaces.24 The diffraction peaks at 24.14°, 33.15°, 35.61°, 49.48°, 54.09°, 62.45°, 63.99° correspond to the hexagonal α-Fe2O3 (012), (104), (110), (024), (116), (214), (300) crystal planes.25 The characteristic peaks of Ag3PO4 and α-Fe2O3 can be clearly observed in the XRD spectra of the Ag3PO4/α-Fe2O3 hybrid, which indicates that Ag3PO4 and α-Fe2O3 are successfully combined with each other. In addition, no diffraction peaks of other impurities were found on the XRD patterns, indicating that the samples had high purity. The XRD characteristic peaks of the hybrids did not change, indicating that the hybrid had no obvious effect on the crystal structure.
2) was confirmed by XRD, as shown in Fig. 2. The characteristic peaks of Ag3PO4 in Fig. 2 correspond to PDF# 06-0505, which is the cubic phase silver phosphor. Diffraction peaks at 20.83°, 29.64°, 33.25°, 36.53°, 47.75°, 52.65°, 54.97°, 57.24° and 61.60° correspond to (110), (200), (210), (211), (310), (222), (320), (321), (400) crystal surfaces.24 The diffraction peaks at 24.14°, 33.15°, 35.61°, 49.48°, 54.09°, 62.45°, 63.99° correspond to the hexagonal α-Fe2O3 (012), (104), (110), (024), (116), (214), (300) crystal planes.25 The characteristic peaks of Ag3PO4 and α-Fe2O3 can be clearly observed in the XRD spectra of the Ag3PO4/α-Fe2O3 hybrid, which indicates that Ag3PO4 and α-Fe2O3 are successfully combined with each other. In addition, no diffraction peaks of other impurities were found on the XRD patterns, indicating that the samples had high purity. The XRD characteristic peaks of the hybrids did not change, indicating that the hybrid had no obvious effect on the crystal structure.
The morphology and structure of the catalyst can significantly affect its catalytic performance. The morphology and composition of the Ag3PO4/α-Fe2O3 hybrid photocatalyst were characterized by scanning electron microscopy (SEM) and energy dispersive spectroscopy (EDS). Fig. 3 shows the SEM images of pure α-Fe2O3 and Ag3PO4/α-Fe2O3 hybrid (1![[thin space (1/6-em)]](https://www.rsc.org/images/entities/char_2009.gif) :
:![[thin space (1/6-em)]](https://www.rsc.org/images/entities/char_2009.gif) 2). Fig. 3(a) shows α-Fe2O3 is a uniform hexagonal sheet structure with a size of about 1.5 μm. In Fig. 3(b), the SEM images manifests that the small Ag3PO4 particles deposited on the α-Fe2O3 sheet surface, with sizes of about 50 nm. From the side view of Ag3PO4/α-Fe2O3 in Fig. 3(c), it can be seen that Ag3PO4 nanoparticles are closely bonded with α-Fe2O3 sheets, which is conducive to the migration of photoelectric charge carriers between them to form a hybrid catalyst with high catalytic activity.26
2). Fig. 3(a) shows α-Fe2O3 is a uniform hexagonal sheet structure with a size of about 1.5 μm. In Fig. 3(b), the SEM images manifests that the small Ag3PO4 particles deposited on the α-Fe2O3 sheet surface, with sizes of about 50 nm. From the side view of Ag3PO4/α-Fe2O3 in Fig. 3(c), it can be seen that Ag3PO4 nanoparticles are closely bonded with α-Fe2O3 sheets, which is conducive to the migration of photoelectric charge carriers between them to form a hybrid catalyst with high catalytic activity.26
Fig. 4 shows the SEM photos of Ag3PO4/α-Fe2O3 hybrids with different proportions. It can be clearly seen from Fig. 4 that with the increase in the hybrid ratio of Ag3PO4 and α-Fe2O3, the deposited uniformity of Ag3PO4 particles on α-Fe2O3 surface first increased, and then decreased. When the hybrid ratio of Ag3PO4 and α-Fe2O3 is 1![[thin space (1/6-em)]](https://www.rsc.org/images/entities/char_2009.gif) :
:![[thin space (1/6-em)]](https://www.rsc.org/images/entities/char_2009.gif) 2, the distribution of Ag3PO4 particles on the sheet α-Fe2O3 is more uniform and dispersed. In addition, the Ag3PO4/α-Fe2O3 hybrid exhibited excellent interface performance.
2, the distribution of Ag3PO4 particles on the sheet α-Fe2O3 is more uniform and dispersed. In addition, the Ag3PO4/α-Fe2O3 hybrid exhibited excellent interface performance.
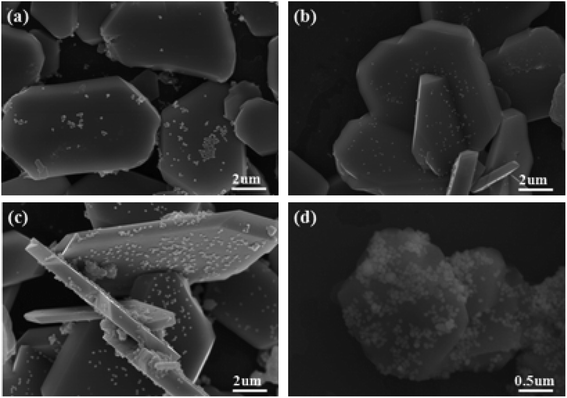 | ||
Fig. 4 SEM photographs of Ag3PO4/α-Fe2O3 hybrids with different proportions, the ratios of Ag3PO4 and α-Fe2O3 are: (a)1![[thin space (1/6-em)]](https://www.rsc.org/images/entities/char_2009.gif) : :![[thin space (1/6-em)]](https://www.rsc.org/images/entities/char_2009.gif) 4; (b) 1 4; (b) 1![[thin space (1/6-em)]](https://www.rsc.org/images/entities/char_2009.gif) : :![[thin space (1/6-em)]](https://www.rsc.org/images/entities/char_2009.gif) 3; (c) 1 3; (c) 1![[thin space (1/6-em)]](https://www.rsc.org/images/entities/char_2009.gif) : :![[thin space (1/6-em)]](https://www.rsc.org/images/entities/char_2009.gif) 2; (d) 1 2; (d) 1![[thin space (1/6-em)]](https://www.rsc.org/images/entities/char_2009.gif) : :![[thin space (1/6-em)]](https://www.rsc.org/images/entities/char_2009.gif) 1. 1. | ||
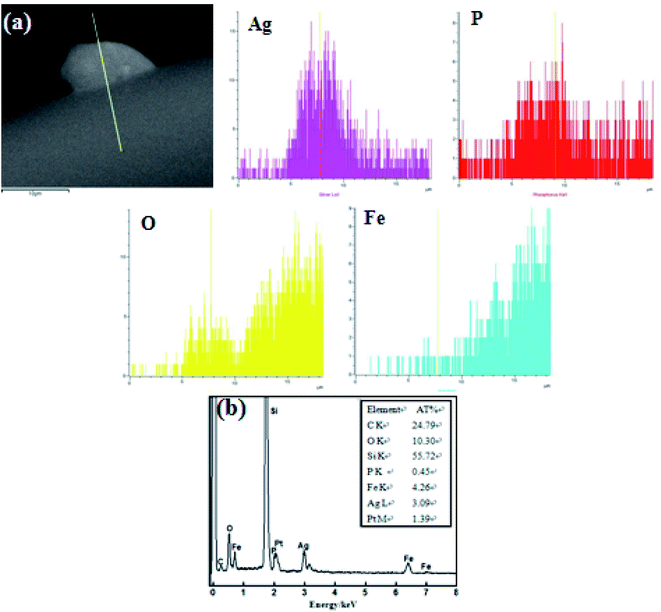
Fig. 5 demonstrates the EDS scan analysis spectrum of each Ag3PO4/α-Fe2O3 hybrid photocatalyst element. It can be seen from Fig. 5(a) that the small particles protruding from the sheet structure mainly contain Ag, P, O elements, and the sheet structure is mainly composed of Fe and O elements. According to the line scanning analysis figure, the small particles on the α-Fe2O3 sheet structure are Ag3PO4 particles, which further proves that the Ag3PO4/α-Fe2O3 hybrid photocatalyst has been successfully prepared. Fig. 5(b) shows that O, Fe, P, and Ag elements exist in the hybrid, and from the AT% of Ag/Fe = 3.09/4.26 = 0.73 ≈ 0.75 (= 3/4), it can be roughly inferred that the mole ratio of Ag3PO4 and α-Fe2O3 is 1![[thin space (1/6-em)]](https://www.rsc.org/images/entities/char_2009.gif) :
:![[thin space (1/6-em)]](https://www.rsc.org/images/entities/char_2009.gif) 2. Because EDS results are affected by test location, only semi-quantitative analysis can be carried out.
2. Because EDS results are affected by test location, only semi-quantitative analysis can be carried out.
The light absorption properties of Ag3PO4, α-Fe2O3 and Ag3PO4/α-Fe2O3 hybrids were analyzed by UV-Vis diffuse reflectance spectroscopy. Fig. 6(a) shows the UV-Vis diffuse reflectance absorption spectra of pure Ag3PO4, α-Fe2O3 and Ag3PO4/α-Fe2O3 complex (1![[thin space (1/6-em)]](https://www.rsc.org/images/entities/char_2009.gif) :
:![[thin space (1/6-em)]](https://www.rsc.org/images/entities/char_2009.gif) 2). It can be seen from Fig. 6(a) that the maximum light absorption band edges of pure Ag3PO4 and α-Fe2O3 are about 550 nm and 650 nm, respectively. Compared with pure Ag3PO4, the absorption wavelength of the Ag3PO4/α-Fe2O3 hybrid photocatalyst in the visible light region has a red shift, which enhances the visible light response range thus increasing the utilization rate of light. The red-shift phenomenon is attributed to the heterojunction structure formed between Ag3PO4 and α-Fe2O3 which may be induced by the structural defects, and the enhanced internal stress results in the overlap of the electron wave function generated in the process. From the (αhν)2 ∼ hν curve in Fig. 6(b), it can be concluded that the Eg values of Ag3PO4 and α-Fe2O3 are about 2.2 eV and 2.0 eV, respectively.27,28 The valence band EVB and conduction band position ECB can be obtained from the calculation formula of the semiconductor energy band structure:29
2). It can be seen from Fig. 6(a) that the maximum light absorption band edges of pure Ag3PO4 and α-Fe2O3 are about 550 nm and 650 nm, respectively. Compared with pure Ag3PO4, the absorption wavelength of the Ag3PO4/α-Fe2O3 hybrid photocatalyst in the visible light region has a red shift, which enhances the visible light response range thus increasing the utilization rate of light. The red-shift phenomenon is attributed to the heterojunction structure formed between Ag3PO4 and α-Fe2O3 which may be induced by the structural defects, and the enhanced internal stress results in the overlap of the electron wave function generated in the process. From the (αhν)2 ∼ hν curve in Fig. 6(b), it can be concluded that the Eg values of Ag3PO4 and α-Fe2O3 are about 2.2 eV and 2.0 eV, respectively.27,28 The valence band EVB and conduction band position ECB can be obtained from the calculation formula of the semiconductor energy band structure:29
| EVB = X − Ee + 0.5Eg | (1) |
| ECB = EVB − Eg | (2) |
 | ||
| Fig. 6 UV-Vis spectra (a) and the corresponding (αhν)2–hν curve of the Ag3PO4, α-Fe2O3 and Ag3PO4/α-Fe2O3 hybrid(b). | ||
The photocatalytic activity of Ag3PO4, α-Fe2O3 and Ag3PO4/α-Fe2O3 hybrid photocatalyst for rhodamine B degradation under visible light was investigated. It can be seen from Fig. 7(a) that rhodamine B hardly degrades itself. At the same time, the degradation efficiency of pure Ag3PO4 and α-Fe2O3 for rhodamine B was 82% and 8%, respectively, after 10 min of visible light catalysis. It can be clearly seen from Fig. 7(b) that, compared with pure α-Fe2O3, the photocatalytic degradation effect of rhodamine B by loading Ag3PO4 on α-Fe2O3 has been greatly improved. With the increase in the Ag3PO4 load, the catalytic activity of the Ag3PO4/α-Fe2O3 hybrid photocatalyst first increased and then decreased. When the molar ratio of Ag3PO4 to α-Fe2O3 was 1![[thin space (1/6-em)]](https://www.rsc.org/images/entities/char_2009.gif) :
:![[thin space (1/6-em)]](https://www.rsc.org/images/entities/char_2009.gif) 2, the catalytic degradation ability of rhodamine B solution was the best, and the catalytic degradation efficiency reached 95% after 10 min. Combined with the SEM images of Ag3PO4/α-Fe2O3 hybrids with different ratios shown in Fig. 4, it can be predicted that when the composite ratios of Ag3PO4 and α-Fe2O3 are 1
2, the catalytic degradation ability of rhodamine B solution was the best, and the catalytic degradation efficiency reached 95% after 10 min. Combined with the SEM images of Ag3PO4/α-Fe2O3 hybrids with different ratios shown in Fig. 4, it can be predicted that when the composite ratios of Ag3PO4 and α-Fe2O3 are 1![[thin space (1/6-em)]](https://www.rsc.org/images/entities/char_2009.gif) :
:![[thin space (1/6-em)]](https://www.rsc.org/images/entities/char_2009.gif) 4 and 1
4 and 1![[thin space (1/6-em)]](https://www.rsc.org/images/entities/char_2009.gif) :
:![[thin space (1/6-em)]](https://www.rsc.org/images/entities/char_2009.gif) 3, fewer Ag3PO4 particles are loaded on the sheet α-Fe2O3, which is unfavorable to the migration of photoelectric charge carriers between the two and hence unfavorable to the improvement of photocatalytic activity. When the composite ratio of Ag3PO4 and α-Fe2O3 is 1
3, fewer Ag3PO4 particles are loaded on the sheet α-Fe2O3, which is unfavorable to the migration of photoelectric charge carriers between the two and hence unfavorable to the improvement of photocatalytic activity. When the composite ratio of Ag3PO4 and α-Fe2O3 is 1![[thin space (1/6-em)]](https://www.rsc.org/images/entities/char_2009.gif) :
:![[thin space (1/6-em)]](https://www.rsc.org/images/entities/char_2009.gif) 2, the distribution of Ag3PO4 particles on the sheet α-Fe2O3 is more uniform, which improves the dispersion of Ag3PO4 particles and increases the photocatalytic specific surface area. The heterojunction structure formed between Ag3PO4 and α-Fe2O3 effectively promoted the separation of photogenerated electrons and holes and improved the electron migration efficiency, thus improving the photocatalytic activity of the material.30,31 However, too much Ag3PO4 will cause Ag3PO4 particles to agglomerate on the sheet α-Fe2O3, which will reduce the surface activity of Ag3PO4/α-Fe2O3, thus reducing the photocatalytic activity of the composite photocatalyst. At the same time, it can be seen that the catalytic activity of the Ag3PO4/α-Fe2O3 hybrid photocatalyst is higher than that of the physical mixture with the same proportion, which further indicates that the Ag3PO4/α-Fe2O3 hybrid photocatalyst prepared in this experiment formed a heterojunction structure and improved the photocatalytic activity, while the simple physical mixture cannot form a heterojunction structure.
2, the distribution of Ag3PO4 particles on the sheet α-Fe2O3 is more uniform, which improves the dispersion of Ag3PO4 particles and increases the photocatalytic specific surface area. The heterojunction structure formed between Ag3PO4 and α-Fe2O3 effectively promoted the separation of photogenerated electrons and holes and improved the electron migration efficiency, thus improving the photocatalytic activity of the material.30,31 However, too much Ag3PO4 will cause Ag3PO4 particles to agglomerate on the sheet α-Fe2O3, which will reduce the surface activity of Ag3PO4/α-Fe2O3, thus reducing the photocatalytic activity of the composite photocatalyst. At the same time, it can be seen that the catalytic activity of the Ag3PO4/α-Fe2O3 hybrid photocatalyst is higher than that of the physical mixture with the same proportion, which further indicates that the Ag3PO4/α-Fe2O3 hybrid photocatalyst prepared in this experiment formed a heterojunction structure and improved the photocatalytic activity, while the simple physical mixture cannot form a heterojunction structure.
 | ||
| Fig. 7 Kinetic curves of degradation of rhodamine B (a); photocatalytic degradation curves of RhB solution by different catalyst samples (b). | ||
The possible mechanism of the photocatalytic degradation of rhodamine B by the Ag3PO4/α-Fe2O3 hybrid photocatalyst is shown in Fig. 8. Under simulated solar irradiation, because the gap width of Ag3PO4 and α-Fe2O3 is narrow, and the absorbability is good in the range of visible wavelength, the electrons in the valence band are easily excited to transition to the conduction band, while the holes remain in the valence band. First, the ECB (0.60 eV) of Ag3PO4 is higher than that of α-Fe2O3 (0.37 eV), and the photogenerated electrons in the α-Fe2O3 conduction band can easily migrate to the Ag3PO4 conduction band. The EVB of Ag3PO4 (2.80 eV) is higher than that of α-Fe2O3 (2.37 eV), and the valence band holes of Ag3PO4 are transferred to the valence band of α-Fe2O3; thus, the photogenerated electron–hole pair is effectively separated. Second, Ag3PO4 will produce a small amount of Ag due to the photocorrosion phenomenon, which can further capture electrons from the conduction band of Ag3PO4 and α-Fe2O3, thus promoting the separation of photogenerated electrons and holes, and enhancing the photocatalytic activity.
Fig. 9 shows the effect of repeated usage times of the Ag3PO4/α-Fe2O3 hybrid catalyst on the degradation rate of rhodamine B. It can be seen from Fig. 9 that the photocatalytic degradation rate of rhodamine B decreased from 95% to 72% after repeated use of the Ag3PO4/α-Fe2O3 hybrid catalyst for four times. The photocatalytic degradation rate decreased slightly, but the photocatalyst still had certain stability and could be reused many times. According to the XRD comparison patterns of the Ag3PO4/α-Fe2O3 hybrid catalyst before and after use in Fig. 10, it can be clearly seen that the main reason for the decrease in the catalytic degradation rate is that a small amount of elemental silver (Ag) is produced by the photocorrosion of Ag3PO4 during the degradation process.32 Meanwhile, the loss of some amount catalyst in the processes of washing and recycling is also a reason for the reduction in the degradation rate.
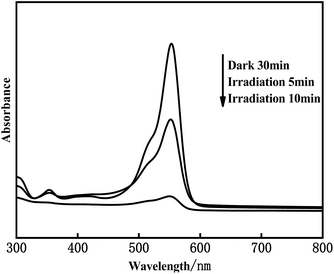
Fig. 11 shows the UV-Vis absorption spectra of the Ag3PO4/α-Fe2O3 photocatalytic degradation of rhodamine B. It can be seen from Fig. 11 that with the extension of the photocatalytic degradation time, the absorption peak intensity of rhodamine B solution gradually decreased, and rhodamine B was almost completely degraded after 10 min. In the whole process of photocatalytic degradation, the position and shape of the absorption peak of rhodamine B did not change, and no new absorption peak was generated, indicating that the concentration of rhodamine B only decreased in the degradation process, and no new substances were generated. Finally, it was concluded that rhodamine B might be catalyzed to degrade to H2O and CO2.
4. Conclusion
Based on a series of experiments and characterization, the following conclusions are drawn: when the molar ratio of Ag3PO4 to α-Fe2O3 is 1![[thin space (1/6-em)]](https://www.rsc.org/images/entities/char_2009.gif) :
:![[thin space (1/6-em)]](https://www.rsc.org/images/entities/char_2009.gif) 2, the catalytic degradation of the rhodamine B solution was the highest, and the catalytic degradation efficiency reached 95% in 10 min, which was significantly higher than that of pure Ag3PO4 and α-Fe2O3. This may be because the small Ag3PO4 particles are uniformly dispersed on the α-Fe2O3 sheet structure, which increases the catalytic specific surface area of Ag3PO4 particles. Moreover, Ag3PO4 particles and α-Fe2O3 sheets were closely combined to form a heterojunction structure, which improved the migration of photogenerated electrons and holes between the two. Thus, the photocatalytic activity of Ag3PO4/α-Fe2O3 hybrids was improved. The Ag3PO4/α-Fe2O3 hybrids had good visible light catalytic activity and stability, and could be reused many times.
2, the catalytic degradation of the rhodamine B solution was the highest, and the catalytic degradation efficiency reached 95% in 10 min, which was significantly higher than that of pure Ag3PO4 and α-Fe2O3. This may be because the small Ag3PO4 particles are uniformly dispersed on the α-Fe2O3 sheet structure, which increases the catalytic specific surface area of Ag3PO4 particles. Moreover, Ag3PO4 particles and α-Fe2O3 sheets were closely combined to form a heterojunction structure, which improved the migration of photogenerated electrons and holes between the two. Thus, the photocatalytic activity of Ag3PO4/α-Fe2O3 hybrids was improved. The Ag3PO4/α-Fe2O3 hybrids had good visible light catalytic activity and stability, and could be reused many times.
Author contributions
Y. Gao and C. M. Gui contributed to the conception and design of the work. H. D Ma, L. C. Han planned and designed the experiments, and made data acquisition. C. M. Gui, Y. Gao, H. D Ma, L. C. Han and H. C. Deng contributed to the analysis, data interpretation characterizing the samples. All authors have reviewed and approved to the final version of the manuscript.Conflicts of interest
The authors declare that they have no known competing financial interests or personal relationships that could have appeared to influence the work reported in this paper.Acknowledgements
This work was supported by Key Research and Development Program of Anhui Province (Grant No. 2019B11020040) and Natural Science Foundation of Anhui Province (Grant No. 1808085MB40) and National College Students Innovation Project (Grant No. 202111059024).References
- Q. Li, T. Shi, X. Li, K. G. Lu, M. Li, F. L. Liu, H. G. Li and M. Lei, Appl. Catal., B, 2018, 229, 8 CrossRef CAS.
- J. J. Huang, W. P. Wu, R. X. Zhang, G. Q. Lu, B. Chen, Z. M. Chen and C. M. Gui, Nano Energy, 2002, 92, 106734 CrossRef.
- R. C. Shen, C. J. Jiang, Q. J. Xiang, J. Xie and X. Li, Appl. Surf. Sci., 2019, 471, 43 CrossRef CAS.
- J. J. Huang, L. L. Xu, D. F. Zhao, J. Wang, C. R. Chu, H. D. Chen, Y. H. Liu and Z. M. Che, Chem. Eng. J., 2020, 383, 123199 CrossRef CAS.
- M. J. Nalbandian, M. Zhang, J. Sanchez, S. Kim, Y.-H. Choa, D. M. Cwiertny and N. V. Myung, J. Hazard. Mater., 2015, 299, 141 CrossRef CAS PubMed.
- L. Cui, S. L. Liu, F. K. Wang, J. Y. Li, Y. H. Song, Y. Sheng and H. F. Zou, J. Alloys Compd., 2020, 826, 154001 CrossRef CAS.
- J. Singh, S. A. Khan, J. Shah, R. K. Kotnala and S. Mohapatra, Appl. Surf. Sci., 2017, 422, 953 CrossRef CAS.
- R. K. Nainani and P. Thakur, Water Sci. Technol., 2016, 73, 1927 CrossRef CAS PubMed.
- Y. Lyu, F. Wei, T. Zhang, L. Luo, Y. Pan, X. Yang, H. Yu and S. Zhou, J. Alloys Compd., 2021, 876, 160016 CrossRef CAS.
- Y. J. Lee, J. K. Kang, S. J. Park, C. G. Lee, J. K. Moon and P. J. J. Alvarez, Chem. Eng. J., 2020, 402, 126183 CrossRef CAS.
- Y. Ma, J. Li, Y. Jin, K. Gao, H. Cai and G. Ou, Chemosphere, 2021, 285, 131440 CrossRef CAS PubMed.
- Z. Hu, J. Lyu and M. Ge, Mater. Sci. Semicond. Process., 2020, 105, 104731 CrossRef CAS.
- J. Wang, X. Yu, X. Fu, Y. Zhu and Y. Zhang, Mater. Sci. Semicond. Process., 2021, 121, 105329 CrossRef CAS.
- J. G. Du, Z. Xu, H. Li, H. J. Yang, S. J. Xu, J. Wang, Y. A. Jia, S. L. Ma and S. H. Zhan, Appl. Surf. Sci., 2021, 541, 148487 CrossRef CAS.
- Z. Y. Wu, J. P. Yu, W. F. Wang, C. H. X. H. Xin, X. Yu and Y. T. Tang, J. Alloy. Compd., 2021, 891, 161877 CrossRef.
- Z. Jiang, W. Wan, H. Li, S. Yuan, H. Zhao and P. K. Wong, Adv. Mater., 2018, 30, 1706108 CrossRef PubMed.
- Y. Geng, D. Chen, N. Li, Q. Xu, H. Li, J. He and J. Lu, Appl. Catal., B, 2021, 280, 119409 CrossRef CAS.
- W. Wang, W. Zhao, H. Zhang, X. Dou and H. Shi, Chin. J. Catal., 2021, 42(1), 97 CrossRef CAS.
- P. Wu, X. Zhao, C. Li, M. Yang, G. Li, S. Zhang, J. Ming, M. Liu, Z. Qian and P. Fang, New J. Chem., 2020, 44, 16370 RSC.
- W. Su, X. Liu, L. Tan, Z. Cui, Y. Liang, Z. Li, S. Zhu and S. Wu, ACS Sustain. Chem. Eng., 2020, 8, 2577 CrossRef CAS.
- M. Liu, X. Xue, S. Yu, X. Wang, X. Hu, H. Tian, H. Chen and W. Zheng, Sci. Rep., 2017, 7, 3637 CrossRef PubMed.
- J. Xu, X. Li, J. Niu, M. Chen, J. Yue and J. Alloy, Compd, 2020, 834, 155061 CrossRef CAS.
- P. F. Wang, P. H. Shi, Y. C. Hong, X. J. Zhou and W. F. Yao, Mater. Res. Bull., 2015, 62, 24 CrossRef CAS.
- L. Luo, Y. Li, J. Hou and Y. Yang, Appl. Surf. Sci., 2014, 319, 332 CrossRef CAS.
- P. Shao, Z. Ren, J. Tian, S. Gao, X. Luo, W. Shi, B. Yan, J. Li and F. Cui, Chem. Eng. J., 2017, 323, 64 CrossRef CAS.
- V. G. Deshmane, S. L. Owen, R. Y. Abrokwah and D. Kuila, J. Mol. Catal. A: Chem., 2015, 408, 202 CrossRef CAS.
- M. Q. Wen, T. Xiong, Z. G. Zang, W. Wei, X. T. Tang and F. Dong, Opt. Express, 2016, 24, 10205 CrossRef CAS PubMed.
- D. Y. Liang, C. Cui, H. H. Hu, Y. P. Wang, S. Xu, B. L. Ying, P. G. Li, B. Q. Lu and H. L. Shen, J. Alloys Compd., 2014, 582, 236 CrossRef CAS.
- M. Wang, P. Y. Guo and G. J. Yang, Mater. Lett., 2017, 192, 96 CrossRef CAS.
- P. Kang, L. Zhang, B. Cheng and J. Yu, Appl. Catal., B, 2017, 218, 570 CrossRef.
- A. Liu, C. Zhang, Y. Zhu, K. Li, J. Huang, Y. K. Du and P. Yang, J. Colloid Interface Sci., 2019, 535, 408 CrossRef CAS PubMed.
- M. Ge, N. Zhu and N. Y. P. Zhao, Ind. Eng. Chem. Res., 2012, 51, 5167 CrossRef CAS.
| This journal is © The Royal Society of Chemistry 2022 |

