 Open Access Article
Photoinduced and ground state conversions in a cyclic β-thioxoketone†
Mariusz Pietrzak *a,
Joanna Buczyńska
 a,
Fritz Duusb,
Jacek Waluk
 ac and
Poul Erik Hansen
 b
b
aInstitute of Physical Chemistry, Polish Academy of Sciences, Kasprzaka 44, 01-224 Warsaw, Poland. E-mail: mpietrzak@ichf.edu.pl
bDepartment of Science and Environment, Roskilde University, Denmark
cFaculty of Mathematics and Science, Cardinal Stefan Wyszyński University, Dewajtis 5, 01-815 Warsaw, Poland
First published on 23rd December 2021
Abstract
The photochemistry of a cyclic β-thioxoketone (2-methyl-1-(2-thioxycyclohexyl)propan-1-one (MTPO)) is investigated by NMR, UV, and IR experiments supported by DFT calculations. MTPO exists as a tautomeric mixture of an enol and a thiol form. Irradiation at low temperature led to a cis–trans isomerization of the thiol form resulting in a rather unusual enethiol (3). This is followed by a transfer of the isopropyl methine proton onto the carbonyl carbon resulting in yet another enethiol isomer (4). The photoconversion mechanisms without water present are discussed. Photochemical experiments at ambient temperature showed involvement of water in the excited state and resulted in another keto-form (5). The same species was also obtained when the products of the low temperature experiments were kept in the dark at ambient temperature.
Introduction
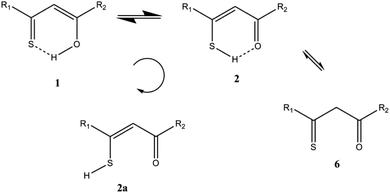
β-Thioxoketones exhibit interesting structural features that attract unremitting attention of numerous research groups. This class of compound can exist as different tautomers including thiol and thione and can form different intramolecular hydrogen bonds. β-Thioxoketones have good chelating properties that are widely used in the organic synthesis1–3 and in the development of new drugs.4 They exhibit photochromic properties and are good models for investigation of photochemical phenomena such as excited-state intramolecular proton transfer (ESIPT), both experimentally5 and theoretically.6,7 The photochemistry revealed in the present paper leads to new unusual compounds and may shed more light on the photoreactions in β-thioxoketones, not least on the influence of the environment on these particular photoprocesses.β-Thioxoketones show strong hydrogen bonding, tautomerism and upon irradiation in a matrix an unusual open form was observed8–10 (Scheme 1), whereas in the liquid state a cis–trans isomerization was found.11 The photoreaction mechanism is quite complex and has not yet been fully elucidated. Investigations of monothiodibenzoylmethane, carried out in various environments at different temperatures11 demonstrated a stepwise mechanism. It was possible to distinguish between the formation of the –SH exorotamer of the (Z)-enethiol tautomer, observed in rigid matrices at low temperatures, and the subsequent rotational isomerization, occurring in a liquid state. The photoconversion yield was found to depend on the irradiation wavelength. Therefore, it was postulated that a specific electronic state – the second excited singlet state of ππ* electronic origin – is responsible for efficient phototransformation. The proposed photochromic pathways involved both singlet and triplet routes.
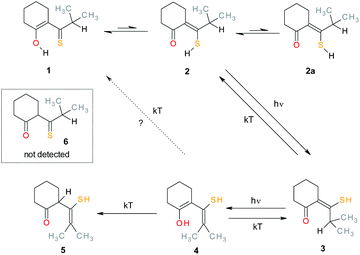
In the present paper a cyclic derivative is investigated in the liquid state (Scheme 2). Our initial goal was to pinpoint an unusual open form by combining photoirradiation with simultaneous NMR detection of transient species. The experiments revealed a complex photochemistry, involving both reversible and irreversible reactions and two different photoproducts, as well as a product formed in the dark. We report the structure of the products and discuss the photoconversion mechanisms.
Experimental and computational details
Compounds and solvents
MTPO was synthesized as described in ref. 16. CH2Cl2, CD2Cl2, or CHCl2F were used as solvents. Deuterated CD2Cl2 in 0.75 ml ampules was obtained from Cambridge Isotopes Laboratories Inc. (99.5% D) or from Deutero GmbH (99.6% D) and was used without further purification. Dichlorofluoromethane CHCl2F with purity of 99% was obtained from Merck-Schuchardt and transferred into an NMR Young tube via a vacuum line. CH2Cl2 for spectroscopy (Uvasol) was purchased from Merck.Irradiation
The irradiation was achieved using a UV-diode emitting at 365 nm.UV-vis and IR spectroscopy
The UV-vis spectra were recorded on a Shimadzu UV-3101PC spectrophotometer equipped with a home-built temperature-controlled sample chamber.The IR spectra were obtained with an NICOLET MAGNA-IR 860 FTIR spectrometer, using a cell with BaF2 windows and 100 μm path length. During these experiments, the same cell was used for alternative registration of IR and UV-vis spectra.
NMR spectroscopy
The recent developments in the field of NMR-UV methods are described in ref. 12. Here, the setup for combined NMR-UV laser experiments was used as described previously.11 Briefly, the base for it was a Bruker Avance II 300 MHz NMR spectrometer with a WB magnet, equipped with a 5 mm BBI probe head for liquids, and an UV diode emitting light at 365 nm. The light power reaching the sample was about 30–40 mW in the standard case when the quartz rod acting as a light pipe was immersed in the solvent and much less when the quartz rod was placed above the solvent meniscus (i.e., about 1 cm higher). Sample concentrations were in the range of 0.5–6 mM. Oxygen-free samples were prepared by bubbling the samples with dry nitrogen gas for at least 20 min inside NMR tubes, which were then mounted inside the NMR coil in an atmosphere of dry nitrogen. The temperature was checked with the use of a methanol thermometer.13 The NOESY (mixing time 0.7–1.5 s depending on T1 values), COSY, HSQC (J = 130 Hz) and HMBC (J = 4 Hz) experiments were performed with standard Bruker pulse programs (noesygpph, cosygpmfph, hsqcgpph, hmbcgpndqf). The reference for 1H NMR at all temperatures was the signal of CHDCl2 set to 5.32 ppm.Calculations
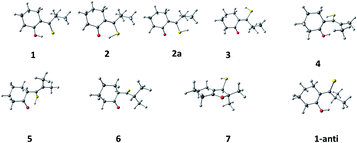
Initially, a conformational search was performed for 1–6, revealing several possible rotameric forms for each tautomer. This was done using density functional theory (DFT), with PBE functional and DZ basis set, as implemented in version 2019 of the Amsterdam Density Functional (ADF) package.14 Next, the geometry was optimized for one to three of the lowest energy rotameric forms of 1–6 (Scheme 3). This was initially done using ADF (B3LYP-D functional, DZP basis set). The obtained structures served as input for higher level calculations (B3LYP/6-311++G(d,p)), performed using Gaussian 16 software.15 Electronic transition energies and optimized S1 geometries were obtained using time-dependent DFT. Geometries of the triplet states were optimized using unrestricted wave functions.For each species in the ground electronic state, two sets of calculations were performed, first referring to isolated molecule, and the other simulating the presence of solvent, dichloromethane. The latter used the Polarizable Continuum Model implemented in Gaussian 16.15 Both sets gave very similar results. Because of that, excited state optimizations were done for molecules in vacuo.
The optimized structures served as input for calculations of both, IR and electronic absorption spectra.
Results
Monitoring photoconversion by electronic spectroscopy
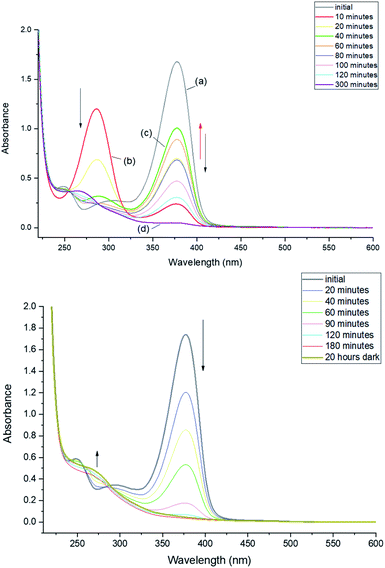
Irradiation of 2-methyl-1-(2-thioxocyclohexyl)propan-1-one (MTPO also called 1 in the spectra) in CH2Cl2 or CD2Cl2 using a 30 mW 365 nm LED at 203 K (Fig. 1) leads to a complete bleaching of the absorption at 378 nm. This is correlated with the rise of a band at 286 nm. The substrate (MTPO) is not recovered during irradiation, or when the sample is left in the dark for about 1 hour. However, warming of the sample leads to a partial recovery of MTPO.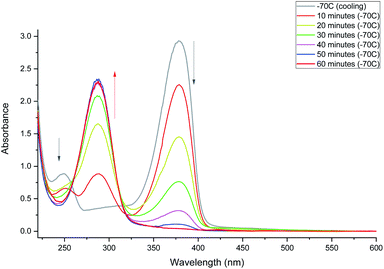 | ||
| Fig. 1 Monitoring phototransformation at 203 K. After 60 minutes of irradiation, complete disappearance of 1 was observed. | ||
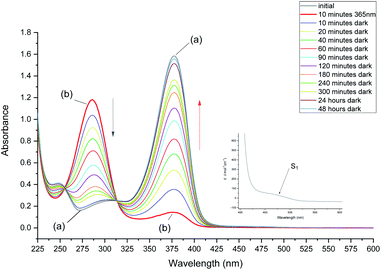
Irradiation at 293 K leads to a rapid decrease of the 376 nm band and increase of the 286 nm band. However, irradiation longer than 10 minutes does not lead to further depletion of the initial form. The absorbance at 376 nm starts to increase and, after reaching a certain value starts decreasing again (Fig. 2, top). This time, however, decrease of the 376 nm absorption is not accompanied by the increase at 286 nm. Instead, a band appears at 268 nm. Such behavior indicates a complex phototransformation scheme, involving more than just one photoproduct and a partial recovery of the substrate. As shown below, this is confirmed by NMR studies.
The above results show that at least two photoproducts, which we henceforth labelled 3 and 4, are formed upon irradiation. 3 and 4 are characterized by the absorption at 286 and 268 nm, respectively.
After 10 minutes of irradiation at 293 K, the absorbance of the main band at 376 nm fell to about 10% of its initial value. The photoproduct absorbs at 286 nm as mentioned above. The substrate can be recovered in the dark (Fig. 3). The recovery is bimodal: about 80% of the initial absorption is restored in about 1.5 hours, whereas full recovery takes more than 48 hours.
In order to enable reliable comparison with the NMR experiments, the absorption studies were carried out using the same concentration of MTPO, ca. 10−3 M and in some cases even the same solution. This was possible, using cells of 1 mm path length, due to not very strong electronic absorption of MTPO: molar absorption coefficient of 10![[thin space (1/6-em)]](https://www.rsc.org/images/entities/char_2009.gif) 040 at 376 nm was determined for the CH2Cl2 solution at room temperature.
040 at 376 nm was determined for the CH2Cl2 solution at room temperature.
Monitoring photoconversion by NMR
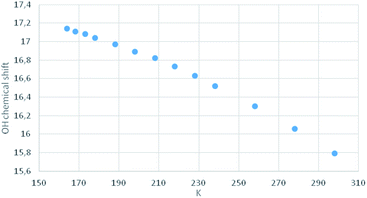
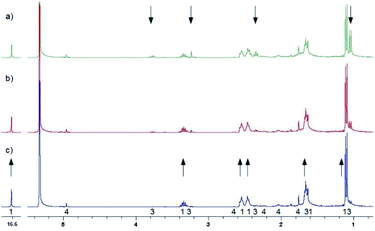
Compound MTPO is known to exist as a tautomeric mixture with the thioketo–enol form (1) (Scheme 1) dominating at ambient temperature.16 Upon cooling the thioketo–enol form (Fig. 4) becomes more dominant and at a temperature below 200 K, the “OH” resonance (chelated proton) broadens.It has been demonstrated that it is very important to keep the samples free of oxygen.8 Irradiation of a sample (30–40 mW at the sample) of MTPO (0.4–6.0 mg in 0.6 ml of CD2Cl2) at 198 K led at first to product 3 (Fig. 5 and Scheme 2). At longer times also product 4 was formed and eventually all of 3 was converted to 4, which was stable in the dark at this temperature. However, if the sample containing 4 was warmed to room temperature it was partly transformed into the end product (5) and partly converted back to the starting material MTPO (Fig. 5d). The end ratio of 5/MTPO was 45/55 but it can be a function of the temperature during the warming up procedure, substrate concentration, water content, etc.
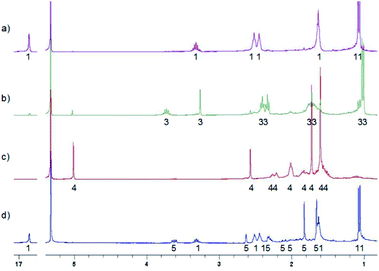 | ||
| Fig. 5 1H NMR spectra of irradiation of MTPO in CD2Cl2 at 198 K with quartz rod inside the magnet placed above the sample's meniscus – (a) starting material (6.0 mg in 0.6 ml CD2Cl2) at 198 K; (b) after UV irradiation for 6 hours at 198 K; (c) after UV irradiation for 18 hours at 198 K; (d) after standing in the dark at room temperature for 1 hour, measured at 198 K. The numbers show the line assignment corresponding to the structures of Scheme 2. | ||
In a similar experiment, the solvent was CHCl2F![[thin space (1/6-em)]](https://www.rsc.org/images/entities/char_2009.gif) :
:![[thin space (1/6-em)]](https://www.rsc.org/images/entities/char_2009.gif) CD2Cl2 10
CD2Cl2 10![[thin space (1/6-em)]](https://www.rsc.org/images/entities/char_2009.gif) :
:![[thin space (1/6-em)]](https://www.rsc.org/images/entities/char_2009.gif) 1 mixture and the temperature 150 K. After 10 min of irradiation 3 was formed. After 60 min of irradiation all was converted into 4. However, in this case the reaction mixture was stored in a freezer at 253 K overnight, resulting in the partial formation of 3 (Fig. 6c). Then it was stored in a fridge at 277 K for four days, which led to full conversion into MTPO (Fig. 6).
1 mixture and the temperature 150 K. After 10 min of irradiation 3 was formed. After 60 min of irradiation all was converted into 4. However, in this case the reaction mixture was stored in a freezer at 253 K overnight, resulting in the partial formation of 3 (Fig. 6c). Then it was stored in a fridge at 277 K for four days, which led to full conversion into MTPO (Fig. 6).
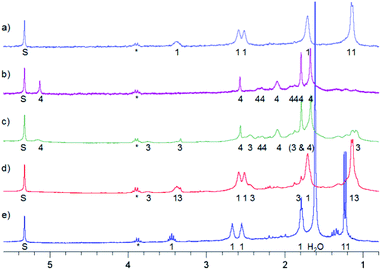 | ||
Fig. 6 1H NMR spectra of irradiation of MTPO (0.9 mg in 0.6 ml) in CHCl2F![[thin space (1/6-em)]](https://www.rsc.org/images/entities/char_2009.gif) : :![[thin space (1/6-em)]](https://www.rsc.org/images/entities/char_2009.gif) CD2Cl2 10 CD2Cl2 10![[thin space (1/6-em)]](https://www.rsc.org/images/entities/char_2009.gif) : :![[thin space (1/6-em)]](https://www.rsc.org/images/entities/char_2009.gif) 1 at 150 K. (a) Starting material at 150 K; (b) after irradiation for 1 hour at 150 K; (c) kept in a freezer (253 K) over night, measured at 150 K; (d) kept in a fridge (277 K) for eight hours, measured at 150 K; (e) kept in a fridge (277 K) for four days, measured at 273 K. The numbers show the line assignment corresponding to the structures of Scheme 2, S = solvent, * = impurity. 1 at 150 K. (a) Starting material at 150 K; (b) after irradiation for 1 hour at 150 K; (c) kept in a freezer (253 K) over night, measured at 150 K; (d) kept in a fridge (277 K) for eight hours, measured at 150 K; (e) kept in a fridge (277 K) for four days, measured at 273 K. The numbers show the line assignment corresponding to the structures of Scheme 2, S = solvent, * = impurity. | ||
Further experiments done at room temperature were performed in two different ways: (i) with the solvent as dry as possible, (ii) with the solvent containing relatively large amounts of water. In the first case 3 and 4 are formed. However, longer irradiation leads to the back conversion to MTPO and the formation of a small amount of 5 (Fig. 7). In the case of ii, MTPO is transformed to 5. A small amount of 4 is seen temporarily (Fig. 8). 5 was stable in the dark for days.
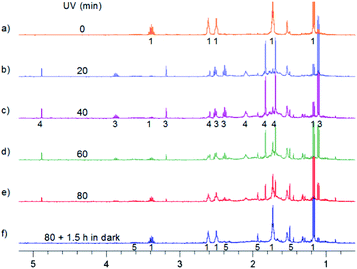 | ||
| Fig. 7 Aliphatic part of 1H NMR spectra of 0.7 mg MTPO in CD2Cl2 irradiated at ambient temperature outside the magnet. (a) Substrate; (b)–(e) after irradiation for certain periods: 20, 40, 60 and 80 min; (f) after 80 min irradiation and 1.5 hours in the dark. Sample without oxygen and with small amount of water (resonance at 1.55 ppm is not intense). The numbers show the line assignment corresponding to the structures of Scheme 2. | ||
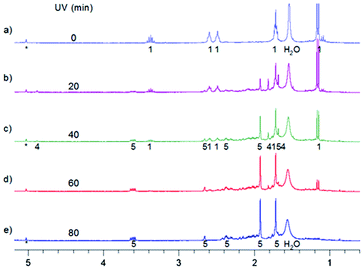 | ||
| Fig. 8 Aliphatic part of 1H NMR spectra of 0.4 mg MTPO in CD2Cl2 irradiated at 298 K with a quartz rod inside the magnet. (a) Substrate; (b)–(e) after irradiation for certain periods: 20, 40, 60 and 80 min. Oxygen is eliminated by bubbling with N2, but the amount of water is high (resonance at 1.55 ppm is intense). The numbers show the line assignment corresponding to the structures of Scheme 2, * = solvent's satellite. | ||
Dark reactions
Further experiments were also done to elucidate the reactions in the dark. Fig. 9 shows the back reaction of 3 in the dark at 228 K leading to the conversion into MTPO in a few hours. Under these conditions concentration of 4 was not changing. The back reaction of 3 in the dark at 298 K, illustrated in Fig. 10, results in the conversion into MTPO. In this experiment 4 was not observed and the possible influence of acid is eliminated by addition of basic Al2O3 to the sample. In both experiments no traces of 5 were detected.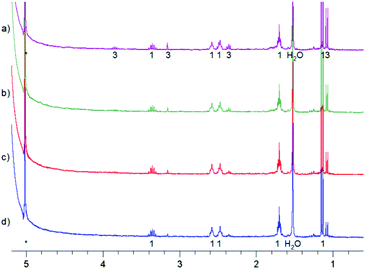 | ||
| Fig. 10 Aliphatic part of 1H NMR of <1 mg MTPO in CH2Cl2 deacidified with Al2O3. Sample irradiated for 2 min at ambient temperature outside the magnet. NMR spectrum recorded at 298 K without lock. The amount of water is high (resonance at 1.55 ppm is intense). The numbers show the line assignment corresponding to the structures of Scheme 2, * = solvent's satellite. (a) Just after irradiation; (b) after 20 min in the dark; (c) after 40 min in the dark; (d) after 60 min in the dark. | ||
Monitoring photoconversion by IR
The infrared spectrum of MTPO at ambient temperature is shown in Fig. 11 together with the calculated spectra. It clearly shows the presence of 1 and 2, but also that 2a is not present. The spectra after irradiation shows that 3 is growing and 1 is decreasing (Fig. 12). Very little happened prolonging the irradiation to 240 min.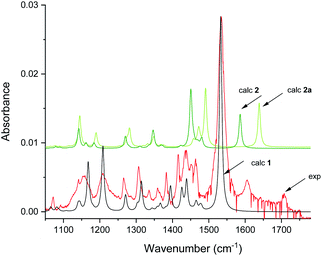 | ||
| Fig. 11 Experimental spectra of the substrate and calculated IR spectra of 1 and 2 in CD2Cl2 at 298 K. Scaling factor is 0.984. Intensity scale is arbitrary (see Fig. S8† for comparison of simulated IR spectra of 1–6). | ||
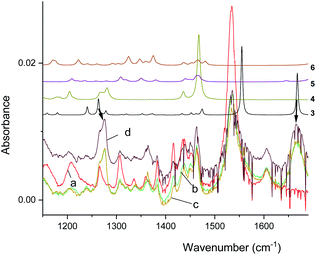 | ||
| Fig. 12 Experimental IR spectra of the substrate (a) and the spectra obtained after irradiation for 5, 10, and 15 minutes (b–d) in CD2Cl2 at 298 K. The arrows indicate resonances due to 3. Top, simulated spectra of 3–6 (arbitrary intensities, see Fig. S9† for comparison of relative intensities). | ||
Structures and assignments
As both the intermediates, 3 and 4 are relatively stable at 198 K without irradiation, 1D and 2D NMR experiments were employed to identify these species.![[double bond, length as m-dash]](https://www.rsc.org/images/entities/char_e001.gif) O group, leading to the chemical shift of 3.73 ppm for this proton. Please notice, some variations in chemical shifts between different spectra may occur due to differences in temperature, solvent and concentrations.
O group, leading to the chemical shift of 3.73 ppm for this proton. Please notice, some variations in chemical shifts between different spectra may occur due to differences in temperature, solvent and concentrations.Structures and NMR nuclear shieldings were initially calculated using the B3LYP functional and the Pople G(d) basis set. Nuclear shieldings were calculated using the GIAO method.17 The calculations showed that the structure for 4 has the OH group pointing towards the methyl groups. The nuclear shieldings were correlated to 1H chemical shifts as seen in the ESI Fig. S1.† The following correlation was established: δexp = 1.0646 × σcalc + 34.091, R2 = 0.9772.
Calculations of ground and excited state structures and barriers
In order to check the structural assignments and to elucidate photo- and dark conversion mechanisms, we carried out ground and excited states geometry optimizations of the initial keto (1) and enethiol (2) and (2a) forms, two postulated photoproduct structures (3 and 4), and the end product (5). Three other forms (6, 7, and 1-anti) were also taken into account. Although not experimentally detected, they were considered as possible intermediates in the conversion processes. The structures are shown in Scheme 3. For each species, they correspond to the lowest energy rotamer, as revealed by a conformational search performed for each form. The exception is 2, for which both chelated (2) and exo enethiol (2a) forms have been considered.Optimization was followed by calculations of vibrational frequencies, electronic transition energies, and NMR patterns. All these procedures were then repeated including the presence of a solvent (dichloromethane). The results are shown in the ESI in Table S1.† The same ground state energy ordering is obtained for vacuum and solvent environment: 1 < 2 < 3 < 5 < 6 < 7 < 4. Thus, the photoproduct 4 is predicted to be thermodynamically least stable among the five observed species, which explains its decay in the dark (see, however, discussion on the origin of the barriers and their modifications by solvent impurities).
The simulated NMR spectra nicely agree with the experimental ones, confirming the assignments.
Calculations indicate that the strongest absorption band should be preceded by a much weaker band, significantly shifted to the red. This is readily observed for MTPO (see inset to Fig. 3).
Discussion
An aim of the present study is to shed more light on the photoconversion of β-thioxoketones, but also to possibly avoid a cis–trans isomerization and furthermore to be able to observe the “open” form, 2a.By cooling down MTPO a line broadening of the “OH” resonance is observed below 200 K. However, as seen from Fig. 4, no abrupt change in the “OH” chemical shift is seen. This is contrary to what was observed for the corresponding methyl derivative18 or for the open chain β-thioxoketones.19 In the latter case the jump in the chemical shift related to coalescence was attributed to freezing out of the open form (Scheme 1). Very little open form is apparently present in the case of MTPO. During irradiation, the formation of 2a can be monitored either by the XH chemical shift or by IR. The chemical shift of the XH proton depends on the species in equilibrium. If 2a is formed and being in equilibrium with 2, the XH proton will be shifted to lower frequency until at a low temperature this species is “frozen” out and will be visible as separate resonances (for examples see thioacetylacetone and other derivatives).19 No such behavior is seen in the present case, so 2a must be absent or formed in trace amounts only.
In the following, the discussion is divided between experiments done at low temperature and at ambient temperature. In the ambient temperature experiments it is important to distinguish between experiments with little or no water present or those with large amounts of water present.
The diagram of ground and excited singlet and triplet energy levels is presented in Fig. 13. It allows to understand the experimental findings related to photoconversion with small amounts of water present. Irradiation into the S2 state of MTPO uses the wavelength, which is also absorbed by 2 and 3 (although in these cases, it involves the S1 state, much weaker in absorption). Calculations clearly indicate the state responsible for the photogeneration of 3: it is the triplet state of 2. In fact, optimizations of the lowest triplet state in 2, 2a, and 3 converge to the same structure, with the SH group located halfway between its ground state positions in these two forms. Thus, once the T1 state of 2 is populated, it can decay into the ground state of either 2 or 3.
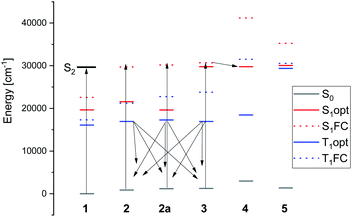 | ||
| Fig. 13 Calculated energies of the ground and lowest S1 and T1 electronic states. Dashed bars indicate the energies calculated for ground state geometry. | ||
The mechanism of 3 → 4 photoconversion seems to be different. It is now the lowest singlet excited state of 3 which adiabatically relaxes into S1 of 4. The ground state of 4 is thermodynamically least stable among 1–5. Therefore, conversion into the other forms is expected in the dark, exactly as observed.
Table 1 shows the calculated energy and free energy barriers for conversion between different forms in the ground electronic state. Of particular importance in the context of the conversion dynamics is the finding that the calculated barrier leading from the first photoproduct back to the substrate (3 → 2) is much higher than that for 3 → 4 “uphill” transformation. Once 4 is formed, the barriers for its conversion into the other forms are quite high, and therefore these processes are expected to be slow. This is experimentally confirmed. Regarding the conversion of 3 into the substrate, calculations predict that it should be slow. This is indeed the case for the solution in CH2Cl2 (deacidified with basic Al2O3) (see Fig. 10).
| In vacuo | In CH2Cl2 | |||
|---|---|---|---|---|
| ΔE‡a | ΔG‡b | ΔE‡ | ΔG‡ | |
| a Energy difference (kcal mol−1) at 0 K with respect to the starting form; ZPE-corrected values in parentheses.b Free energy difference at 298.15 K. | ||||
| 1 → 2 | 5.0 (1.8) | 1.9 | 4.9 (1.7) | 1.8 |
| 2 → 1 | 0.35 (−0.84) | −0.46 | 0.35 (−0.79) | −0.42 |
| 2 → 2a | 11.4 (10.5) | 10.1 | 9.2 (8.4) | 7.9 |
| 2a → 2 | 9.2 (7.9) | 7.8 | 8.8 (7.5) | 7.4 |
| 1-anti → 1 | 4.9 (4.4) | 5.0 | 5.2 (4.7) | 5.3 |
| 2 → 3 | 51.2 (48.9) | 48.8 | 46.7 (46.2) | 46.4 |
| 3 → 2 | 49.5 (47.2) | 47.8 | 43.4 (41.8) | 42.6 |
| 3 → 4 | 27.3 (24.2) | 25.6 | 28.3 (25.1) | 26.6 |
| 4 → 3 | 23.1 (20.3) | 21.6 | 22.9 (20.2) | 21.5 |
| 3 → 6 | 51.2 (48.8) | 49.2 | 51.5 (49.0) | 49.2 |
| 6 → 3 | 51.8 (47.5) | 47.6 | 52.8 (51.3) | 48.3 |
| 4 → 5 | 66.3 (62.3) | 62.5 | 65.6 (61.6) | 61.8 |
| 5 → 4 | 69.5 (65.4) | 65.8 | 70.3 (66.2) | 66.6 |
| 4 → 6 | 49.4 (45.8) | 45.4 | 44.4 (41.1) | 40.9 |
| 5 → 2 | 71.7 (67.7) | 68.3 | 71.2 (67.1) | 67.6 |
| 6 → 2 | 50.0 (45.6) | 45.1 | 49.7 (45.2) | 44.7 |
The calculations thus suggest that photoconversion can produce three different species: 2a, 3, and 4 (Fig. 13). The former two are generated from the same precursor, the lowest triplet state of 2, whereas 4 is formed from the lowest singlet excited state of 3. Because of relatively long lifetime, 3 and 4 can be seen by NMR, whereas 2a is difficult to detect due to low barrier for conversion into 2, but it is not seen in the IR experiment (Fig. 11).
One can also understand why the 3 → 4 photoconversion is much faster than the 1/2 → 3 phototransformation. The former occurs directly from the S1 state of 3; calculations predict this process to be barrierless. On the other hand, excited state conversion of 1 into 3 involves several steps: photoexcitation of 1 is followed by intersystem crossing to the triplet state. Next, the direct precursor of 3, the triplet state of 2 has to be populated via the OH → SH hydrogen transfer. The calculations suggest that this process may be slightly uphill. NMR spectra of irradiated samples show that the photoconversion occurs in the order: MTPO → 3 → 4.
An alternative channel to formation of 4 from 3 would be the methine proton abstraction from the triplet state of 3.20 However, the calculations suggest that the yield of triplet formation in 3 may be low, due to barrierless conversion of 3 to 4 in the S1 state.
4 is either going back to 1 or converting further to 5, depending on the temperature and solvent. The conversion to 1 is a thioenol to thioketone transformation and the reaction to the end product 5 is an enol to ketone transformation.
The influence of water can possibly be explained as seen in Scheme 4. Water can add to the double bond in the excited state in an anti-Markovnikov fashion21 of either 2 or 3 leading to 7. 7 can now dehydrate going back to 2, 3 or go on to 5. This is supported by the fact that 3 is not found when the irradiation of MTPO is conducted in the presence of large amount of water (Fig. 8).
Natural processes in the dark were observed at different temperatures, i.e.
• Below 198 K 3 and 4 are stable (freon, Fig. 6 and CD2Cl2, Fig. S2†).
• At 228 K 3 goes to MTPO, 4 is stable (CD2Cl2, the amount of water is unknown, Fig. 9).
• At 253 K a small amount of 4 is converted to 3 (freon, high water contents, Fig. 6c).
• At 277 K 4 goes to MTPO (freon, high water contents, Fig. 6d).
• At 298 K 4 goes to 5 and MTPO (CD2Cl2, the amount of water is unknown, Fig. 5d) and 3 goes mainly to MTPO (CD2Cl2, low water content, Fig. 7).
Based on these observations one can argue that the reaction pathway in the dark is the following:
5 ← 4 → 3 → MTPO or alternatively 5 ← 4 → MTPO ← 3. The reactions 4 → 5 and 4 → MTPO are competitive and depend on temperature and solvent because the 5/MTPO conversion rate varies substantially.
In summary, the overall picture of photoconversion of MTPO without water present involves rotamerization in the triplet state of 2 leading to either 2, 2a or 3, and a much faster 3 → 4 phototransformation, a barrierless downhill process occurring after S1 excitation of 3. It would be instructive to determine the time scales of these processes and to check for different possible routes leading to the doorway triplet state of 2 using ultrafast spectroscopy. In case of large amounts of water present a different route is taken as seen in Scheme 4. Even more challenging seems to be the elucidation of ground state kinetics. While the intramolecular conversion barriers seem to be high, the presence of water, traces of acid or other solvent impurities can drastically increase the reactivity.
Conclusions
Irradiation of MTPO (a cyclic β-thioketone) was studied by UV, IR and NMR. In the latter case both with irradiation outside the magnet and inside the magnet. The UV and NMR experiments were performed both at low temperature and at ambient temperature. Three new products were observed and identified, all of them enethiols. The structures were solved by 1D and 2D NMR experiment supported by DFT calculations. The photoconversion is clearly a way of creating new, unusual enethiols. One of them is stable at room temperature (5) and two others (3, 4) can be frozen at lower temperatures. The results of DFT calculations in the ground and excited states allow us to propose the pathway of photoreactions under study. The photoconversion process is discussed in dry solutions and in solutions containing more water. In both cases the initial step is conversion of MTPO into 3 via the S2 state of MTPO. This is followed by a proton transfer in the excited state into the triplet state of 2. This is then transferred into 3. 4 is formed from the lowest excited singlet state of 3. Reactions in the dark reveal that 4 can convert either to 5 or go back to MTPO, most probably through 3. In the water case, water is suggested as being part of the final conversion of 3 into 5. Such a complex picture can be even extended by further experiments conducted in the presence of oxygen.Conflicts of interest
There are no conflicts to declare.Acknowledgements
This work was partially supported by the European Union's Horizon 2020 research and innovation program under the Marie Skłodowska-Curie grant agreement No. 847413. Scientific work published as part of an international co-financed project founded from the program of the Ministry of Science and Higher Education entitled “PMW” in the years 2020–2024; agreement no. 5005/H2020-MSCA-COFUND/2019/2. JB and JW acknowledge the support from the Polish National Science Centre (NCN; grant no. 2017/26/M/ST4/00872), the PL-Grid infrastructure, and the Interdisciplinary Centre for Mathematical and Computational Modelling for a computing grant (grant no. G17-14).References
- K. S. Sharath Kumar, H. Ananda, S. Rangappa, S. C. Raghavan and K. S. Rangappa, Regioselective competitive synthesis of 3,5-bis(het) aryl pyrrole-2-carboxylates/carbonitriles vs. β-enaminones from β-thioxoketones, Tetrahedron Lett., 2021, 82, 153373 CrossRef CAS.
- T. Murai, The Construction and Application of C=S Bonds, Top. Curr. Chem., 2018, 376, 31 CrossRef PubMed.
- I. S. Semenova, V. N. Yarovenko, K. S. Levchenko and M. M. Krayushkina, Synthesis of 1,3-thioxoketones from salicylaldehyde, Russ. Chem. Bull., 2013, 62, 1022–1025 CrossRef CAS.
- P. C. Andrews, V. L. Blair, R. L. Ferrero, P. C. Junk, L. Kedzierski and R. M. Peiris, Bismuth(III) β-thioxoketonates as antibiotics against Helicobacter pylori and as anti-leishmanial agents, Dalton Trans., 2014, 43, 1279–1291 RSC.
- C. H. Wang, Z. Y. Liu, C. H. Huang, C. T. Chen, F. Yi. Meng, Y. C. Liao, Y. H. Liu, C. C. Chang, E. Y. Li and P. T. Chou, Chapter Open for the Excited-State Intramolecular Thiol Proton Transfer in the Room-Temperature Solution, J. Am. Chem. Soc., 2021, 143, 12715–12724 CrossRef CAS PubMed.
- K. Shayan and A. Nowroozi, DFT and TD-DFT study of the enol and thiol tautomers of 3-thioxopropanal in the ground and first singlet excited states, J. Theor. Comput. Chem., 2017, 16, 1750034 CrossRef.
- I. Tatić and N. Došlić, On the Robustness of Low-frequency Laser Control Schemes for Proton Transfer in Thioacetylacetone, Croat. Chem. Acta, 2004, 77, 83–88 Search PubMed.
- A. Posokhov, A. Gorsky, J. Spanget-Larsen, F. Duus, P. E. Hansen and J. Waluk, The structure of the phototransformation product in monothiodibenzoylmethane, Chem. Phys. Lett., 2001, 350, 502–508 CrossRef.
- A. Gorski, Y. Posokhov, B. K. V. Hansen, J. Spanget-Larsen, J. Jasny, F. Duus, P. E. Hansen and J. Waluk, Photochromism in p-methyl(thiobenzoyl)acetone and related β-thioxoketones, Chem. Phys., 2007, 338, 11–22 CrossRef CAS.
- A. Gorski, Y. Posokhov, B. K. V. Hansen, J. Spanget-Larsen, J. Jasny, F. Duus, P. E. Hansen and J. Waluk, Photochromism and polarizations spectroscopy of p- methyl(thiobenzoyl)acetone, Chem. Phys., 2006, 328, 205–215 CrossRef CAS.
- M. Pietrzak, J. Dobkowski, A. Gorski, S. Gawinkowski, M. Kijak, R. Luboradzki, P. E. Hansen and J. Waluk, Arresting consecutive steps of a photochromic reaction: Studies of β-thioxoketones combining laser photolysis with NMR detection, Phys. Chem. Chem. Phys., 2014, 16, 9128–9137 RSC.
- P. Nitschke, N. Lokesh and R. M. Gschwind, Combination of illumination and high resolution NMR spectroscopy: Key features and practical aspects, photochemical applications, and new concepts, Prog. Nucl. Magn. Reson. Spectrosc., 2019, 114–115, 86–134 CrossRef CAS PubMed.
- D. S. Raiford, C. L. Fisk and E. D. Becker, Calibration of methanol and ethylene glycol nuclear magnetic resonance thermometers, Anal. Chem., 1979, 51, 2050–2051 CrossRef CAS.
- G. te Velde, F. M. Bickelhaupt, E. J. Baerends, C. Fonseca Guerra, S. J. A. van Gisbergen, J. G. Snijders and T. Ziegler, Chemistry with ADF, J. Comput. Chem., 2001, 22, 931–967 CrossRef CAS.
- M. Frisch, G. Trucks, H. Schlegel, G. Scuseria, M. Robb, J. Cheeseman, G. Scalmani, V. Barone, G. Petersson and H. Nakatsuji, et al., Gaussian 16, Revision B.01, Gaussian, Inc., Wallingford CT, 2016 Search PubMed.
- F. Duus, β-Thioxo ketones. 2. Preparation and structure of some five- and six-membered 2-Acylcycloalkanethiones and 2-thioacylcycloalkanones, J. Org. Chem., 1977, 42, 3123–3127 CrossRef CAS.
- K. Wolinski, J. F. Hinton and P. Pulay, Efficient implementation of the gauge-independent atomic orbital method for NMR chemical shift calculations, J. Am. Chem. Soc., 1990, 112, 8251–8260 CrossRef CAS.
- U. Berg, J. Sandstrom, L. Carlsen and F. Duus, Beta-thioxoketones. Part 9. A dynamic 1H nuclear magnetic resonance spectroscopic study of thioacetylacetone and related β -thioxoketones. Direct observation of the enol and the enethiol tautomeric constituents and their interconversion, J. Chem. Soc., Perkin Trans. 2, 1983, 1321–1325 RSC.
- B. Andresen, F. Duus, S. Bolvig and P. E. Hansen, Variable temperature 1H and 13C NMR spectroscopic investigation of the enol-enethiol tautomerism of β-Thioxoketones. Isotope effects due to deuteron chelation, J. Mol. Struct., 2000, 552, 45–63 CrossRef CAS.
- Y. Ito, H. Nishimura, Y. Umehara, Y. Yamada, M. Tone and T. Matsuura, Intramolecular hydrogen abstraction from triplet states of 2,4,6-triisopropylbenzophenones: Importance of hindered rotation in excited states, J. Am. Chem. Soc., 1983, 105, 1590–1597 CrossRef CAS.
- Y. Chen, J. Zhang, Z. Tang and Y. Sun, Visible light catalyzed anti-Markovnikov hydration of styrene to 2-phenylethanol: From batch to continuous, J. Photochem. Photobiol., A, 2020, 392, 112340 CrossRef CAS.
Footnote |
| † Electronic supplementary information (ESI) available. See DOI: 10.1039/d1ra09020h |
| This journal is © The Royal Society of Chemistry 2022 |

