
 Open Access Article
 This Open Access Article is licensed under a Creative Commons Attribution-Non Commercial 3.0 Unported Licence
Stoichiometry–grain size-specific capacitance interrelationships in nickel oxide†
Alhad Parashtekarab,
Laure Bourgeoiscd and
Sankara Sarma V. Tatiparti *a
*a
aDepartment of Energy Science & Engineering, Indian Institute of Technology Bombay, Mumbai 400076, India. E-mail: sankara@iitb.ac.in
bIITB-Monash Research Academy, Mumbai, 400076, India
cDepartment of Materials Science and Engineering, Monash University, VIC 3800, Australia
dMonash Centre for Electron Microscopy, Monash University, VIC 3800, Australia
First published on 15th March 2022
Abstract
Nickel oxide exhibits almost the highest theoretical specific capacitance (Cs), which includes contributions from non-faradaic double layer charging and faradaic OH− adsorption. However, the realistic and tangible Cs is due to the faradaic process, which can be influenced by chemical (i.e. stoichiometry) and structural (i.e. grain size) changes. Hence, it is necessary to investigate the interrelationships among chemical and structural features and charge storage capacity. Here, a non-stoichiometric nickel oxide (NixO) containing Ni2+ and Ni3+ was synthesized by a sol–gel method at 620, 720 and 920 °C using Ni(NO3)2·6H2O and citric acid. The grain size as estimated from X-ray diffraction increases from 55 to 194 nm with increase in the synthesis temperature. The stoichiometry measured through Ni2+ (or Ni3+) fraction from X-ray photoelectron spectroscopy also increases from 70.3 to 99.2 atom% with synthesis temperature. The Cs due to faradaic OH− adsorption was estimated from cyclic voltammetry in 2 M KOH within −0.05 to +0.60 V vs. Hg/Hg2Cl2/KCl (sat. in water). This Cs increases from 7.5 to 92.4 F g−1 with a decrease in the grain size and stoichiometry (increase in Ni3+) due to possibly the increased conductivity and NiOOH formation through OH− adsorption. The deviation from stoichiometry at lower grain size mainly stems from nickel vacancy accommodation, according to the thermodynamic model proposed here. The interrelationships among stoichiometry, grain size and the specific capacitance of nickel oxide are investigated.
1. Introduction
Nickel oxide is extensively studied for its high theoretical capacitance (2495–2584 F g−1 (ref. 1 and 2)), ease of availability, and good thermal and electrochemical stability.3–5 Nickel oxide is a non-stoichiometric metal oxide (NixO).6–11 The origin of its non-stoichiometry stems from the possible presence of Ni3+ along with the stoichiometric Ni2+,12 or in other words, cation (Ni2+) deficiency.6,13–16 The difference in the number of Ni2+ and O2− ions leads to the presence of Ni3+.6,17 Alongside, the other predominant point defect in NixO is the nickel vacancy 13,14,16 Generally, Ni1+ is thermodynamically unstable rendering Ni2+ and Ni3+ as the only cations in NixO.15
The charge storage capacity of NixO can depend on chemical and structural features. Chemical features include mainly the relative fractions of Ni2+ and Ni3+.18 For example, an NixO with a higher fraction of Ni3+ was demonstrated to be more facile as anode for Li-ion batteries.18 The charge storage capacity of Li-ion batteries containing only Ni2+ (40 mA h g−1) is about seven times less than that of the Ni3+ containing counterparts (280 mA h g−1).18 In another study, Kim et al. observed that the concentration of Ni3+ decreased with annealing temperature.19 This eventually led to a decrease in the specific capacitance of NixO.19 Meanwhile, the studies conducted by the Sahoo et al. and Rougier et al. highlighted the role of Ni3+ in charge storage mechanism of NixO supercapacitor.20,21
Electrochemical charging and discharging in NixO was demonstrated to happen by chemisorption and desorption of OH− ions from the aqueous KOH electrolyte on the electrode surface.1,2,5,22 The adsorbed OH− ions leads to the formation of nickel oxyhydroxide (NiOOH), where the oxidation state of Ni is reported as around +3.9,12,23–25 Thus it can be implied that higher Ni3+ (or non-stoichiometry) can enhance the specific capacitance of NixO. Further, the electrical conductivity can increase the specific capacitance (Cs).26–30 The electrical conductivity of NixO was reported to be higher at its grain boundaries than in the grain interiors (bulk).31,32 In another study Cs of cobalt oxide increased from 165 to 486 F g−1 by decreasing the average grain size from 22 to 6 nm.33 Therefore, increasing the grain boundary fraction is envisaged to increase Cs of NixO. However, the reports on relating specific capacitance with grain size are scarce in literature.
The specific capacitance of NixO can be increased by decreasing stoichiometry (i.e. increasing Ni3+) and decreasing the grain size. Hence, there is a need to investigate the relation between stoichiometry and grain size. Ni3+ is created when atmospheric oxygen (O2) reacts with the nickel oxide, resulting in nickel vacancies  The presence of these vacancies is manifested as a relatively larger oxygen ion (O2−) fraction.34–36 Duffy and Tasker reported extensively on the formation energy of
  11,37 The formation energy for
  is lower in the grain boundary when compared with that in the grain interior.34–39 Therefore, grain boundaries become negatively charged upon the formation of
  Thus, the electrostatic potential set by negatively charged grain boundary compels the formation of Ni3+ in the bulk within the neighborhood of grain boundaries to maintain charge neutrality.11,37,40–42 This region is called space charge zone.43–45 The formation of this space charge zone reduces the free energy of the material as a consequence of achieving the thermodynamic equilibrium.43 A higher concentration of
  in grain boundaries requires a larger fraction of the latter. However, studies on the relation between
  (and so Ni3+) concentration and the grain boundary fraction or the grain size are also scarce in literature. Hence, it is essential to investigate on the interrelationships among chemical, structural features and charge storage capacity.
In the present work, we synthesized nickel oxide by using Ni(NO3)2·6H2O and citric acid through sol–gel method at 620, 720, and 920 °C. It is observed that the average grain size, estimated from powder X-ray diffraction, decreased by nearly four times from 194 to 55 nm when the synthesis temperature is changed from 920 to 620 °C. Also, the specific capacitance estimated from cyclic voltammograms in 2 M KOH increased from 7.5 to 92.4 F g−1 with this decrease in synthesis temperature. The estimated fraction of Ni3+, from X-ray photoelectron spectra, is higher at lower synthesis temperatures. The increase in the specific capacitance with the decrease in the grain size and that in stoichiometry (i.e. increase in Ni3+) is explained by a possible increase in the conductivity and NiOOH formation. For relating the stoichiometry with grain size, a thermodynamic model us proposed based on the space charge formation, considering various point defects present in NixO. According to this model, a deviation from stoichiometry is related to a lower grain size, corroborating with the experimental results, for accommodating nickel vacancies. In this work, the interrelationships among stoichiometry, grain size and the specific capacitance of nickel oxide are investigated. The results of the present study can be useful in designing materials with enhanced specific capacitance.
2. Experimental section
Nickel oxide was synthesized from Ni(NO3)2·6H2O (Merck; purity ≥ 98%) and citric acid (Sigma Aldrich; purity ≥ 99.5%). 0.1 M aqueous solutions of Ni(NO3)2·6H2O and citric acid were prepared and stirred separately for 30 min at room temperature. The obtained green colored solution of Ni(NO3)2·6H2O was added dropwise to the colorless solution of citric acid using burette at 40 °C. The solution was evaporated at 70 °C while stirring with a magnetic stirrer on a hot plate. On completion of evaporation, a light green powder was obtained. This powder was then heated in air by temperature ramping at 5 °C min−1 up to various temperatures viz. 620, 720 and 920 °C and annealed for 5 h at these temperatures, to produce NixO. These nickel oxide samples are referred to as NiO620, NiO720 and NiO920, respectively. For checking the grain size stability the annealing was prolonged up to 15 h.A commercial copper wire of 1 mm diameter was used as a current collector. Any surface contamination on this copper wire was removed by filing and eventual ultrasonication in soap solution followed by acetone for 15 min each. Electrode paste was prepared by mixing nickel oxide powder, polyvinylidene fluoride (PVDF; Alfa Aeser; purity ≥ 98%) and acetylene black (Alfa Aeser; purity ≥ 99.9%) in 80![[thin space (1/6-em)]](https://www.rsc.org/images/entities/char_2009.gif) :10:10 weight ratio. N-methyl pyrrolidine (Honeywell; purity ≥ 99.5%) was added to this mixture, as a solvent for PVDF, in the ratio of 400 μl per 50 mg of nickel oxide. This paste was applied on a 1 cm length of the copper wire to prepare the electrode. The rest of the copper wire was coated with PVDF and N-methyl pyrrolidine to avoid contact with electrolyte. The coated copper wire was dried in vacuum oven at 120 °C for 12 h.
:10:10 weight ratio. N-methyl pyrrolidine (Honeywell; purity ≥ 99.5%) was added to this mixture, as a solvent for PVDF, in the ratio of 400 μl per 50 mg of nickel oxide. This paste was applied on a 1 cm length of the copper wire to prepare the electrode. The rest of the copper wire was coated with PVDF and N-methyl pyrrolidine to avoid contact with electrolyte. The coated copper wire was dried in vacuum oven at 120 °C for 12 h.
Electrochemical performance of the nickel oxide was studied by performing cyclic voltammetry (CV) by employing an electrochemical workstation (CH 660, CH Instruments). The copper wire coated with nickel oxide, acetylene black and PVDF was used as the working electrode. An aqueous Hg/Hg2Cl2/KCl (sat. in water) and Pt grid were used as the reference and counter electrodes, respectively. 2 M KOH solution was employed as an electrolyte. Prior to CV, 40 cycles in the potential range from −0.05 to +0.60 V at a scan rate of 50 mV s−1 were performed to clean the electrode. The electrode cleaning was followed by CV in the same potential range at scan rates of 5, 10, 20, 35, 50, 80 and 100 mV s−1 for specific capacitance measurements. Here, anodic current is assumed to be positive.
Phase identification was done at room temperature using Cu Kα radiation in a Rigaku, Smartlab X-ray diffractometer (XRD). A scan range (2θ) of 20–80° and step size of 4° min−1 were used. The mean grain size was estimated using Williamson–Hall (WH) method (see S1†), where the total peak broadening is given as eqn (1).46–48
 | (1) |
3. Results and discussion
Fig. 1 shows the powder XRD patterns of all the samples annealed for 5 h at the synthesis temperatures. From Fig. 1, all the samples possess major peaks at 2θ values of 37.3°, 43.4°, 63°,75.4° and 79.6° corresponding to nickel oxide (Fig. 1a). The average grain size of nickel oxide increases with the synthesis temperature (Fig. 1b). The grain size of nickel oxide was also estimated (i) during temperature ramping from room temperature to various synthesis temperatures up to 920 °C and (ii) while isothermal annealing at these temperatures for various durations (5, 10 and 15 h). The XRD patterns during temperature ramping and while isothermal annealing up to 15 h and the corresponding grain sizes are shown in S1b (Fig. S3–S5†). According to the DSC studies nickel oxide starts to form at ∼315 °C and completes by ∼400 °C (not shown here), which is supported by the obtained XRD patterns (Fig. S3†). From Fig. S3 and S5† some grain growth in the samples was observed during temperature ramping during synthesis. Eventually, when all the samples were isothermally annealed at the respective synthesis temperatures of 620, 720 and 920 °C up to 15 h, the grain growth was almost negligible (Fig. S4 and S5†). Hence it can be said that the grain growth is stabilized in these samples at around 5 h of isothermal annealing. This justifies the selection of 5 h of annealing time for synthesizing nickel oxide for the present study. From Fig. 1b it can be, further, observed that the standard deviation in measuring the grain size increases with temperature. The grain growth while temperature-ramping and dwelling are partly responsible for such increase in the stand deviations (Fig. 1b). For the chosen synthesis temperatures the grain size exhibits an almost linear relationship with temperature (Fig. 1b).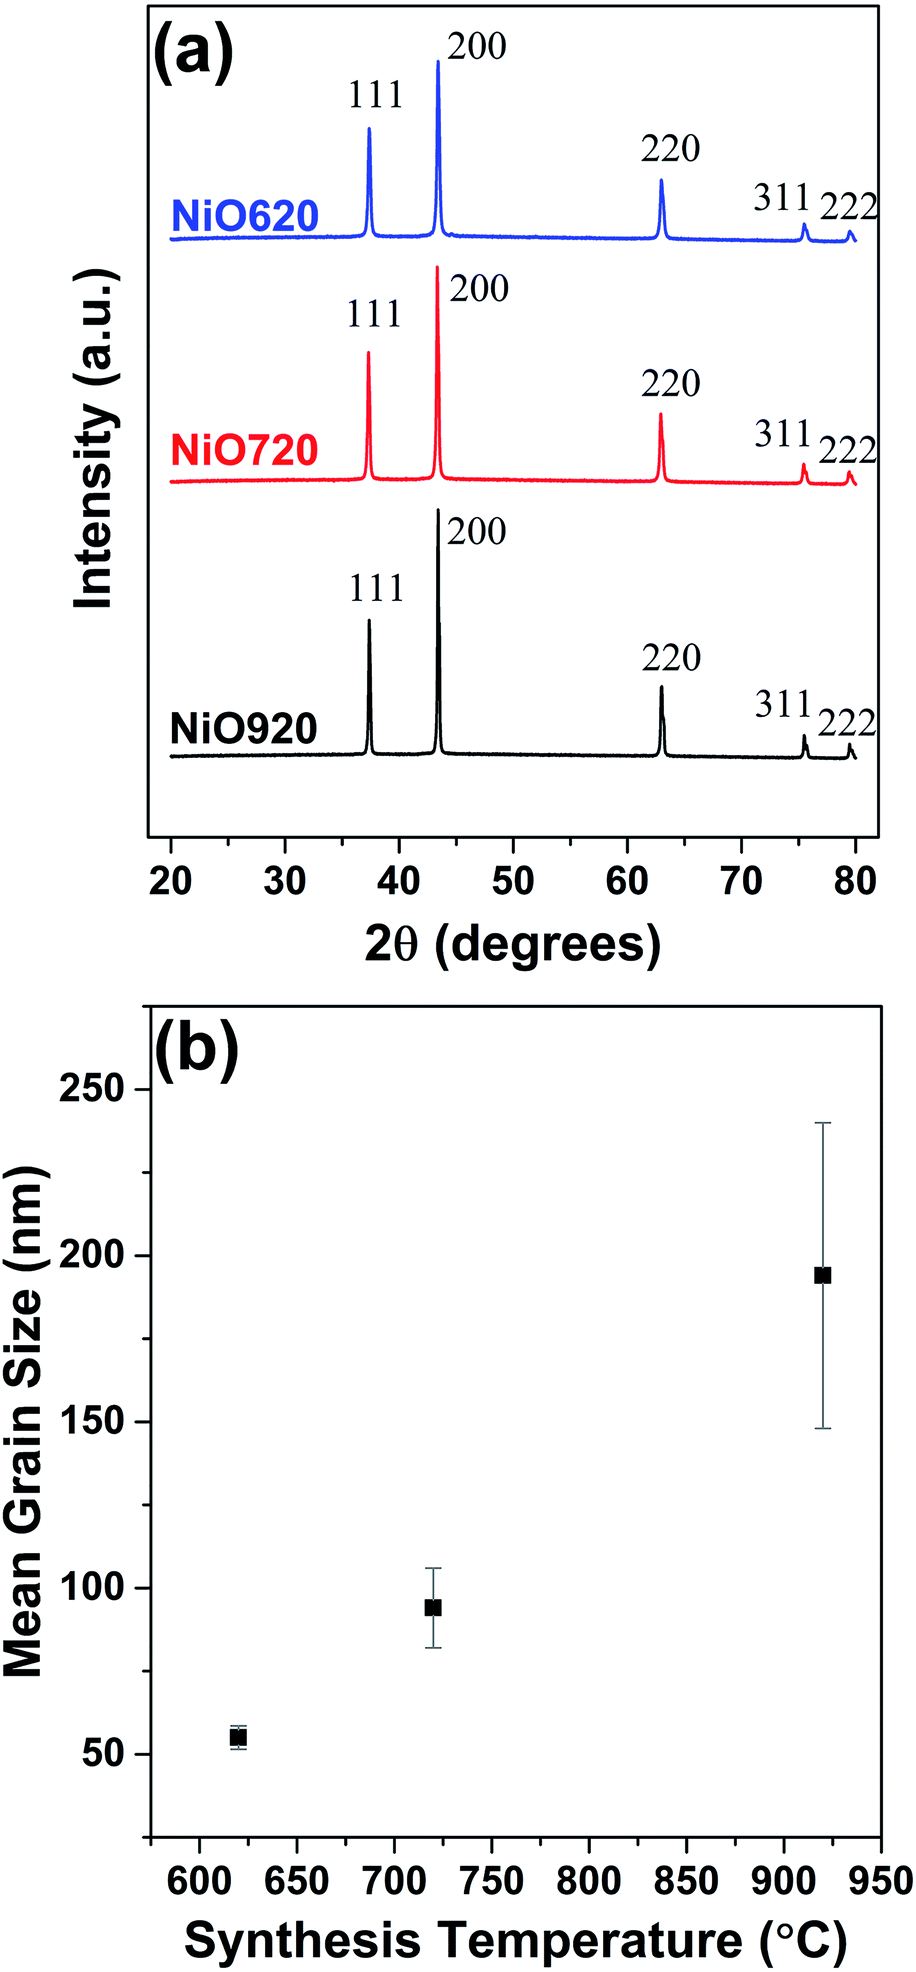 | ||
| Fig. 1 (a) Powder XRD patterns of nickel oxide powders. (b) Variation of estimated average grain size with synthesis temperature. | ||
Fig. 2a, c and e show the Ni 2p3/2; and Fig. 2b, d and f show the O 1s XPS spectra of all the freshly synthesized samples. The experimentally obtained Ni 2p3/2 spectra were deconvoluted by employing a method used by Armstrong et al.12 to check the presence of various oxidation states that Ni can exist in, viz. +2 and +3. While deconvoluting, the binding energies corresponding to these oxidations were fixed within an interval of ±0.1 eV. These binding energies and the chosen interval are in accordance with those obtained by Biesinger et al. and Armstrong et al.52,53 The deconvolution of Ni 2p3/2 spectra of all the samples resulted in peaks around 854.7–854.9 and 855.2–855.3 eV corresponding to Ni2+ and Ni3+, respectively (Fig. 2a, c and e).12 The satellite peaks at ∼862 eV in all the samples arise from (i) no transfer of electron from ligand to Ni 3d (c3d8L) and (ii) shielding by transfer of two electrons from ligand to Ni 3d (c3d10L−2).54,55 Here the superscript ‘−2’ represents the number of electrons transferred from ligand to metal. The deconvolution of O 1s spectra resulted into two peaks in the ranges of 529.1–529.3 and 530.9–531.1 eV (Fig. 2b, d and f). The former range (i.e. ‘Main Line’ in Fig. 2b, d and f) is associated with the oxygen present in NixO lattice. The latter range (530.9–531.1 eV) is a result of the defects present in place of O2− ions in NixO (denoted as ‘Defect Line’ in Fig. 2b, d, f). These defect lines in O 1s spectra can also be associated with the adsorbed OH− ions on NixO surface.53 To check the presence (or absence) of the adsorbed OH− ions, the XPS spectra of the freshly synthesized samples and the old samples (i.e. synthesized two days prior to conducting XPS studies) are compared in Fig. S6.† From Fig. S6† the intensity of the defect line is significantly less in freshly synthesized samples suggesting that OH− adsorption is insignificant in these samples. Further, no additional form of oxygen such as adsorbed H2O is found from XPS spectra.
 | ||
| Fig. 2 Deconvoluted Ni 2p3/2 spectra (a), (c), and (e); O 1s spectra (b), (d), and (f) of NiO620, NiO720 and NiO920, respectively. | ||
The presence of both Ni2+ and Ni3+ in Ni 2p3/2 spectra (Fig. 2a, c and e) clearly indicate that the synthesized nickel oxide is non-stoichiometric. The deviation from stoichiometry is quantified by estimating the ratio of the number of oxygen ions (NO2−) and the total number of nickel ions (NNi = NNi2+ + NNi3+; where NNi2+ and NNi2+: number of Ni2+ and Ni3+ ions, respectively) for each sample. This ratio is calculated from the quantitative analysis from the XPS spectra using eqn (2) (see S2†).
 | (2) |
 in all the samples are estimated from NO2−/NNi ratio, assuming that the NixO is charge neutral. This charge neutrality is represented in eqn (3).
| 2NNi2+ + 3NNi3+ = 2NO2− | (3) |
On dividing eqn (3) by the total number of nickel ions (NNi) followed by rearrangement eqn (3) can be transformed to eqn (4) (see S2†).
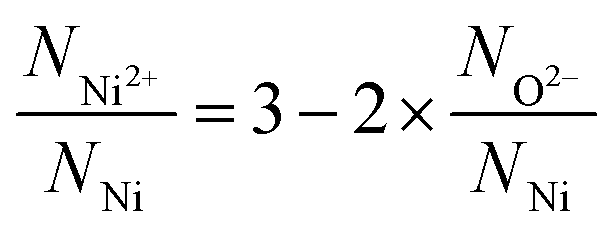 | (4) |
The estimated mole fractions of Ni2+ and thus Ni3+ are shown in Fig. 3a. The mole fraction of Ni2+ increases with synthesis temperature, indicating an increase in the stoichiometry in these samples with synthesis temperature.
 | ||
| Fig. 3 (a) Ni2+ and Ni3+ mole fractions as function of synthesis temperature. (b) Photographs of nickel oxide powder synthesized at 620, 720, and 920 °C. | ||
The observed color of the samples supports these estimated mole fractions. It is established in the literature that the black color indicates the non-stoichiometric nature of nickel oxide (i.e. presence of Ni3+), while the green color corresponds to the stoichiometric nickel oxide.10,56–58 The photographs of the synthesized samples are shown in Fig. 3b. The color of the NiO620 sample is nearly black (Fig. 3b) due to the very high relative mole fraction of Ni3+ in this sample (Fig. 3a). The NiO720 and NiO920 samples exhibit nearly green color (Fig. 3b) owing to the increased Ni2+ mole fraction (Fig. 3a). Thus, the various mole fractions of nickel species estimated from XPS corroborate with the color variations in samples, and is consistent with the reported literature using ferrometric titration.18
The CVs from all the samples at a representative scan rate of 35 mV s−1 are shown in Fig. 4a. The charging and discharging segments are clearly indicated in Fig. 4a. All the CVs exhibit both anodic and cathodic peaks indicating the presence of redox reactions. The anodic peak corresponds to the adsorption of hydroxyl ion and the cathodic peak corresponds to the desorption of the same, as this reaction occurs on the surface of the electrode.22,59–62 The redox reaction is shown in eqn (5).63–67
| NiO + OH− ⇌ NiOOH + e− | (5) |
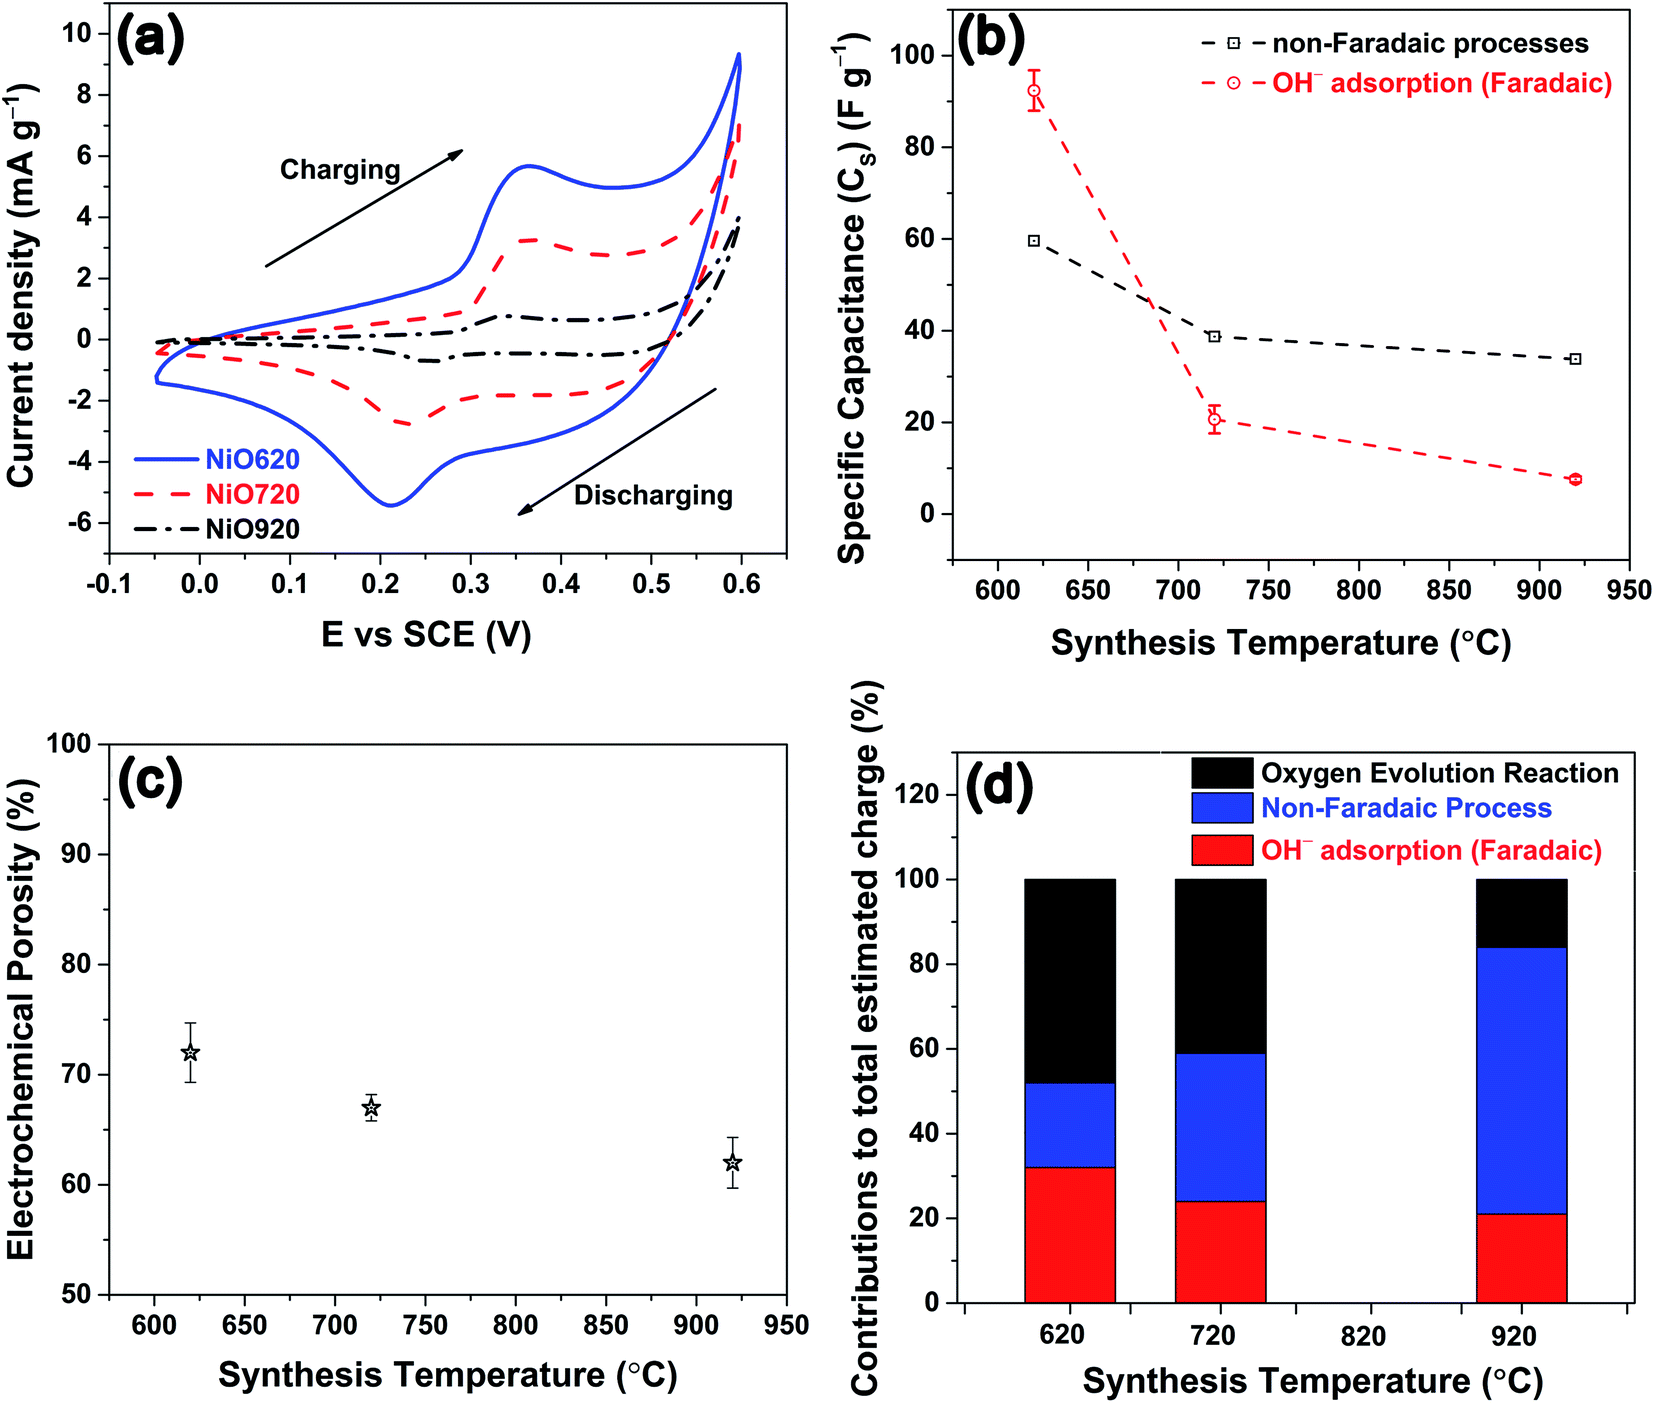 | ||
| Fig. 4 (a) Cyclic voltammograms (CVs) of nickel oxide samples recorded in 2 M KOH at 35 mV s−1. (b) Specific capacitances due to non-faradaic processes and OH− adsorption estimated from CVs as function of synthesis temperature. (c) Electrochemical porosity as function of synthesis temperature. (d) Contributions of non-faradaic processes, OH− adsorption and oxygen evolution reaction to the total estimated charge from CVs. | ||
Since the whole process either initiates from OH− (in adsorption) or yields the same (in desorption), eqn (5) is referred to as adsorption/desorption.22,59–62 A close observation of Fig. 4a shows that there is a gradual current-ramp in the regions where the redox peaks are absent. This suggests that apart from the above-mentioned redox reactions (faradaic process, eqn (5)), a large double layer charging/discharging (non-faradaic process) is also responsible for the current density.68 From Fig. 4a, the area under the curve decreases with an increase in the synthesis temperature. The area under the curve represents the (i) charge stored/delivered (once these CVs are converted to current density–time plots) through non-faradaic and faradaic processes; and (ii) charge involved in oxygen evolution reaction (OER), occurring at potentials anodic to around +0.50 V vs. SCE. On the anodic side, the CVs were performed up to +0.60 V SCE to ensure the completion of the OH− adsorption (faradaic, anodic peaks in Fig. 4a). This is necessary to estimate the charge storage through OH− adsorption. According to various reports in literature, the end point of OH− adsorption and the onset of OER overlap around +0.50 V SCE.69,70 This overlap is seen as the local minimum between these peaks in the CVs (Fig. 4a). For the present experimental conditions this local minimum occurs around +0.50 V SCE, consistent with literature. With the increase in the scan rate the peak current densities increase, and peak shifts towards higher potentials in anodic side (see, Fig. S7†). This behavior is likely a result of the diffusional nature of the given redox reaction.67,71 The charge storage nature is investigated for the nickel oxide samples synthesized at all the temperatures using widely accepted Dunn's equation, i.e. ip = aνb (where ip: peak current in CV; ν: scan rate; a, b: constants).72 Here, various values of b suggest different charge storage behaviors. For example, b = 1 suggests pure capacitive behavior; b ≈ 1 denotes pseudocapacitive nature; b = 0.5–1 is associated with diffusional process (with contributions from pure diffusion-controlled and capacitive processes); b = 0.5 indicates pure diffusion-controlled charge storage.72 The estimated b values for NiO620, NiO720 and NiO920 are 0.90, 0.87 and 0.73, respectively (analysis not shown here). These values suggest that the charge storage behaviour in these materials is predominantly diffusional (b = 0.5–1). With the increase in the scan rate the ion diffusion cannot keep pace with charge transfer, as a result of the shorter times that the electrode spends at every potential in those higher scan rates. The specific capacitance is estimated using eqn (6).
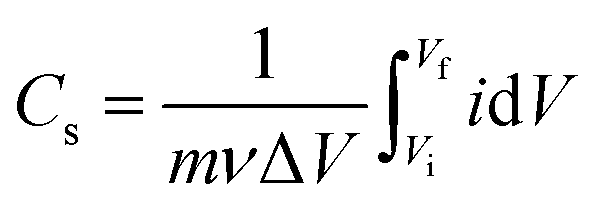 | (6) |
The specific capacitance solely due to the OH− adsorption i.e. faradaic processes is not emphasized in literature. However, the specific capacitance of pure nickel oxide without any special modification to morphology (nanosheets, nanotubes) calculated by using total area under CV are reported to be in range of 59–380 F g−1 in literature for various scan rates.61,64,73,74 Nickel oxide synthesized at 620 °C in the present work exhibits a specific capacitance of 106–1000 F g−1 within the employed scan rates of 100–5 mV s−1, respectively, when the full area under CV is considered. This shows the present nickel oxide is superior in the charge storage performance. The reverse trend between the specific capacitance and the scan rate is a result of such a trend between the available time for the electrode at any potential and the scan rate (as explained earlier).
To estimate the specific capacitance exclusively due to the OH− adsorption the charging segment of the CV is divided into two smaller segments as (i) up to +0.25 V and (ii) beyond +0.25 V. These segments involve only non-faradaic (absence of electrochemical reaction), and both faradaic (presence of electrochemical reaction) and non-faradaic processes, respectively. The segment comprising the faradaic contribution is further truncated at a potential (+0.50 V) where the contribution from OH− adsorption is minimal. Thus, the contribution from OH− adsorption is estimated by integrating the current densities corresponding to the charging segment of the CV from +0.25 to +0.50 V with respect to time after subtracting the non-faradaic contribution within these potentials. The schematic of the CV segment, with the contributions of non-faradaic, OH− adsorption and oxygen evolution reaction are delineated in S3 (Fig. S8†). A detailed description of the estimation of the specific capacitance due to OH− adsorption is given in ESI (see S3†).
The estimated specific capacitances due to OH− adsorption and non-faradaic processes are shown in Fig. 4b, corresponding to the scan rate of 35 mV s−1 (Fig. 4a), along with the experimental error bars. The uncertainty while estimating the specific capacitance was calculated as per the method given in S4.† The estimated specific capacitances due to OH− adsorption and non-faradaic processes decrease with an increase in the synthesis temperature (Fig. 4b). The reasons for this decrease in the specific capacitance can be two-fold: (i) a decrease in the electrochemical surface area, and/or (ii) a change in the structural and chemical features. Here, the geometrical surface area was kept constant for all the electrodes with 1 cm of the Cu wire being coated with the material. Hence, any changes in the surface area should arise due to the changes in porosity. To check the influence of surface area on specific capacitance, the porosity was estimated from electrochemically through CV employing a method proposed by Trasatti et al.75 The detailed description of the estimation of the electrochemical porosity is given in S5.† The estimated porosity values are shown in Fig. 4c. The porosity values could not be estimated experimentally due to the non-availability of the appropriate experimental facility. From Fig. 4c a ∼14% drop in the porosity is observed from NiO620 to NiO920. In contrast, the specific capacitances due to OH− adsorption and non-faradaic processes decrease by ∼92% and ∼43%, respectively (Fig. 4b), when the synthesis temperature increases from 620 to 920 °C. Such a small drop in the porosity cannot explain the large drop in the specific capacitances. This is further substantiated by considering the percentage contributions of non-faradaic, OH− adsorption and OER towards the total estimated charge during the charging segment of CV (Fig. 4a). These percentage contributions are shown in Fig. 4d. Similar percentage contributions at all the scan rates employed in the present study are shown in Fig. S9†. It can be seen from Fig. 4d and S9† that the percentage of OH− adsorption decreases and that of non-faradaic processes increases with an increase in the synthesis temperature. Had the electrochemical surface area, alone, been responsible for decreasing the specific capacitances, these percentage contributions of OH− adsorption and non-faradaic processes should have remained the same, which is not the case here (Fig. 4c and d). In other words, the not-so-significant change in electrochemical surface area (estimated through porosity) cannot cause such large changes in the specific capacitance arising from OH− adsorption and non-faradaic processes, both of which are surface phenomena. This clearly indicates that the structural and compositional features are possibly influencing the specific capacitance. Here the main structural and chemical features considered are grain size (Fig. 1b) and the relative fraction of Ni2+ and Ni3+ (Fig. 3a).
The experimentally estimated specific capacitance (Fig. 4b and d) is related to both grain size (Fig. 1b) and stoichiometry (Fig. 3a) in NixO. With an increase in the stoichiometry (i.e. Ni2+, Fig. 3a) the faradaic contribution to the current decreases (Fig. 4b and d). This is because nickel oxyhydroxide (NiOOH) is known to form on NiO during the charging segment of CV (Fig. 4a).64,74,76–78 The oxidation state of Ni in β-NiOOH is +3; whereas, γ-NiOOH consists of mixture of Ni2+ and Ni4+.23–25 The XPS analyses by Armstrong et al.12 and Oswald et al.9 show that Ni in γ-NiOOH is in +3 oxidation state.9,12 Similarly, NiOOH formed on nickel oxide surface after OH− adsorption is expected to have +3 oxidation state.79–82 These results suggest that Ni3+ is most likely participating in the NiOOH formation. The formation of NiOOH occurs through OH− adsorption (eqn (5)). Thus, the charge storage through faradaic contribution and specific capacitance (Fig. 4b and d) should increase with an increase in Ni3+ fraction (Fig. 3a). Further from Fig. 3a, Ni3+ and Ni2+ exhibit opposite trend within their mole fractions with synthesis temperature due to the charge neutrality constraint (eqn (3)). This opposite trend clearly indicates that specific capacitance decreases with an increase in Ni2+ fraction. Since Ni3+ and Ni2+ mole fractions exhibit opposite trend (eqn (3)), the specific capacitance is equally sensitive to the changes in both these mole fractions, but with an opposing trend. Further, the electrical conductivity of grain boundary and bulk in the synthesized nickel oxide samples were estimated as described in S6.† The estimated electrical conductivity is higher in grain boundary than in bulk in nickel oxide.31,32 The conductivities of the bulk are not affected by the synthesis temperature (Fig. S12b†). The grain boundary conductivity is higher than that of the bulk and decreases with synthesis temperature (Fig. S12b and c†) and Ni2+. In other words, grain boundary conductivity increases with an increase in Ni3+. An enhancement in the conductivity most likely increases the specific capacitance. Thus, the specific capacitance (Fig. 4b and d) is higher when the grain boundary fraction is higher or the grain size is lower (Fig. 1b). Thus, the charge storage-chemical (stoichiometry) and charge storage-structural (grain size) interrelationships are established.
The investigation on the interrelationship between chemical (stoichiometry)-structural (grain size) features is presented here. Firstly, a detailed analysis on the presence of various defects is presented. Eventually, a thermodynamic model is proposed to relate the stoichiometry and grain size. It is well known from literature that nickel oxide can be non-stoichiometric with the presence of nickel in both +2 and +3 oxidation states.45,83–87 The relative amounts of Ni2+, Ni3+ and O2− are constrained by the charge neutrality condition already shown in eqn (3). From eqn (3), it can be inferred that a less stoichiometric nickel oxide will have a greater number of oxygen ions (NO2−) than nickel ions (NNi = NNi2+ + NNi3+). The difference between the number of oxygen ions and that of nickel ions (NO2− − NNi) is half of the number of Ni3+. The Ni3+ with +1 net charge is also called as a ‘hole’ and is denoted as ‘h’, here.6,88 The closer the composition to the stoichiometry, the less would be the concentration of Ni3+ and vice versa. The holes in nickel oxide are formed by its reaction with oxygen (e.g. from atmosphere). The formation of holes is accompanied by the formation of nickel vacancy to maintain the charge neutrality, as shown in eqn (7).34,37,83,84,86
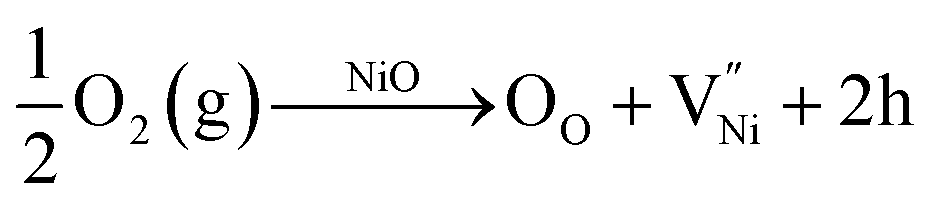 | (7) |
In NixO, the concentrations of these defects depend on synthesis temperature (Fig. 3a). Apart from temperature they also depend on stoichiometry to maintain the charge neutrality. In order to maintain the charge neutrality, oxygen vacancies 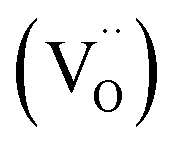 also can be present. Thus, the charge neutrality can be attained by a balance among
  and h as shown in eqn (8).
 | (8) |
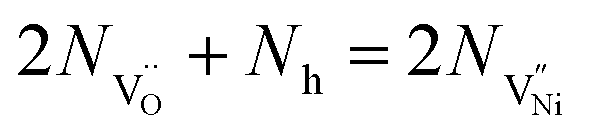
 Nh and
  are concentrations of the respective defects. However, the
  requires a higher energy for its formation i.e. 2.50 eV as opposed to 1.58 eV for
  85 thereby rendering its concentration much less when compared with the
  14,16,17,45,89 Hence, eqn (8) can be rewritten as eqn (9).
 | (9) |
The formation energies of various defects viz.  and h can be different in the grain interior (‘Bulk’) and at grain boundaries (‘GB’). The GB fraction exhibits opposite trend with grain size and is expected to decrease with the increase in the synthesis temperature (Fig. 1b). From literature the formation energy of
  is lower in GB region as opposed to in Bulk.11,41 Thus,
  form preferentially at GB. Therefore, the
  or the lack of Ni2+, is manifested as the presence of locally and relatively (with respect to Ni2+) higher number of negatively charged oxygen ions (NO2−) being present in GB. The relatively higher concentration of O2− makes the GB negatively charged. This negatively charged GB develops an electrostatic potential and compels Ni3+ (or holes) to segregate in Bulk towards the neighborhood of GB. This region extends into the Bulk and is popularly known as the space charge zone.11,43,44 Since, the various samples in the present study exhibit different extents of non-stoichiometry (Fig. 2 and 3a), the concentrations of the Ni3+ and
  are different in these samples. These different concentrations of the defects need to be accommodated within the Bulk and GB regions.43 Hence, the defect concentration (Fig. 2 and 3a) and the grain boundary area (fraction), or in other words, grain size (Fig. 1b) are related. Also, the concentration of Ni3+ and the grain boundary fraction are directly proportional to each other to accommodate
  in the grain boundaries. Or in other words, the stoichiometry (or the deviation from it in terms of Ni3+, Fig. 3a) and the grain size (Fig. 1b) are inversely proportional to each other.
In order to understand the accommodation of Ni3+ and  within Bulk and GB regions, a thermodynamic model is developed. This model can estimate the distribution of
  and h in Bulk and GB, which minimizes the Gibbs free energy of the system. According to this model an arrangement of
  in GB, and holes (Ni3+) in the space charge zone is necessary to attain equilibrium.43 One of the outcomes of this model is that a deviation from stoichiometry leads to a lower grain size, as is indeed the case here (Fig. 1b and 3a). The assumptions of the model are: (a) the defects do not interact with each other.45,89 (b) Formation energy of a given defect is the same everywhere in a given region.44,45,89 That is, the likelihood for the presence of the defects is the same everywhere within GB or Bulk, separately. (c) GB and Bulk regions are considered as two separate phases of nickel oxide.90 (d) The system is treated as thermodynamically open and the exchange of oxygen atoms is allowed between the system and surroundings (eqn (5)). A detailed development of the thermodynamic model is given in S7a.† As per this model, the concentrations of various defects denoted as nqp (where p:
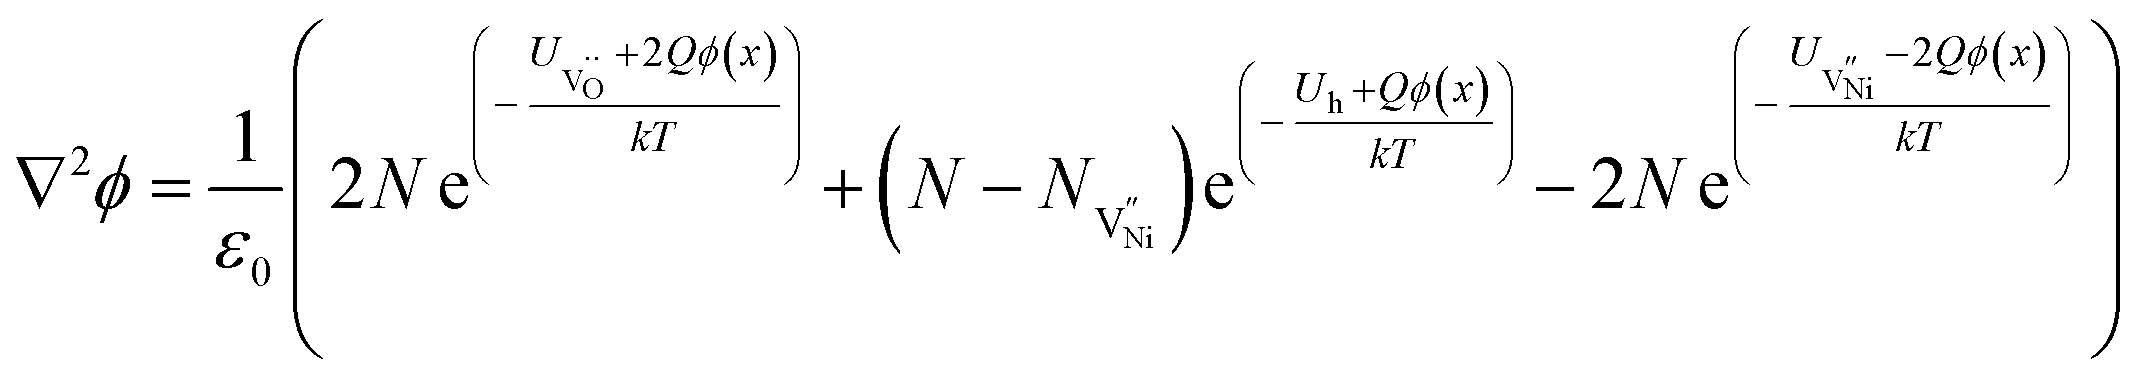
  and h; and q: GB or Bulk) as a function of spatial coordinate (x) in a given region of material is given by eqn (10).
 | (10) |
 | (11) |
Eqn (11) is solved separately for Bulk and GB. The 1D solution yields a general trend of spatial distribution of defect concentration. For computations, origin (i.e. x = 0) is considered to be at the interface separating GB and Bulk (GB/Bulk). The solution to eqn (11) requires defining two boundary conditions: (a) Assuming that the material is locally charge neutral at distances away from GB/Bulk,43–45 the electrostatic potential (ϕ(x)) at long distances from GB/Bulk (x = ∞), to maintain the charge neutrality is represented as ϕ∞. Therefore, ϕ(x) = ϕ∞ at x = ∞; and (b) The potential (ϕ(0)) at GB/Bulk is varied to maintain the global charge neutrality. Hence, ϕ(x) = ϕ(0) at x = 0. The detailed method of solving eqn (11) is described in S7b.† The formation energies of the defects in Bulk and GB are not available in literature. Therefore, formation energies are assumed and tabulated in S7c.†
Fig. 5a shows solutions to eqn (11) which are obtained by varying the boundary condition (b). The boundary condition ϕ∞ is fixed by the charge neutrality constraint at distances away from GB/Bulk. Therefore, the concentration of the defects in the thermodynamic model was varied by the changing the ϕ(0). The magnitude of ϕ(0) was always maintained greater than that of ϕ∞ to ensure that the electrostatic potential approached ϕ∞ with distance away from GB/Bulk. The potential at GB/Bulk (ϕ(0)) is used for both Bulk and GB. ϕ(0) is varied from +0.35 to +0.50 V and from −0.70 to −1.00 V in GB and Bulk, respectively. The resulting electrostatic potential as function of distance from GB/Bulk is schematically represented in both GB and Bulk regions. The calculated number of holes (nh) and nickel vacancies  normalized with respect to the total number of available lattice sites (Nh and
  ) is shown in Fig. 5b (as black squares) as a function of distance from GB/Bulk. Fig. 5b also shows the fraction of total number of defects (as blue circles) between the GB/Bulk interface and the given distance. From Fig. 5b, the following inferences can be drawn: (a) At equilibrium, the majority of the nickel vacancies are present in GB while Ni3+ ions are present in space charge zone; (b) the majority of the point defects are present within a distance less than that of lattice parameter (0.417 nm) from GB/Bulk interface. The distribution of the concentration of oxygen vacancies is not shown here as the concentration is negligible.
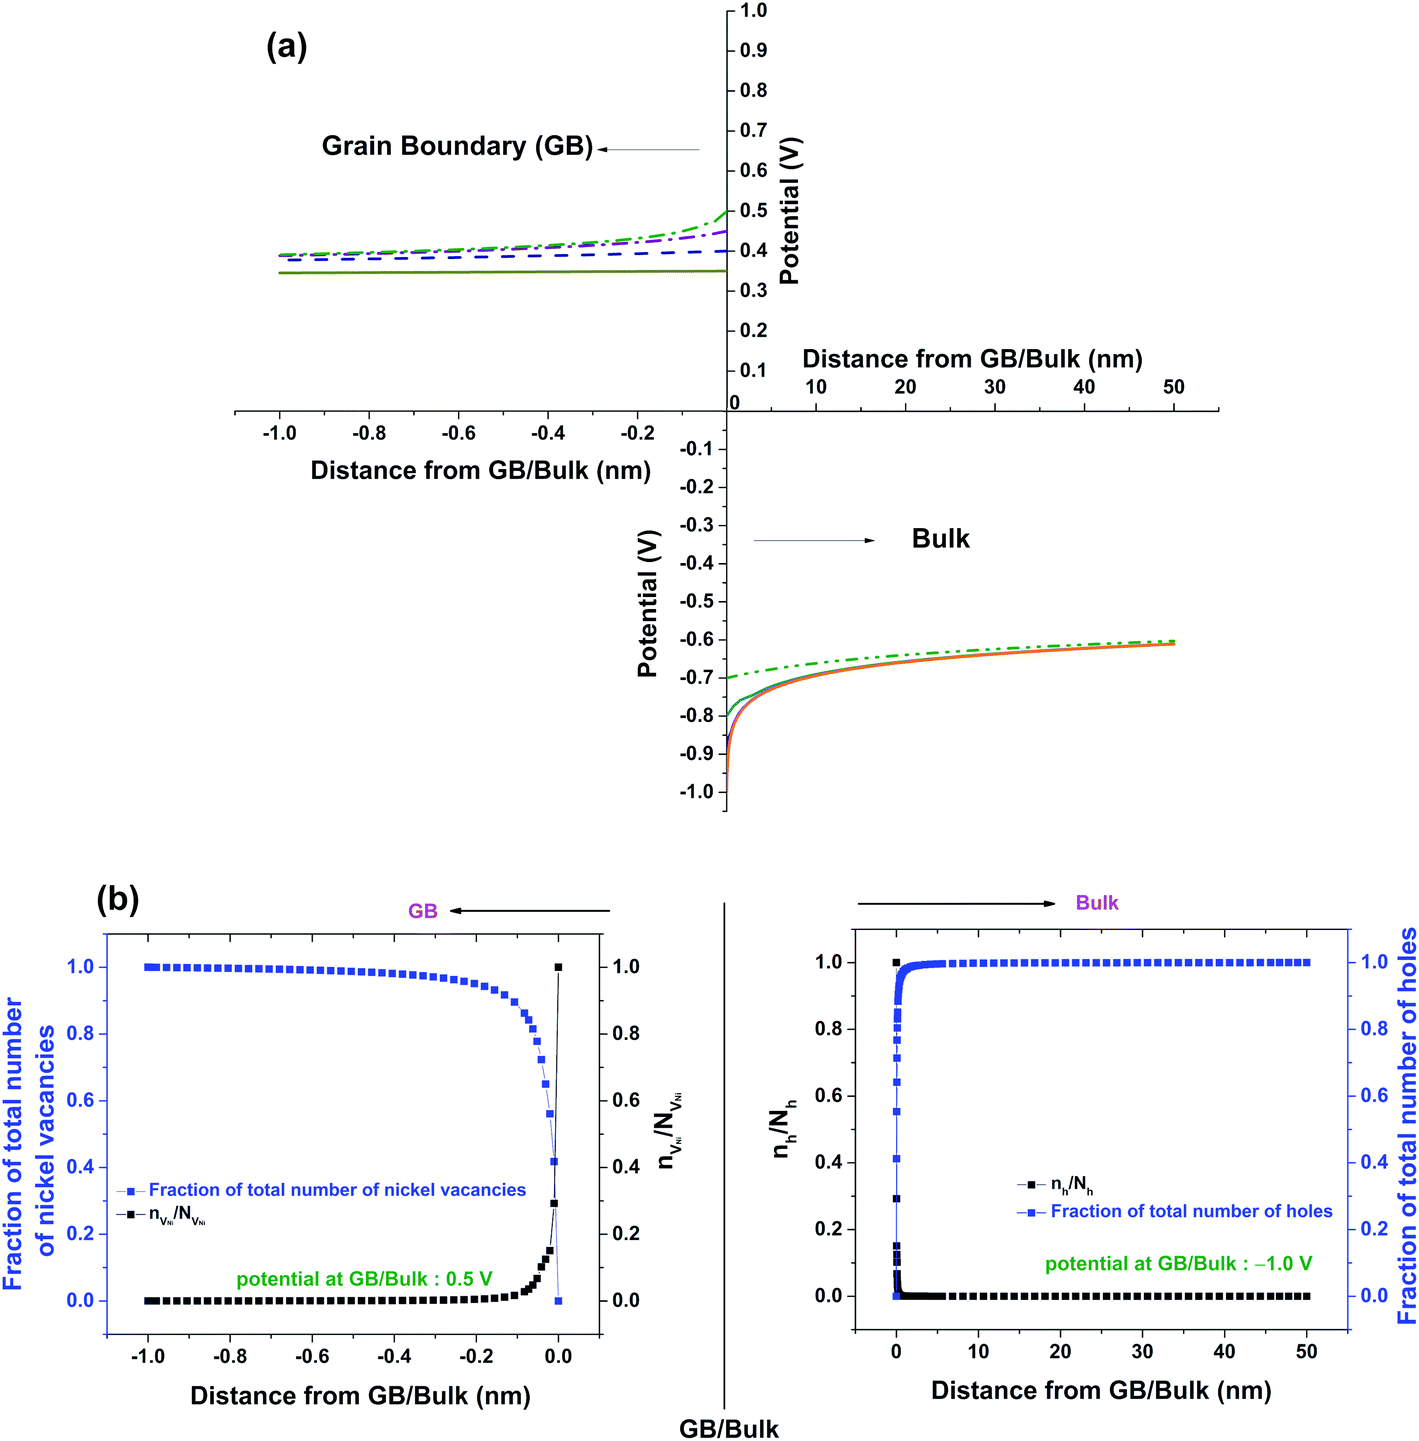 | ||
| Fig. 5 (a) Solutions of eqn (11) for different potential values at GB/Bulk interface (ϕ(0)) (b) Fractions of nickel vacancies and holes; and nVNi/NVNi and nh/Nh as functions of distance from GB/Bulk interface. | ||
The number of the Ni3+ ions are calculated for different grain sizes (Bulk) using eqn (10). While calculating the number of Ni3+ ions, the formation energy is kept constant (assumption (b)). To maintain the charge neutrality, the number of nickel vacancies would increase proportionally with the number of holes. The electrostatic potential (ϕ) required to attain maximum volumetric density is more for holes than nickel vacancies (eqn (10)). Any potential beyond that would not have any practical meaning. Therefore, the potential at the GB/Bulk interface (ϕmax) is chosen such that the maximum number of nickel vacancies are present in GB. This would also result in the maximum number of holes being accommodated in the chosen grain size. The ϕmax is calculated from eqn (10) to be +0.5 V. Using this value of ϕmax, the total charge in GB is calculated for a fixed GB size. According to the charge neutrality condition shown in eqn (12) (QT: total charge in GB or Bulk), the total charge in Bulk is negative of that in GB. This total charge in Bulk is used to calculate the appropriate magnitude of the electrostatic potential in Bulk (ϕBulk).
| QT(GB) + QT(Bulk) = 0 | (12) |
After obtaining ϕmax and ϕBulk, the total number of holes are calculated using eqn (12). The ratio of nickel and oxygen ions is then calculated based on eqn (3). This procedure is repeated for all the grain sizes as observed in Fig. 1b. The percentage mole fraction of Ni2+ as calculated from the model and as estimated from XPS (Fig. 3a) are shown in Fig. 6. In Fig. 6, the Ni2+ mole fraction is related to grain size, since in this work the stoichiometry (i.e. the presence of Ni2+) is being related to the structure (grain size) of nickel oxide. From Fig. 6 the calculated and the estimated values show the same trend and agree well quantitatively. However, the Ni2+ mole fractions calculated from the model are slightly higher than those estimated from experiments. The lower values of Ni2+ mole fractions estimated from experiments (XPS) are most likely due to any possible surface reconstruction of nickel oxide.52,53 Further, such a discrepancy between these values can also be attributed to the assumptions used in the model and any experimental errors. The results obtained from XRD (Fig. 1b) and XPS (Fig. 3a) and those observed from the model (Fig. 6) confirm the relation between grain size and stoichiometry.
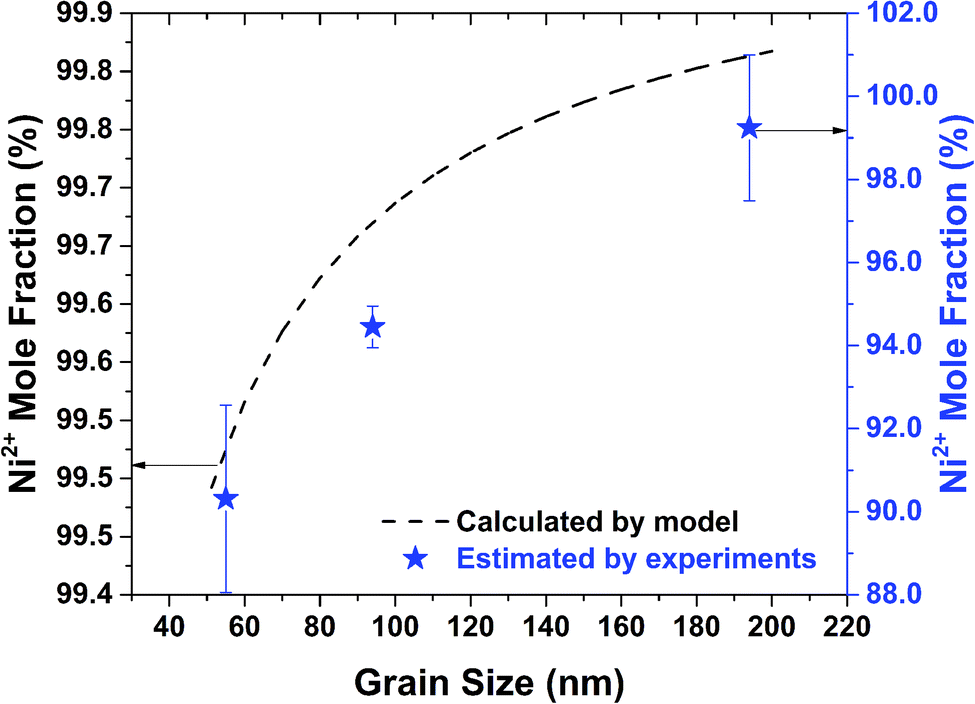 | ||
| Fig. 6 Mole fractions of Ni2+ ions estimated from experiments and calculated from thermodynamic model as function of grain size. | ||
The present study investigates the interrelationships between grain size, stoichiometry and specific capacitance in a non-stoichiometric nickel oxide (NixO). The specific capacitance increases with (i) a decrease in stoichiometry (or increase in Ni3+ fraction) due to a possible formation of NiOOH and (ii) lower grain size offering a possibly higher conductivity through the increased grain boundary fraction. The relationship between stoichiometry and grain size is described through a proposed thermodynamic model. According to this model, an increase in the Ni3+ fraction leads to that in  which requires a larger fraction of grain boundaries for its accommodation. Thus, the decrease in the stoichiometry is related to a decrease in the grain size. The results of the present study can be useful in designing materials with enhanced specific capacitance.
4. Conclusions
The specific capacitance Cs can be influenced by chemical and structural changes in the material. In this work, the interrelationships among chemical (stoichiometry), structural (grain size) features and charge storage capacity (Cs) are investigated in nickel oxide. Non-stoichiometric nickel oxide (NixO) containing Ni2+ and Ni3+ was synthesized by sol–gel method at 620, 720 and 920 °C using Ni(NO3)2·6H2O and citric acid. The grain size, as estimated from powder X-ray diffraction (XRD), increases from 55 to 194 nm with synthesis temperature. The stoichiometry (i.e. Ni2+ mole fraction) was estimated from X-ray photoelectron spectroscopy (XPS). The Ni2+ (or Ni3+) mole fraction increases (or decreases) with the synthesis temperature. The specific capacitances (Cs) of the NixO synthesized at all the temperatures were estimated from cyclic voltammetry in 2 M KOH within a potential range of −0.05 to +0.60 V vs. Hg/Hg2Cl2/KCl (sat. in water). The Cs due to faradaic OH− adsorption increases from 7.5 (in NixO synthesized at 920 °C) to 92.4 (in NixO synthesized at 620 °C) F g−1 with (i) a decrease in grain size, and (ii) a lower Ni2+ (or higher Ni3+) due to the possible formation of NiOOH. To investigate the interrelationships between the grain size and the stoichiometry a thermodynamic model is developed. According to this model, the higher Ni3+ mole fraction requires a higher grain boundary fraction (lower grain size) corroborating with the experimental results. This increased grain boundary fraction accommodates the increased concentration of nickel vacancies which arise due to the presence of Ni3+ while maintaining the overall charge neutrality of the material. Thus, the interrelationships among stoichiometry, grain size and specific capacitance are investigated in nickel oxide.Author contributions
Alhad Parashtekar: conceptualization, investigation, formal analysis, writing – original draft, visualization. Sankara Sarma V Tatiparti: supervision, project administration, formal analysis, writing – original draft, funding acquisition. Laure Bourgeois: supervision, project administration, funding acquisition, writing – original draft.Conflicts of interest
There are no conflicts to declare.Acknowledgements
Financial support from IITB-Monash Research Academy (Project: IMURA399), India is appreciated. XRD by Department of Metallurgical Engineering and Materials Science and Department of Energy Science and Engineering, XPS by Central Surface Analytical Facility (ESCA Lab) IIT Bombay are acknowledged.References
- L. Li, J. Zhang, J. Lei, J. Xu, B. Shang, L. Liu, N. Li and F. Pan, J. Mater. Chem. A, 2018, 6, 7099–7106 RSC.
- K. W. Nam, E. S. Lee, J. H. Kim, Y. H. Lee and K. B. Kim, J. Electrochem. Soc., 2005, A2123–A2129 CrossRef.
- J. Yan, Q. Wang, T. Wei and Z. Fan, Adv. Energy Mater., 2014, 4(1–43), 1300816 CrossRef.
- Y. Zhang, H. Feng, X. Wu, L. Wang, A. Zhang, T. Xia, H. Dong, X. Li and L. Zhang, Int. J. Hydrogen Energy, 2009, 34, 4889–4899 CrossRef CAS.
- J. Zhao, Y. Tian, A. Liu, L. Song and Z. Zhao, Mater. Sci. Semicond. Process., 2019, 96, 78–90 CrossRef CAS.
- N. Alidoust and E. A. Carter, Phys. Chem. Chem. Phys., 2015, 17, 18098–18110 RSC.
- S. Lany, J. Osorio-Guillén and A. Zunger, Phys. Rev. B, 2007, 75, 1–4 CrossRef.
- J. Osorio-Guillén, S. Lany and A. Zunger, AIP Conf. Proc., 2009, 1199, 128–129 Search PubMed.
- S. Oswald and W. Brückner, Surf. Interface Anal., 2004, 36, 17–22 CrossRef CAS.
- P. Dubey, N. Kaurav, R. S. Devan, G. S. Okram and Y. K. Kuo, RSC Adv., 2018, 8, 5882–5890 RSC.
- D. M. Duffy and P. W. Tasker, Philos. Mag. A, 1985, 50, 143–154 CrossRef.
- E. L. Ratcliff, J. Meyer, K. X. Steirer, A. Garcia, J. J. Berry, D. S. Ginley, D. C. Olson, A. Kahn and N. R. Armstrong, Chem. Mater., 2011, 23, 4988–5000 CrossRef CAS.
- J. Rabier, J. Soullard, M. P. Puls and J. Soullard, Philos. Mag. A, 1990, 61, 99–108 CrossRef CAS.
- D. Soo Kim and H. Chul Lee, J. Appl. Phys., 2012, 112, 1–5 CrossRef.
- S. Biswas, J. Husek, S. Londo and L. R. Baker, J. Phys. Chem. Lett., 2018, 9, 5047–5054 CrossRef CAS PubMed.
- J. Osorio-Guillén, S. Lany and A. Zunger, AIP Conf. Proc., 2009, 1199, 128–129 Search PubMed.
- S. Lany, J. Osorio-Guillen and A. Zunger, Phys. Rev. B, 2007, 75, 1–4 CrossRef.
- G. K. Kiran, N. Munichandraiah and P. Vishnu Kamath, J. Solid State Electrochem., 2018, 22, 3833–3843 CrossRef CAS.
- K. W. Nam, W. S. Yoon and K. B. Kim, Electrochim. Acta, 2002, 47, 3201–3209 CrossRef CAS.
- I. Bouessay, A. Rougier and J. M. Tarascon, J. Electrochem. Soc., 2004, 151, H145–H152 CrossRef CAS.
- G. Sahoo, S. R. Polaki, A. Pazhedath, N. G. Krishna, T. Mathews and M. Kamruddin, ACS Appl. Energy Mater., 2021, 4, 791–800 CrossRef CAS.
- R. S. Kate, S. A. Khalate and R. J. Deokate, J. Alloys Compd., 2018, 734, 89–111 CrossRef CAS.
- X.-Z. Fu, Y.-J. Zhu, Q.-C. Xu, J. Li, J.-H. Pan, J.-Q. Xu, J.-D. Lin and D.-W. Liao, Solid State Ionics, 2007, 178, 987–993 CrossRef CAS.
- M. Merrill, M. Worsley, A. Wittstock, J. Biener and M. Stadermann, J. Electroanal. Chem., 2014, 717–718, 177–188 CrossRef CAS.
- X.-Z. Fu, X. Wang, Q.-C. Xu, J. Li, J.-Q. Xu, J.-D. Lin and D.-W. Liao, Electrochim. Acta, 2007, 52, 2109–2115 CrossRef CAS.
- J. Wang, Z. Wu, K. Hu, X. Chen and H. Yin, J. Alloys Compd., 2015, 619, 38–43 CrossRef CAS.
- Y. Gan, C. Wang, X. Chen, P. Liang, H. Wan, X. Liu, Q. Tan, H. Wu, H. Rao, H. Wang, J. Zhang, Y. Wang, P. A. van Aken and H. Wang, Chem. Eng. J., 2020, 392, 123661 CrossRef CAS.
- Y. Y. Huang and L. Y. Lin, ACS Appl. Energy Mater., 2018, 1, 2979–2990 CrossRef CAS.
- S. Yoon, E. Kang, J. Kon Kim, C. Wee Lee and J. Lee, Chem. Commun., 2011, 47, 1021–1023 RSC.
- B. S. Singu, S. Palaniappan and K. R. Yoon, J. Appl. Electrochem., 2016, 46, 1039–1047 CrossRef CAS.
- F. J. Morin, Phys. Rev., 1954, 93, 1199–1204 CrossRef CAS.
- V. Biju and M. Abdul Khadar, J. Mater. Sci., 2001, 36, 5779–5787 CrossRef CAS.
- J. Hao, W. Wu, Q. Wang, D. Yan, G. Liu and S. Peng, J. Mater. Chem. A, 2020, 8, 7192–7196 RSC.
- R. Farhi and G. Petot-Ervas, J. Phys. Chem. Solids, 1978, 39, 1169–1173 CrossRef CAS.
- W. C. Tripp and N. M. Tallan, J. Am. Ceram. Soc., 1970, 53, 531–533 CrossRef CAS.
- C. M. Osburn and R. W. Vest, J. Phys. Chem. Solids, 1971, 32, 1343–1354 CrossRef CAS.
- D. M. Duffy and P. W. Tasker, Philos. Mag. A, 1986, 54, 759–771 CrossRef CAS.
- P. M. Oliver, G. W. Watson and S. C. Parker, Phys. Rev. B, 1995, 52, 5323–5329 CrossRef CAS PubMed.
- R. Haugsrud and T. Norby, Solid State Ionics, 1998, 111, 323–332 CrossRef CAS.
- A. Atkinson, A. E. Hughes and A. Hammou, Philos. Mag. A, 1981, 43, 1071–1091 CrossRef CAS.
- A. Atkinson and R. I. Taylor, Philos. Mag. A, 1981, 43, 979–998 CrossRef CAS.
- T. Karakasidis and M. Meyer, Phys. Rev. B, 1997, 55, 13853–13864 CrossRef CAS.
- K. L. Kliewer and J. S. Kohler, Phys. Rev. Lett., 1965, 140, A1226–A1240 Search PubMed.
- R. A. De Souza, Phys. Chem. Chem. Phys., 2009, 11, 3010 RSC.
- D. M. Duffy and P. W. Tasker, Philos. Mag. A, 1985, 50, 143–154 CrossRef.
- M. Kahouli, A. Barhoumi, A. Bouzid, A. Al-Hajry and S. Guermazi, Superlattices Microstruct., 2015, 85, 7–23 CrossRef CAS.
- A. Seetharaman and S. Dhanuskodi, Spectrochim. Acta, Part A, 2014, 127, 543–549 CrossRef CAS PubMed.
- P. Scardi, M. Leoni and R. Delhez, J. Appl. Crystallogr., 2004, 37, 381–390 CrossRef CAS.
- https://www.malvernpanalytical.com/en/products/category/software/x-ray-diffraction-software/highscore-with-plus-option.
- T. Degen, M. Sadki, E. Bron, U. König and G. Nénert, Powder Diffr., 2014, 29, S13–S18 CrossRef CAS.
- E. J. Sonneveld, G. J. M. Sprong, T. H. de Keijser and R. Delhez, Powder Diffr., 1995, 10, 129–139 CrossRef.
- E. L. Ratcliff, J. Meyer, K. X. Steirer, A. Garcia, J. J. Berry, D. S. Ginley, D. C. Olson, A. Kahn and N. R. Armstrong, Chem. Mater., 2011, 23, 4988–5000 CrossRef CAS.
- M. C. Biesinger, B. P. Payne, L. W. M. Lau, A. Gerson and R. S. C. Smart, Surf. Interface Anal., 2009, 41, 324–332 CrossRef CAS.
- R. J. O. Mossanek, I. Preda, M. Abbate, J. Rubio-Zuazo, G. R. Castro, A. Vollmer, A. Gutiérrez and L. Soriano, Chem. Phys. Lett., 2011, 501, 437–441 CrossRef CAS.
- L. Soriano, I. Preda, A. Gutiérrez, S. Palacín, M. Abbate and A. Vollmer, Phys. Rev. B, 2007, 75, 1–4 CrossRef.
- F. Fiévet, P. Germi, F. de Bergevin and M. Figlarz, J. Appl. Crystallogr., 1979, 12, 387–394 CrossRef.
- R. K. Sood, A. E. Nya and E. S. Etim, J. Therm. Anal., 1984, 22, 231–237 CrossRef.
- R. C. Korošec and P. Bukovec, Acta Chim. Slov., 2006, 53, 136–147 Search PubMed.
- P. Bhojane, J. Energy Storage, 2022, 45, 103654 CrossRef.
- R. M. Obodo, N. M. Shinde, U. K. Chime, S. Ezugwu, A. C. Nwanya, I. Ahmad, M. Maaza, P. M. Ejikeme and F. I. Ezema, Curr. Opin. Electrochem., 2020, 21, 242–249 CrossRef CAS.
- V. Srinivasan and J. W. Weidner, J. Electrochem. Soc., 2000, 147, 880 CrossRef CAS.
- S. K. Meher, P. Justin and G. R. Rao, ACS Appl. Mater. Interfaces, 2011, 3, 2063–2073 CrossRef CAS PubMed.
- V. Srinivasan and J. W. Weidner, J. Electrochem. Soc., 1997, 144, L210–L213 CrossRef CAS.
- Y. Q. Zhang, X. H. Xia, J. P. Tu, Y. J. Mai, S. J. Shi, X. L. Wang and C. D. Gu, J. Power Sources, 2012, 199, 413–417 CrossRef CAS.
- X. Xia, J. Tu, Y. Mai, R. Chen, X. Wang, C. Gu and X. Zhao, Chem. - A Eur. J., 2011, 17, 10898–10905 CrossRef CAS PubMed.
- K. K. Purushothaman, I. Manohara Babu, B. Sethuraman and G. Muralidharan, ACS Appl. Mater. Interfaces, 2013, 5, 10767–10773 CrossRef CAS PubMed.
- F. I. Dar, K. R. Moonooswamy and M. Es-Souni, Nanoscale Res. Lett., 2013, 8, 1–7 CrossRef PubMed.
- A. J. Bard and L. R. Faulkner, in Electrochemical Methods: fundamentals and applications, John Willey & Sons,. Inc., New York, 2nd edn, 2001, pp. 534–580 Search PubMed.
- S. Saha, K. Kishor, S. Sivakumar and R. G. S. Pala, J. Indian Inst. Sci., 2016, 96, 325–349 Search PubMed.
- L. Trotochaud, J. K. Ranney, K. N. Williams and S. W. Boettcher, J. Am. Chem. Soc., 2012, 134, 17253–17261 CrossRef CAS PubMed.
- X. Li, S. Xiong, J. Li, J. Bai and Y. Qian, J. Mater. Chem., 2012, 22, 14276–14283 RSC.
- Y. Jiang and J. Liu, Energy Environ. Mater., 2019, 2, 30–37 CrossRef.
- V. Srinivasan and J. W. Weidner, J. Electrochem. Soc., 1997, 144, L210–L213 CrossRef CAS.
- S. K. Meher, P. Justin and G. Ranga Rao, ACS Appl. Mater. Interfaces, 2011, 3, 2063–2073 CrossRef CAS PubMed.
- S. Ardizzone, G. Frefonara and S. Trasatti, Electrochim. Acta, 1990, 35, 263–267 CrossRef CAS.
- K. K. Purushottaman, I. M. Babu, B. Sethuraman and G. Muralidharan, ACS Appl. Mater. Interfaces, 2013, 5, 10767–10773 CrossRef PubMed.
- M. Khairy and S. A. El-Safty, RSC Adv., 2013, 3, 23801–23809 RSC.
- J. W. Lee, T. Ahn, J. H. Kim, J. M. Ko and J. D. Kim, Electrochim. Acta, 2011, 56, 4849–4857 CrossRef CAS.
- N. Li, D. K. Bediako, R. G. Hadt, D. Hayes, T. J. Kempa, F. Von Cube, D. C. Bell, L. X. Chen and D. G. Nocera, Proc. Natl. Acad. Sci. U. S. A., 2017, 114, 1486–1491 CrossRef CAS PubMed.
- R. D. Smith and C. P. Berlinguette, J. Am. Chem. Soc., 2016, 138, 1561–1567 CrossRef CAS PubMed.
- B. J. Trześniewski, O. Diaz-Morales, D. A. Vermaas, A. Longo, W. Bras, M. T. M. Koper and W. A. Smith, J. Am. Chem. Soc., 2015, 137, 15112–15121 CrossRef PubMed.
- C. Kuai, Y. Zhang, L. Han, H. L. Xin, C. J. Sun, D. Nordlund, S. Qiao, X. W. Du and F. Lin, J. Mater. Chem. A, 2020, 8, 10747–10754 RSC.
- W. C. Tripp and N. M. Tallan, J. Am. Ceram. Soc., 1970, 53, 531–533 CrossRef CAS.
- C. M. Osburn and R. W. Vest, J. Phys. Chem. Solids, 1971, 32, 1343–1354 CrossRef CAS.
- J. Yu, K. M. Rosso and S. M. Bruemmer, J. Phys. Chem. C, 2012, 116, 1948–1954 CrossRef CAS.
- R. Haugsrud and T. Norby, Solid State Ionics, 1998, 111, 323–332 CrossRef CAS.
- L. M. Manceriu, P. Colson, A. Maho, G. Eppe, N. D. Nguyen, C. Labrugere, A. Rougier, R. Cloots and C. Henrist, J. Phys. D, 2017, 50, 52–59 CrossRef.
- H. Sato, T. Minami, S. Takata and T. Yamada, Thin Solid Films, 1993, 236, 27–31 CrossRef CAS.
- D. M. Duffy and P. W. Tasker, Philos. Mag. A, 1983, 48, 155–162 CrossRef CAS.
- R. Kirchheim, Acta Mater., 2002, 50, 413–419 CrossRef CAS.
Footnote |
| † Electronic supplementary information (ESI) available. See DOI: 10.1039/d1ra09000c |
| This journal is © The Royal Society of Chemistry 2022 |