 Open Access Article
Investigation of temperature and frequency dependence of the dielectric properties of multiferroic (La0.8Ca0.2)0.4Bi0.6FeO3 nanoparticles for energy storage application
Amira Bougoffa *a,
E. M. Benali
 ad,
A. Benaliabd,
M. Bejar
 a,
E. Dhahri
 a,
M. P. F. Graça
 b,
M. A. Valente
 b,
G. Otero-Iruruetac and
B. F. O. Costad
aLaboratory of Applied Physics, Faculty of Sciences of Sfax, University of Sfax, B. P. 1171, Sfax, 3000, Tunisia. E-mail: amirabougoffa@gmail.com; Tel: +216 26 923 772
bI3N, Physics Department, University of Aveiro, Campus de Santiago, Aveiro, Portugal
cCentre for Mechanical Technology& Automation (TEMA), University of Aveiro, 3810-193, Aveiro, Portugal
dUniversity of Coimbra, CFisUC, Physics Department, Rua Larga, P-3004-516 Coimbra, Portugal
First published on 1st March 2022
Abstract
In this work we synthesized the multifunctional (La0.8Ca0.2)0.4Bi0.6FeO3 material using a sol–gel process. Structural and morphologic investigations reveal a Pnma perovskite structure at room temperature with spherical and polygonal nanoparticles. A detailed study of the temperature dependence of the dielectric and electrical properties of the studied material proves a typical FE–PE transition with a colossal value of real permittivity at 350 K that allows the use of this material in energy storage devices. Thus, the investigation of the frequency dependence of the ac conductivity proves a correlated barrier hopping (CBH) conduction mechanism to be dominant in the temperature ranges of 150–170 K; the two observed Jonscher's power law exponents, s1 and s2 between 180 K and 270 K correspond to the observed dispersions in the ac conductivity spectra in this temperature region, unlike in the temperature range of 250–320 K, the small polaron tunnel (NSPT) was considered the appropriate conduction model.
1. Introduction
The evolution of human activities, the increase of world population and the integration of new technologies has led to a strong growth in energy needs. Therefore, the increase of this consumption can result the depletion of the materials for energy production. It is then expected that the price of these materials will further increase which makes academia and industry research new efficient materials with low cost and simple synthesis processes.Recently, great attention is granted to multiferroic materials due to the diversity of their application fields due to the combination of their ferroelectric and ferromagnetic behavior and their dependence on both frequency and temperature.1
Therefore, these materials can provide simultaneously different solutions to energy production problems. Indeed, perovskite structured LaFeO3 has been intensively studied because of its particular properties making it a potential material for several applications: chemical sensors,2 catalytic devices,3 fuel cells,4 gas sensors,5 memory devices and magnetic refrigerants.6 This typical material exhibited a high ferroelectric transition temperature (≈715 K).7 In order to shift this transition near the room temperature and enhance the dielectric stability, a significant number of researches have been developed a diversity of substitutions at A or/and B-sites of these materials.8 In fact, introducing another cation in the A or B site can perturb the neutrality of the perovskite structure resulting then a strong change on the structural and physical properties.9–12 Previous research works, reported that bismuth atom exhibits golden properties where its introduction in perovskite materials can induce multiferroic properties.13 This kind of materials can provide several dielectric behaviors at the same time (ferroelectric, anti-ferroelectric, ferromagnetic…). As it is well known, in these days, anti-ferroelectrics, ferroelectrics, linear dielectrics, and relaxor ferroelectrics materials present the frequent dielectric materials for electronic devices applications.14 By comparing with linear dielectric and ferroelectric materials, anti-ferroelectrics ones exhibit generally a significantly high energy-storage density due to the absence of remnant polarization (Pr).15 In another hand, relaxor ferroelectrics behave efficient because of their low Pr value that is why they are frequently requested as an ideal ceramic for energy-storage applications.16,17
Therefore, the aim of this study is to investigate the temperature and frequency dependence of dielectric properties of the multiferroic (La0.8Ca0.2)0.4Bi0.6FeO3 compound. In fact, the studied material was prepared by sol–gel route. Then, the X-ray diffraction was used to examine the purity and the crystal structure. The morphology and particles size have been observed by electron scanning microscopy and the Transmission Electronic Microscopy (TEM). Thus, the XPS technique aims to study and quantify the oxidation state of the chemical elements that constitute the studied compound. The dielectric measurements were performed under the temperature range 150–400 K and the frequency range of 102–106 Hz in order to discuss the temperature and frequency dependence of the electrical and dielectric properties of the prepared material.
2. Preparation methods
2.1 Sol–gel route
(La0.8Ca0.2)0.4Bi0.6FeO3 nanosize compound was prepared by the sol–gel method using the citric acid route.18,19 Stoichiometric amounts of high-purity lanthanum nitrate (La(NO3)3·6H2O), iron(III) nitrate nonahydrate (Fe(NO3)3·9H2O), calcium nitrate (Ca(NO3)2·4H2O) and bismuth nitrate pentahydrate (Bi(NO3)3·9H2O) were dissolved in ethylene glycol in proper stoichiometric proportions. The mixture solution was stirred continuously until a clear solution was observed. Then, an appropriate amount of citric acid (molar ration nitrates/citric acid equal to 1/2) was added to the solution and magnetic stirred for almost 2 hours at 70 °C until a viscous gel was formed. The formed gel was heated at 170 °C with continuous stirring which promotes the evaporation of gases and the formation of a brown residue powder which was heated at 300 °C for 12 hours. After that the obtained powder was grounded and pressed into pellets with 7 mm of diameter, under an axial pressure of about 104 N cm−2, and then annealed 4 hours at 800 °C to finally obtain the (La0.8Ca0.2)0.4Bi0.6FeO3 compound.2.2 Characterization methods
The phase and structure of the as-prepared powder were determined by X-Ray Diffraction (XRD) using the Bruker D8 Advance X-ray powder diffractometer with CuKα1 radiation (λ = 1.5406 Å). After that the, the obtained pattern was refined using the FullProf software20 in order to extract the lattice parameters and the structural positions of atoms. Microstructures and grain sizes were evaluated by a TESCAN VEGA3 SBH microscope, operating at 20 kV and equipped with an EDS detector BRUKERXFLAGH 410M, which allowed the detection of the characteristic X-rays emitted by the sample and, thus, the identification of its chemical elements. TEM images were obtained with a FEI Tecnai G2 with an acceleration voltage of 200 kV, in bright field. The carbon grids were immersed in dilute suspensions of the nanoparticles and, after sonication the grids were placed in the microscope. ImageJ software was used to obtain the size of the nanocomplexes.The XPS spectra were acquired in an Ultra High Vacuum (UHV) system with a base pressure of 2 × 10⁻¹⁰ mbar. The system is equipped with a hemispherical electron energy analyzer (SPECS Phoibos 150), a delay-line detector and a monochromatic AlKα (1486.74 eV) X-ray source. High resolution spectra were recorded at normal emission take-off angle and with a pass-energy of 20 eV, providing an overall instrumental peak broadening of 0.5 eV. The resulting XPS spectra were calibrated in binding energy and using the C 1s peak as a reference from contamination at 285.0 eV.
For the dielectric measurements, the sample was kept in a helium atmosphere to minimize thermal gradient. An Oxford Research IT-C4 was equipped to control the temperature that was measured using a platinum sensor under the range from 150 K to 400 K. Then, the impedance of the sample was measured with an Agilent 4294 Network Analyzer in the frequency range between 100 Hz and 1 MHz in the Cp–Rp configuration (capacitance in parallel with resistance).21–23
3. Results and discussions
3.1 Structural study
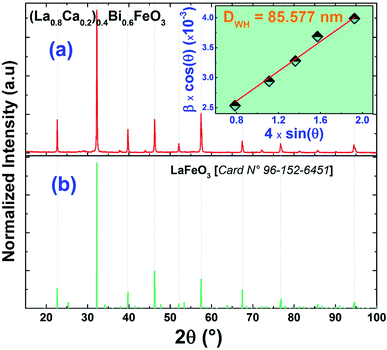
We plotted in Fig. 1(a) the room temperature X-ray diffractogram of the (La0.8Ca0.2)0.4Bi0.6FeO3 compound. As we can see, eight characteristic peaks at 2θ equal to 22.65°, 32.24°, 39.75°, 46.22°, 52.08°, 57.47°, 67.40°, and 72.68° have been detected. These diffractions peaks correspond well respectively to the (110), (121), (220), (202), (141), (240), (242), and (024) planes of the layered structure of lanthanum ferrite LaFeO3 (JCPDS card No. 96-152-6451),24 as presented in Fig. 1(b). The XRD pattern of the (La0.8Ca0.2)0.4Bi0.6FeO3 compound found to be almost identical to that of previously studied La0.8Ca0.2FeO3 studied compound25 with a slight modification of the peak positions following the insertion of Bi3+ ions in A-site. Importantly, we mention that for BiFeO3 multiferroic material, the insertion of 20% of lanthanum ions in A-site leads to a structural transition from rhombohedral (R3c) to orthorhombic (Pnma).26 Additionally, some other diffraction peaks with a very low intensity have been detected and were associated to the Bi2Fe4O9 minoritarian phase according to the X-pert High score software. The appearance of the secondary Bi2Fe4O9 phase is in good agreement with previous studies.27–29 We have also calculated the average crystallite size (DWH) using the position and the half width of the five most intensive peaks according to the Williamson–Hall formalism30 (eqn (1)).
 | (1) |
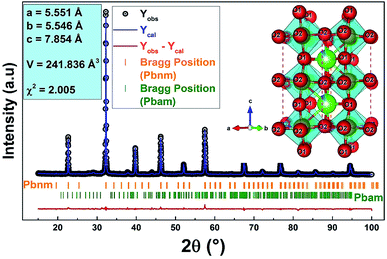
Furthermore, in order to have deep information about the insertion of 60% of Bi3+ ions in A-site on structural properties we have adjusted the XRD pattern according to the Rietveld refinement method using the FULLPROF Rietveld software20 and the refinement results of the XRD patterns for both compounds are plotted in Fig. 2. As one can see, the refinement has been realized with a majoritarian Pbnm phase and a second Pbma associated to the mean phase and the secondary phase, respectively. In this figure, the black color refer to the experimental diffractogram, the blue one present to calculated spectrum, the difference between the two in displayed in red color and the Bragg positions are shown in green. The resulting lattice parameters and the volume values are presented in Fig. 2.
We note here that the parameter χ2 informs us about the quality of the fit. It is an agreement between the observed and calculated diffractogram, close to unity for perfect refinement.
3.2 Morphological
We have used a Scanning Electron Microscope (SEM) in order to analyze the surface morphology of the (La0.8Ca0.2)0.4Bi0.6FeO3 compound. As one can see in Fig. 3, SEM image shows a high dense morphology of grains with spherical and polygonal shapes. The EDS spectra and the EDX area mapping are shown also in Fig. 3(a–g). Accordingly, we confirm that all chemical elements are present and are homogeneously distributed in the (La0.8Ca0.2)0.4Bi0.6FeO3 compound which confirms no loss of any chemical element during the preparation steps.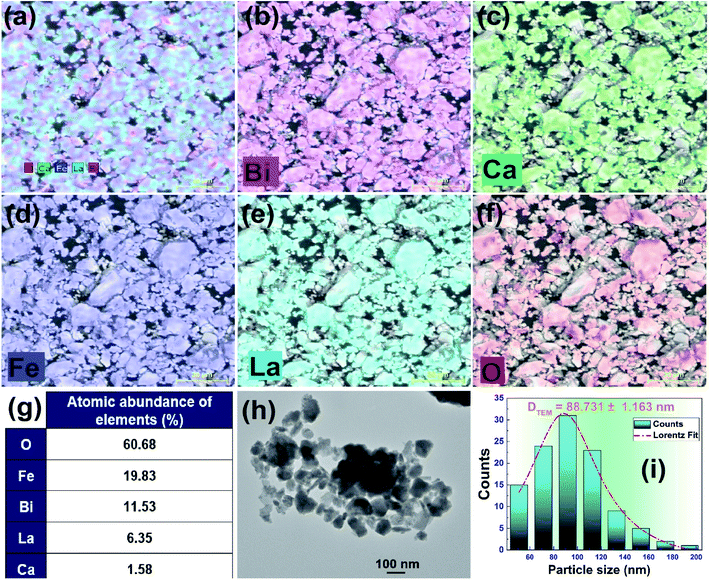 | ||
| Fig. 3 (a–f) Elemental mapping of La, Ca, Bi, Fe, and oxygen; (g) EDX spectra; (h) TEM micrograph and (i) the corresponding size distribution analysis of the (La0.8Ca0.2)0.4Bi0.6FeO3 compound. | ||
For further analyses of the particle size in the prepared compound, the “Image-J” software has been used to estimate the average particle size (DTEM) from TEM image for (La0.8Ca0.2)0.4Bi0.6FeO3 compound as shown in Fig. 3(h) and (i). Note that the average particle size was determined by a Lorentzian fit of the particle size distribution deduced from the Image-J result. The average particle size DTEM of the studied compound was found to be around 88.73 nm. This value is almost equal to the average crystallite sized DWH calculated by the Williamson–Hall method indicating that each grain is made up of one crystallite. Importantly, we confirm the nanosize criteria of the (La0.8Ca0.2)0.4Bi0.6FeO3 compound.
3.3 XPS study
The X-ray Photoemission Spectroscopy (XPS) was employed to analyze the electronic structure of the (La0.8Ca0.2)0.4Bi0.6FeO3 material.As displayed in Fig. 4, all the peak positions were indexed referring to the National Institute of Standards and Technology (NIST) XPS database.31 The survey scan reveals the presence of the constituent elements: La, Ca, Bi, Fe, and O as well as the absence of any foreign element in this compound other than C 1s one located at about 285.0 eV. Indeed, the presence of this element can be due to the surface adsorbed C atoms from the atmosphere which occurs quite commonly in the XPS spectra of many compounds.
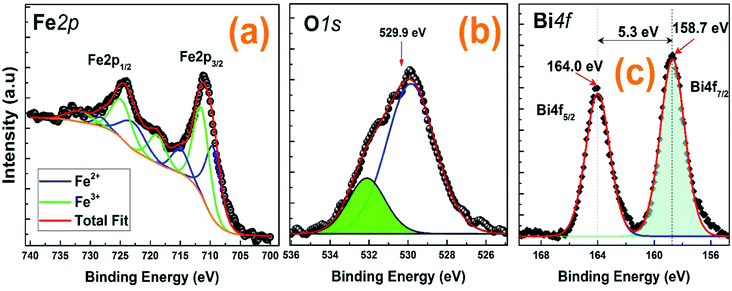 | ||
| Fig. 4 XPS results obtained of (a) Fe 2p, (b) O 1s and (c) Bi 4f for the (La0.8Ca0.2)0.4Bi0.6FeO3 compound. The best fits are also included. | ||
Fe 2p core level shown in Fig. 4(a) can be deconvoluted by two set of components ascribed to Fe2+ (blue components) and Fe3+ (green). Previous works on similar samples indicated that a slight oxygen deficiency results in the combination of Fe2+ and Fe3+ ions.32,33 The ratio Fe3+/Fe2+ obtained by the fit of the XPS spectra was 1.2, slightly higher than the recently obtained by Zhang et al. for BFO samples.30 Fe2+ components were centred at binding energies (BEs) of 709.6 eV, 715 eV, 722.8 eV and 728.2 eV and they were ascribed to Fe 2p3/2, a satellite, Fe 2p1/2 and a satellite, respectively. Similarly, the respective components ascribed to Fe3+ appeared at BEs of 711.5 eV (Fe 2p3/2), 718.9 eV (sat.), 724.8 eV (Fe 2p1/2) and 731.8 eV (sat.). These values are in good agreement with previous reported values for Fe 2p core level.32,34,35 On the other hand, O 1s (Fig. 4(b)) was fitted by two components centred at BEs of 529.9 eV and 532.1 eV. The component at lower BE was ascribed to the oxygen atoms in the lattice while the other is associated to hydroxyl groups covering the surface structural defects (oxygen vacancies).32 Moreover, as shown in Fig. 4(c), Bi 4f was fitted by two components at BEs of 158.7 eV and 164.0 eV. The component at lower BE is ascribed to Bi 4f7/2 while the component at higher BE is Bi 4f5/2. Both, the energies of the peaks and the spin–orbit splitting between them (5.3 eV) are in good agreement with oxidized bismuth (Bi3+).32–34,36
3.4 Dielectric properties
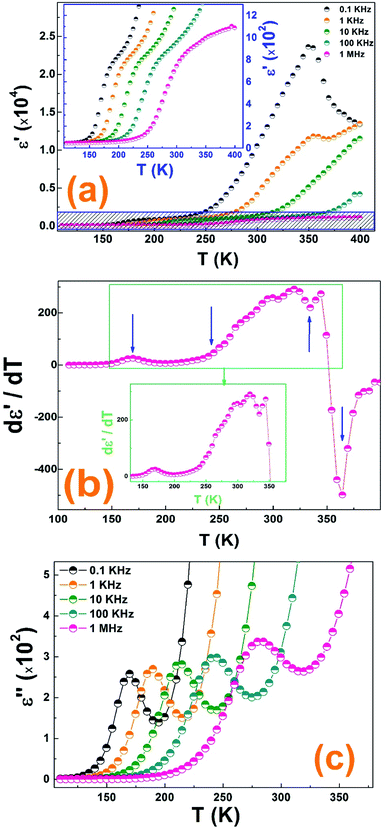
Indeed, the real dielectric permittivity start to increase at 240 K until reaching a maximum at around 350 K and then it starts to decrease sharply.
It is important to mention that the increase in frequency was accompanied by a rapid drop in the maximum dielectric constant at 350 K. This decrease results from the reduction of space charge polarization effect. Further, the achieved colossal dielectric constant at low frequency (≈2.3 × 10⁴) is attributed to the existence of a potential barrier generated by space charge polarization at the grain boundaries which induces a charge accumulation at the grain boundaries produced at higher ε′ values. Such high value, in the paraelectric phase, allows the use of this material in energy storage devices.37 Thus, the dielectric dispersion can be understood according to the Koop's phenomenological theory based on Maxwell Wagner's interfacial polarization model estimating that a dielectric can be considered as an inhomogeneous medium containing two different layers, fairly well conducting grains separated by poorly conducting grain boundaries.
As a result, the temperature dependence of the permittivity spectra can estimate the dielectric behavior of the (La0.8Ca0.2)0.4Bi0.6FeO3 material. Due to the diversity of the application field of the ferroelectric material, the investigation of the frequency dependence of dielectric behavior will be aimed to the ferroelectric phase of this material above the Tc = 350 K.
Based on the Cole–Cole model, the experimental data of the real and imaginary parts of the dielectric permittivity can be analyzed based on the following expressions:36
 | (2) |
 | (3) |
εs and ε∞ are the values of the static dielectric constant determined at low and high frequency respectively. Also, τ is the relaxation time and α describes the distribution of relaxation times.
Fig. 6(a) shows the frequency dependence of the permittivity real part of the (La0.8Ca0.2)0.4Bi0.6FeO3 sample under the three cited temperature regions. These plots prove clearly only one Cole–Cole kind dispersion below 180 K (region I), at low frequencies, due to the interfacial polarization, that shift to the high frequencies. While in the region II, two Cole–Cole dispersions are visible where one appears from low frequencies region.
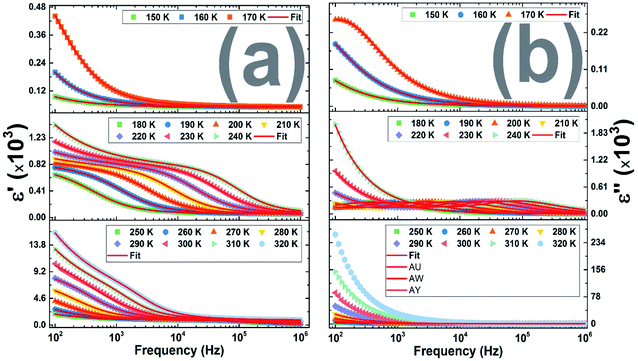 | ||
| Fig. 6 Frequency dependence of (a) the real part of the dielectric permittivity (b) the imaginary part of the dielectric permittivity. | ||
It is to note that, when increasing temperature, all dielectric dispersions shift to higher frequencies showing at the time the frequency and temperature dependence of the dielectric constant and that the polarization process gradually vanishes at high frequency range. Moreover, for all temperatures, it is clear that ε′ becomes frequency independent at the high applied frequencies suggesting that almost of diploes do not respond the applied frequency.
These two processes are mainly attributed to the interfacial and dipolar polarizations37 explaining the appearance of dielectric relaxations in the ε′′ spectra as shown in Fig. 6(b).
Fig. 7(a) illustrates the variation of the imaginary complex modulus part of (La0.8Ca0.2)0.4Bi0.6FeO3 compound as a function of frequency in the three temperature regions. In region I and II, the plots show clearly the appearance of resolved peaks at unique frequency indicating a transition from long to short range mobility where the carriers are confined to potential wells. This peak translates to the high frequency region indicating a decrease in the relaxation time with increasing temperature and then its thermal activation.38
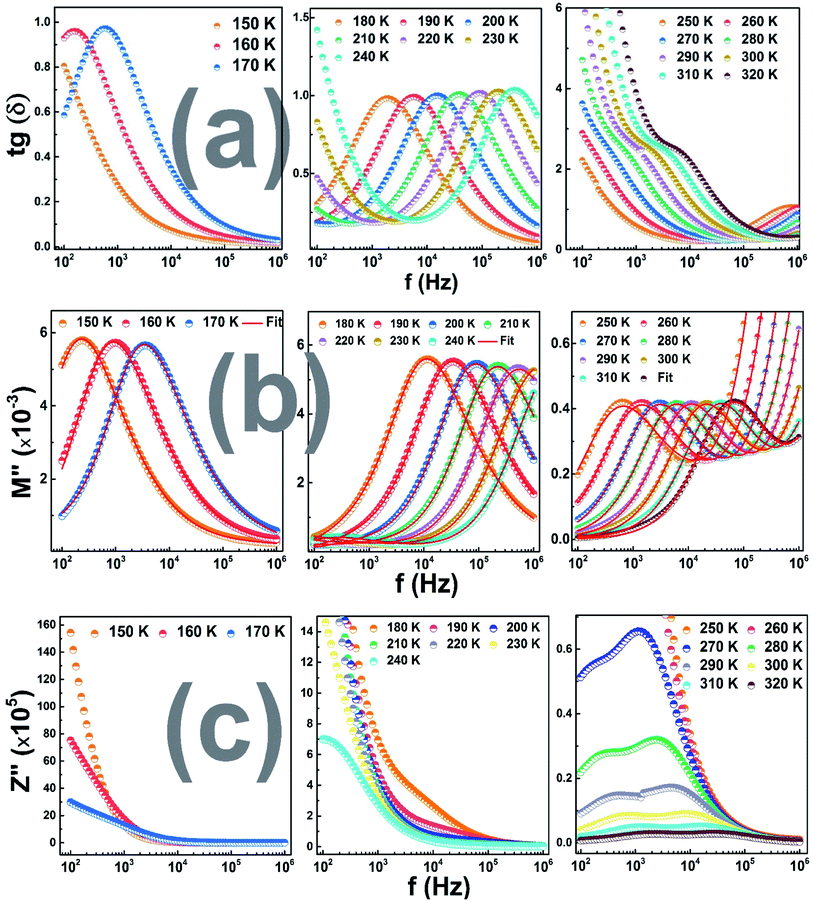 | ||
Fig. 7 Frequency dependence of (a) tg![[thin space (1/6-em)]](https://www.rsc.org/images/entities/char_2009.gif) δ, (b) the imaginary part of the electrical modulus, (c) the imaginary part of the impedance. δ, (b) the imaginary part of the electrical modulus, (c) the imaginary part of the impedance. | ||
Another key point, this peak start to disappear and a new one appear from the low frequencies after 240 K. The coexisting of the two observed relaxation between 240 K and 320 K (region III) can be related to the long behavior of the observed dielectric transition.39 As shown in Fig. 7(b), the variation of tg![[thin space (1/6-em)]](https://www.rsc.org/images/entities/char_2009.gif) δ versus frequency, plots in the different temperature regions, follows the same behavior of M′′. Further, we noted low values of dielectric loss that can mention the high quality of the (La0.8Ca0.2)0.4Bi0.6FeO3 as material for energy storage devices.40
δ versus frequency, plots in the different temperature regions, follows the same behavior of M′′. Further, we noted low values of dielectric loss that can mention the high quality of the (La0.8Ca0.2)0.4Bi0.6FeO3 as material for energy storage devices.40
In Fig. 7(c), it is plotted the dependence of Z′′ on frequency of the studied material at the three temperature regions. We clearly observe one peak starts to appear after 180 K (region II) while we note the appearance of a second one in the third temperature region affirming the presence of two different relaxation phenomena where it's are present two different structures.41
In another hand, the observed relaxation peaks, corresponding to the maximal values of Z′′ curves, translate to the high frequency region as the temperature increases indicating the thermal activated behavior of the relaxation process. It is also important to mention that for each measuring temperature, the relaxation peaks shift to the higher frequencies proving a reduction of the relaxation.42 Moreover, at higher frequency region, we noted a merge of all the Z′′ curves and any dependence on both frequency and temperature due to the space charge accumulation in the material where its do not require more time to relax at high frequencies leading to the reduction of their polarization with the frequency rising.43
To more understand this behavior of transition, we plotted in Fig. 8 the variation of log(fmax) as a function of the 1000/T, from the experimental data of the impedance, modulus and tg![[thin space (1/6-em)]](https://www.rsc.org/images/entities/char_2009.gif) δ, according to the Arrhenius law:
δ, according to the Arrhenius law:
 | (4) |
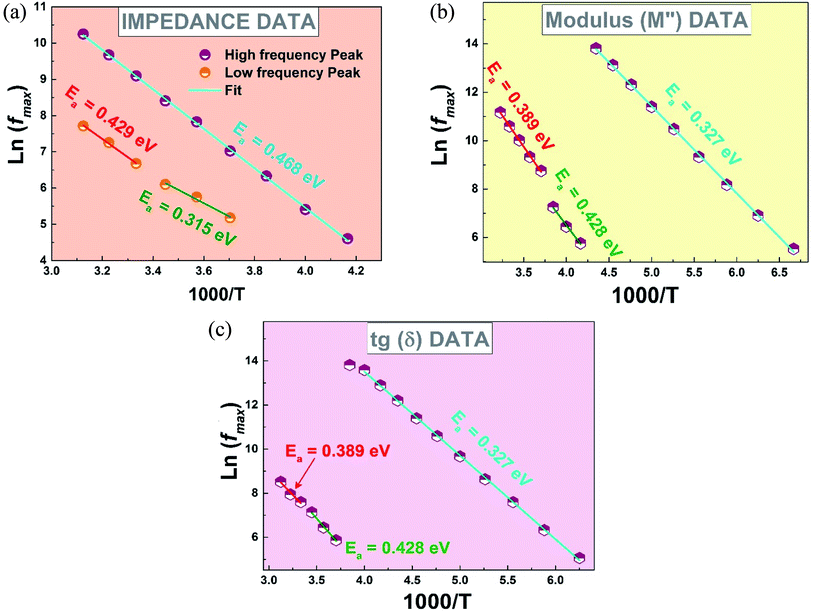 | ||
Fig. 8 Variation of ln(fmax) versus 1000/T from (a) the impedance data (b) the modulus data (c) tg![[thin space (1/6-em)]](https://www.rsc.org/images/entities/char_2009.gif) δ data. δ data. | ||
fmax is the frequency corresponding to the maximum value of the imaginary part of the complex modulus M′′.
f0 is a pre-exponential factor.
Ea is the activation energy.
kB is the Boltzmann constant.
T is the temperature.
As clearly seen, Fig. 8 shows the existence of four linear regions, three regions with negative slopes corresponding to the FE and PE phases and one another region with a positive slope around 240 K corresponding to the FE–PE transition39 which needs a time to pass from the FE phase to the PE39 phase confirming then the above observed behavior.
The frequency effect is appeared only at high frequencies, which is manifested of a dispersion behavior. Therefore, in this frequency region, the conductivity is provided with a second term deriving from the ionic atmosphere relaxation after particles movement and follows the universal power law of (Aωs).44
By respecting the temperature dependence of the dielectric properties discussed below, we can clearly observe the presence of only one dispersion behavior in region I of temperature. While a second one appeared in region II and starts to disappear after the first one after 240 K. This behavior proves that the conductivity enhancement results from the improvement of the hopping probability of charge carriers by the frequency increasing.
Accordingly, the relaxation appeared in the ε′ and σac variation versus frequency can be described by the combination juxtaposition of two behaviors corresponding to the observed ferroelectric to paraelectric transition near to the room temperature.
Therefore, according to the above discussion, the AC conductivity dispersion can be analyzed based on the following equation:45
 | (5) |
σs presents the conductivity at low frequencies, σ∞ is an estimate of conductivity at high frequencies, ω = 2πf refers to the angular frequency, τ corresponds to the characteristic relaxation time, A is a temperature dependent constant that determines the strength of polarizability46 and s is the power law exponent describing the degree of interaction between mobile ions with the environments surrounding them.
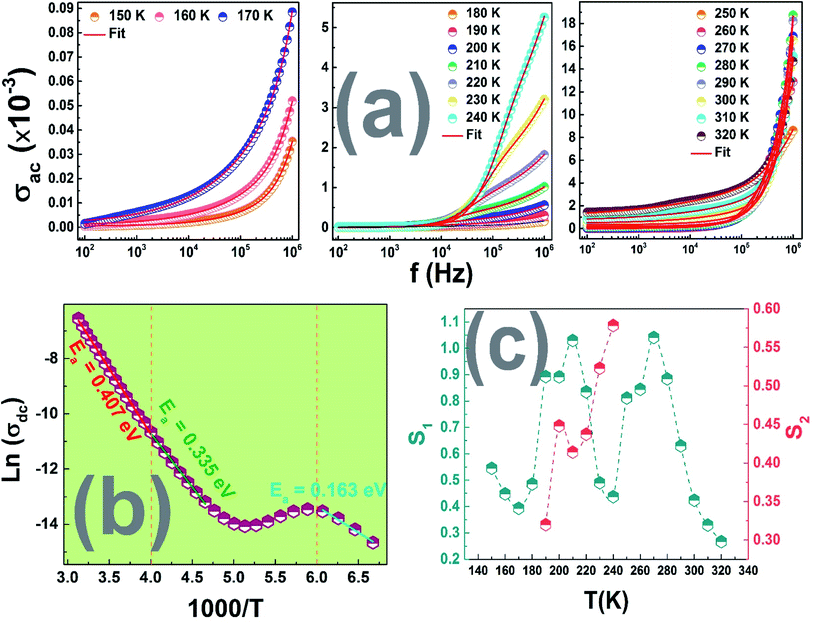
The variation of DC conductivity, with the reciprocal temperature for this compound, is shown in Fig. 9(c).
In the different distinguished regions, this graph shows a linear response explained by a thermally activated transport having an Arrhenius type behavior which is expressed by the following law:
 | (6) |
The observed plots exhibited the same behavior as the observed one in Fig. 8 confirming once again the dielectric phase transition between 240 K and 350 K with a the decrease in the activation energies values in the three regions. Once can see that the conductivity increases with the increase of temperature while the activation energy has the same behavior i.e., Ea increase with increasing temperature, which is in good agreement with the fact that lower activation energy is associated with higher dielectric constant and higher conductivity.47
Furthermore, the variation of “s” with temperature is shown in Fig. 9(c). The behavior of this exponent with respect to temperature is a powerful indicator of the origin of the conduction mechanism. It is noted that, for the studied material, this behavior varies remarkably with the considered temperature range.
Indeed, in region I, a decrease in the exponent s with the increase in temperature is observed due to the increase in the interaction. In region II, two exponent, s1 and s2 are observed corresponding to the observed dispersion in the ac conductivity spectra in this region of temperature. The minimum reached at 240 K implies the strong interaction between the charge carriers and the lattices. Such behavior proves the predominance of the correlated barrier hopping (CBH) conduction mechanism.
Then, in region III an increase in the exponent s with the increase in temperature is observed indicating a small polaron tunnel (NSPT). After that, a decreasing of s beckons an increase in the randomness in the system. In fact, for high temperatures, dipoles and charge carriers respond independently to the external field. Therefore, the conduction model which is often adopted for such behavior is the CBH one.
4. Conclusion
(La0.8Ca0.2)0.4Bi0.6FeO3 nanoparticles, synthesized by means of sol–gel process, were found to have a perovskite-type structure with the coexistence of R3c and Pnma space groups at room temperature. TEM observation proves the formation of spherical and polygonal nanoparticles. By conducting comprehensive dielectric and electrical studies on the prepared material, an anomaly in the dielectric constant was detected near the room temperature, corresponding to a typical FE–PE transition with a colossal value of real permittivity at 350 K that allows the use of this material in energy storage devices. This anomaly is well confirmed by supplementary analyzes of the complex electrical modulus and the AC conductivity spectra. On the other hand, the correlated barrier hopping (CBH) conduction mechanism was proven to be dominant in the temperature ranges of 150–170 K, the two observed exponent, s1 and s2 between 180 K and 270 K correspond to the observed dispersions in the ac conductivity spectra in this region of temperature, unlike the temperature range of 240 K at 320 K where the small polaron tunnel (NSPT) was considered the appropriate conduction model.Conflicts of interest
There are no conflicts to declare.Acknowledgements
This work was supported by national funds from FCT – Fundação para a Ciência e a Tecnologia, I. P., within the project UID/04564/2020. Access to TAIL-UC facility funded under QREN-Mais Centro Project No. ICT_2009_02_012_1890 is gratefully acknowledged. Also, the authors would like to acknowledge the financial support from FCT – Fundação para a Ciência e a Tecnologia, Portugal, Project No. UID/CTM/50025/2013 I3N.References
- I. C. Nlebedim, M. Vinitha, P. J. Praveen, D. Das and D. C. Jiles, J. Appl. Phys., 2013, 113, 193904 CrossRef.
- A. Benali, S. Azizi, M. Bejar, E. Dhahri and M. F. P. Graça, Ceram. Int., 2014, 40, 14367 CrossRef CAS.
- K. T. C. Roseno, R. Brackmann, M. A. da Silva and M. Schmal, Int. J. Hydrogen Energy, 2016, 41, 18178 CrossRef CAS.
- S. J. Skinner, Fuel Cell. Bull., 2001, 4, 6–12 CrossRef.
- E. Delgado and C. R. Michel, Mater. Lett., 2006, 60, 1613–1616 CrossRef CAS.
- V. S. Kolat, H. Gencer, M. Gunes and S. Atalay, Mater. Sci. Eng. B, 2007, 140, 217 CrossRef.
- A. S. Mahapatra, A. Mitra, A. Mallick, A. Shaw, J. M. Greneche and P. K. Chakrabarti, Modulation of magnetic and dielectric property of LaFeO3 by simultaneous doping with Ca2+ and Co2+-ions, J. Alloys Compd., 2018, 743, 274–282 CrossRef CAS.
- P. Barahona, O. Peña, A. B. Antunes, C. Campos, G. Pecchi, Y. Moreno, C. Moure and V. Gil, J. Magn. Magn. Mater., 2008, 320, 61–64 CrossRef.
- A. Bougoffa, A. Benali, M. Bejar, E. Dhahri, M. P. F. Graca, M. A. Valente, L. Bessais and B. F. O. Costa, J. Alloys Compd., 2021, 856, 157425 CrossRef CAS.
- A. Benali, M. Bejar, E. Dhahri, M. P. F. Graça, M. A. Valente, E. K. Hlil and B. F. O. Costa, Structural, dielectric relaxation and magnetic features of the (La0.8Ca0.2)0.9Bi0.1Fe1−yTiyO3 (y = 0.0 and 0.1) nanoparticles, J. Alloys Compd., 2021, 876, 160222 CrossRef CAS.
- E. M. Benali, A. Benali, M. Bejar, E. Dhahri, M. P. F. Graca, M. A. Valente and B. F. O. Costa, Effect of synthesis route on structural, morphological, Raman, dielectric, and electric properties of La0.8Ba0.1Bi0.1FeO3, J. Mater. Sci.: Mater. Electron., 2020, 31, 3197–3214, DOI:10.1007/s10854-020-02867-0.
- E. M. Benali, A. Benali, M. Bejar, E. Dhahri, M. P. F. Graca, M. A. Valente, P. Sanguino and B. F. O. Costa, Effect of annealing temperature on structural, morphological and dielectric properties of La0.8Ba0.1Ce0.1FeO3 perovskite, J. Mater. Sci.: Mater. Electron., 2020, 31, 16220–16234 CrossRef CAS.
- M. Coskun, F. M. Coskun, Z. Durmus, M. Caglar and A. Turut, Os doped YMnO3 multiferroic: A study investigating the electrical properties through tuning the doping level, J. Alloys Compd., 2018, 752, 274–288 CrossRef.
- P. R. Ren, Z. Liu, X. Wang, Z. Duan, Y. Wan, F. Yan and G. Zhao, Dielectric and energy storage properties of SrTiO3 and SrZrO3 modified Bi0.5Na0.5TiO3–Sr0.8Bi0.1□0.1TiO3 based ceramics, J. Alloys Compd., 2018, 742, 683–689 CrossRef CAS.
- B. Jaffe, Antiferroelectric ceramics with field-enforced transitions: a new nonlinear circuit element, Proc. IRE, 1961, 49, 1264–1267 Search PubMed.
- A. Benali, B. M. G. Melo, P. R. Prezas, M. Bejar, E. Dhahri, M. A. Valente, M. P. F. Graça, B. A. Nogueira and B. F. O. Costa, Structural, morphological, Raman and ac electrical properties of the multiferroic sol–gel made Bi0.8Er0.1Ba0.1Fe0.96Cr0.02Co0.02O3 material, J. Alloys Compd., 2019, 775, 304–315 CrossRef CAS.
- A. Benali, M. Bejar, E. Dhahri, M. F. P. Graça and L. C. Costa, Electrical conductivity and ac dielectric properties of La0.8Ca0.2−xPbxFeO3 (x = 0.05, 0.10 and 0.15) perovskite compounds, J. Alloys Compd., 2015, 653, 506–512 CrossRef CAS.
- R. A. Young, The Rietveld Method, Oxford University Press, New York, 1993 Search PubMed.
- M. M. Costa, G. F. M. Pires Junior and A. S. B. Sombra, Dielectric and impedance properties' studies of the of lead doped (PbO)-Co2Y type hexaferrite (Ba2Co2Fe12O22(Co2Y)), Mater. Chem. Phys., 2010, 123, 35 CrossRef CAS.
- M. P. F. Graça, M. G. F. da Silva and M. A. Valente, NaNbO3 crystals dispersed in a B2O3 glass matrix–Structural characteristics versus electrical and dielectrical properties, Solid State Sci., 2009, 11, 570–577 CrossRef.
- E. V. Ramana, F. Figueiras, A. Mahajan, D. M. Tobaldi, B. F. O. Costa, M. P. F. Graça and M. A. Valente, Effect of Fe-doping on the structure and magnetoelectric properties of (Ba0.85Ca0.15)(Ti0.9Zr0.1)O3 synthesized by a chemical route, J. Mater. Chem. C, 2016, 4, 1066–1079 RSC.
- L. Sangaletti, L. E. Depero, B. Allieri, P. Nunziante and E. Traversa, An X-ray study of the trimetallic LaxSm1−xFeO3 orthoferrites, J. Eur. Ceram. Soc., 2001, 21, 719–726 CrossRef CAS.
- A. Benali, A. Souissi, M. Bejar, E. Dhahri, M. F. P. Graca and M. A. Valente, Dielectric properties and alternating current conductivity of sol–gel made La0.8Ca0.2FeO3 compound, Chem. Phys. Lett., 2015, 637, 7 CrossRef CAS.
- A. K. Ghosh, G. D. Dwivedi, B. Chatterjee, B. Rana, A. Barman, S. Chatterjee and H. D. Yang, Solid State Commun., 2013, 166, 22 CrossRef CAS.
- P. Kharel, S. Talebi, B. Ramachandran, A. Dixit, V. M. Naik, M. B. Sahana, C. Sudakar, R. Naik, M. S. R. Rao and G. Lawes, Structural, magnetic, and electrical studies on polycrystalline transition-metal-doped BiFeO3 thin films, J. Phys.: Condens. Matter, 2009, 21, 036001 CrossRef CAS PubMed.
- W. Y. Xing, Y. N. N. Ma, Y. L. Bai and S. F. Zhao, et al., Enhanced ferromagnetism of Er-doped BiFeO3 thin films derived from rhombohedral-to-orthorhombic phase transformations, Mater. Lett., 2015, 161, 216–219 CrossRef CAS.
- L. Peng, H. M. Deng, J. J. Tian, Q. Ren, C. Penga, Z. P. Huang, P. X. Yanga and J. H. Chu, Influence of Co doping on structural, optical and magnetic properties of BiFeO3 films deposited on quartz substrates by sol–gel method, Appl. Surf. Sci., 2013, 268, 146–150 CrossRef CAS.
- N. S. Goncalves, J. A. Carvalho, Z. M. Lima and J. M. Sasaki, Mater. Lett., 2012, 72, 36 CrossRef CAS.
- A. V. Naumkin, A. K. Vass, S. W. Gaarenstroom and C. J. Powell, NIST X-ray Photoelectron Spectroscopy Database, NIST Standard Reference Database 20, version 4.1, see https://srdata.nist.gov/xps/ Search PubMed.
- Y. Zhang, Y. Wang, J. Qi, Y. Tian, M. Sun, J. Zhang, T. Hu, M. Wei, Y. Liu and J. Yang, Enhanced Magnetic Properties of BiFeO3 Thin Films by Doping: Analysis of Structure and Morphology, Nanomaterials, 2018, 8, 711 CrossRef PubMed.
- X. Li, H. B. Zhang, X. X. Liu, S. Li and M. Zhao, XPS study on O(1s) and Fe(2p) for nanocrystalline composite oxide LaFe03 with the perovskite structure, Mater. Chem. Phys., 1994, 38, 355–362 CrossRef CAS.
- M. Kamali, M. E. V. Costa, G. Otero-Irurueta and I. Capela, Ultrasonic irradiation as a green production route for coupling crystallinity and high specific surface area in iron nanomaterials, J. Cleaner Prod., 2019, 211, 185–197 CrossRef CAS.
- R. Singh, P. K. Gupta, S. Kumar, A. G. Joshi, A. K. Ghosh, S. Patil and S. Chatterjee, Enhancement in electrical and magnetic properties with Ti-doping in Bi0.5La0.5Fe0.5Mn0.5O3, J. Appl. Phys., 2017, 121, 154101 CrossRef.
- A. R. Rajamani, S. Jothi, M. D. Kumar, S. Srikaanth, M. K. Singh, G. Otero-Irurueta, D. Ramasamy, M. Datta and M. Rangarajan, Effects of Additives on Kinetics, Morphologies and Lead-Sensing Property of Electrodeposited Bismuth Films, J. Phys. Chem. C, 2016, 120, 22398–22406 CrossRef CAS.
- F. Akram, J. Kim, S. A. Khan, A. Zeb, H. G. Yeo, Y. S. Sung, T. K. Song and M.-H. Kim, Soonil Lee Less temperature-dependent high dielectric and energy-storage properties of ecofriendly BiFeO3–BaTiO3-based ceramics, J. Alloys Compd., 2020, 818, 152878 CrossRef CAS.
- W. Ncib, A. Ben Jazia Kharrat, M. A. Wederni, N. Chniba-Boudjada, K. Khirouni and W. Boujelben, Investigation of structural, electrical and dielectric properties of sol–gel prepared La0.67−xEuxBa0.33Mn0.85Fe0.15O3 (x = 0.0, 0.1) manganites, J. Alloys Compd., 2018, 768, 249–262 CrossRef CAS.
- I. Bunget and M. Popescu, Physics of solid dielectrics, Elsevier, Amsterdam, Oxford, New York, Tokyo, 1984 Search PubMed.
- N. Kumar, A. Dutta, S. Prasad and T. P. Sinha, Dielectric relaxation of complex perovskite Sm(Ni1/2Zr1/2)O3, Physica B, 2010, 405, 4413–4417 CrossRef CAS.
- I. Coondoo, N. Panwar, R. Vidyasagar and A. L. Kholkin, Phys. Chem. Chem. Phys., 2016, 18, 31184–31201 RSC.
- P. R. Mandal, S. Sahu and T. K. Nath, Int. J. Nanosci., 2011, 10, 295 CrossRef CAS.
- S. Hcini, A. Selmi, H. Rahmouni, A. Omri and M. L. Bouazizi, Ceram. Int., 2017, 43, 2529 CrossRef CAS.
- C. Bharti and T. P. Sinha, Physica B, 2011, 406, 1827–1832 CrossRef CAS.
- S. Nasri, A. L. Ben Hafsia, M. Tabellout and M. Megdiche, RSC Adv., 2016, 6, 76659 RSC.
- A. K. Jonscher, Universal Relaxation Law, Chelsea Dielectric Press, London, 1996 Search PubMed.
- M. Dussouze, Second harmonic generation in glasses borophosphate sodium and niobium thermal polarization, thesis, University Bordeaux I, France, 2005.
- W. H. Jung, Physica B, 2001, 299, 120 CrossRef CAS.
- J. Smith and H. B. J. Wign, Ferrites, Cleaver-Hume Press, London, 1959 Search PubMed.
| This journal is © The Royal Society of Chemistry 2022 |

