DOI:
10.1039/D1RA08941B
(Paper)
RSC Adv., 2022,
12, 7720-7734
Arsenic(III) removal from aqueous solution using TiO2-loaded biochar prepared by waste Chinese traditional medicine dregs
Received
9th December 2021
, Accepted 28th February 2022
First published on 9th March 2022
Abstract
Oxidation of As(III) to As(V) is an effective way to improve the performance of most arsenic removal technologies. In this study, a new alternative biosorbent, TiO2-loaded biochar prepared by waste Chinese traditional medicine dregs (TBC) was applied in remediation for As(III) from aqueous solution. Compared with unmodified biochar, the specific surface areas and total pore volumes of TBC increased while the average aperture decreased due to the loading of nano-TiO2. The X-ray diffraction (XRD) of TBC confirmed that the precipitated titanium oxide was primarily anatase. pH did not have a significant effect on the adsorption capacity at 10 mg L−1 As(III) in suspension with a pH ranging from 2 to 10. Adsorption kinetics data were best fitted by the pseudo-second-order model (R2 > 0.999). The Sips maximum adsorption capacity was 58.456 mg g−1 at 25 °C, which is comparable with other adsorbents reported in previous literature. The Gibbs free energy (ΔG) of As(III) adsorption was negative, indicating the spontaneous nature of adsorption. The results of free radical scavenging and N2 purging experiments indicated that O2 acted as an electron accepter and O2˙− dominated the oxidation of As(III). The oxidation of As(III) obviously affected the adsorption capacity for As(III) by TBC. X-ray photoelectron spectroscopy (XPS) studies showed that As(III) and As(V) existed on the surface of TBC, suggesting that the oxidation of As(III) occurred. TBC played multiple roles for As(III), including direct adsorption and photocatalytic oxidation adsorption. Regeneration and stability experiments showed that TBC was an environment-friendly and efficient adsorbent for As(III) removal.
1. Introduction
Arsenic (As) is a known toxic element whose compounds can cause acute and chronic arsenic poisoning, such as skin cancer, lung cancer and other diseases.1 Elemental arsenic has been widely studied for a long time due to its biological toxicity and carcinogenic effect.2 Arsenic in the environment mainly comes from (1) natural factors such as volcanic eruptions and rock weathering and (2) human activities such as industrial and agricultural activities, especially arsenic-containing wastewater from industrial production.3,4 In nature, arsenic occurs in the +5, +3, 0, and −3 states, which are mainly in the form of sulfide and oxide.5 Oxidation states +3 and +5 commonly exist in water environments, depending on redox potential formation, but states −3 and 0 are very rare.6 As(III) is more toxic and migratory than As(V).5,7 As(III) exists in the form of H3AsO3, H2AsO3−, HAsO32− and AsO33− under reducing conditions, whereas As(V) is found in the forms of H3AsO4, H2AsO4−, HAsO42− and AsO43− under oxidizing conditions.6
Due to the high toxicity of arsenic, As contamination is considered a recognized global environmental problem.8 To minimize the biological toxicity of arsenic to human health, environmental restrictions and regulations strictly control the production and use of arsenic and its compounds. Arsenic is listed as a pollutant of priority concern by the European Union (EU) and the Environmental Protection Agency in the United States of America (US EPA).9 The maximum permissible limit of inorganic arsenic in safe drinking water is 10 μg L−1 according to the World Health Organization (WTO).1,2,5,8,9 US EPA stipulates that the arsenic emission standard of wastewater is 0.2 mg L−1.5 Technologies of arsenic removal from aqueous solution have been widely studied. At present, the main methods of arsenic-contaminated water remediation include coagulation, ion exchange, membrane separation techniques, adsorption, sulfate-reducing bacteria (SBR) and oxidation.1,3,5,6,9 However, these methods have many disadvantages, such as limitation of removal efficiency, environmental unfriendliness or high cost.5,10 Adsorption is an efficient water purification technology, with advantages such as simple operation, cost-effectiveness, minimal sludge production and regeneration.10,11 Conventional adsorbents include activated carbon (AC), activated alumina and iron-oxide-based adsorbents.4,10–12 However, the deficiencies of these adsorbents limit a wide range of their applications in arsenic removal from aqueous solution, such as particle agglomeration, weak adsorption capacity, mechanical strength and flow limits.5,13
Biochar is a carbonaceous and stable product, which is prepared under anaerobic (or oxygen-limited) conditions and low temperatures.10,12,13 Biochar can be easily produced by solid waste materials from forestry wastes, agricultural wastes, organic wastes from urban life, industrial wastes and other organic wastes, which are abundant, inexpensive or freely available.1,5,10,11,14 Due to its large surface area, porosity and chemical functionality, biochar can be used to adsorb toxic heavy metals.1,5,11,14,15 In addition, it can also be used as a support material for small particles of other adsorbents to prevent the agglomeration of particles.5,13 Compared with AC, biochar is promising in removing heavy metals from water, but its ability to remove heavy metal pollutants is lower.15 To promote its ability to remove heavy metals, biochar is loaded with minerals to improve their surface area, porosity, pH, point of zero charge (PZC) and/or functional groups, including nanoparticles, organic functional groups, reluctance and activation with alkaline solution.15,16 Compared with unmodified biochar, modified biochar is increasingly considered for the treatment of As contaminated water.10,12,15,16 However, further biochar optimization and economic feasibility analysis are needed before its widespread application.15 Therefore, cheap and easily available raw materials for biochar production, simple and operable modification methods are essential in the future. Traditional Chinese medicine dregs are the waste discharged from natural plants after the extraction of medical active components. In China, 30 million tons of Chinese medicine dregs are produced annually.17 These wastes which are abundant in cellulose, hemicellulose and lignin, are ideal raw materials for biochar. The prepared biochar can be used for the treatment of heavy metal wastewater. In addition, this can greatly reduce solid waste pollution from traditional Chinese medicine production enterprises.
As(III) which is more toxic and mobile than As(V) has a low affinity for mineral surfaces, while As(V) adsorbs easily onto solid adsorbent surfaces.15 The oxidation of As(III) to less toxic As(V) is effective to improve the capacity of arsenic removal.4,18 The air oxidation of As(III) is a slow process, which will take weeks. Recent studies have shown that TiO2 has been widely used in the arsenic remediation and photocatalytic oxidation of As(III).18–21 However, the separation problem of TiO2 powder from water and the expensive cost of commercial TiO2 powder due to complex synthesis methods limit its application in arsenic removal.18,20 To overcome these problems, in this study biochar prepared from waste Chinese traditional medicine dregs were used as a support material for TiO2 particles loaded onto biochar with a simple and moderate process by the sol–gel method, as shown in Scheme 1. In addition, this study also evaluated the adsorption performance of As(III) removal, and revealed the possible mechanism of simultaneously photocatalytic oxidation and As(III) removal by TBC. The present work will provide a choice for As(III) removal by adsorbents with efficiency, low cost and easy separation from aqueous solution.
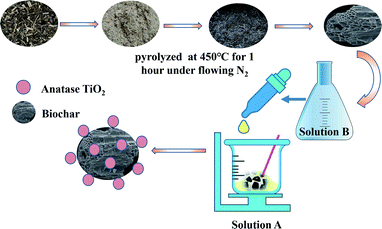 |
| | Scheme 1 The synthesis process of TBC. | |
2. Experimental section
2.1 Reagents and materials
L (+)-Ascorbic acid (C6H8O6) (Kermel), potassium tetrahydroborate (KBH4) (Kermel) and hydrochloric acid (Chuandong Chemical) were used as superior pure reagents. Other chemicals were analytical reagent. Sodium arsenite (NaAsO2, Aike reagent) was used as the arsenic resource. Butyl titanate (Ti(OC4H9)4), anhydrous ethanol, t-butyl alcohol (TBA), sodium hydroxide (NaOH) and potassium hydroxide (KOH) were purchased from Sinopharm Chemical Reagent Co., Ltd. Superoxide dismutase (SOD) (Hefei BASF Technology Co., Ltd.) was added to the biochar suspension to scavenge superoxide anions and hydroxyl radicals. t-Butanol was used as a hydroxyl radical scavenger. Deionized water (18.2 Mῼ cm−1, Milli-Q) was used in this study. Stock solutions of As(III) were prepared by dissolving NaAsO2 in deionized water solution.
2.2 Preparation of modified biochar
Biochar (BC) was prepared by waste Chinese traditional medicine dregs from the manufacture of an anticancer injection produced by Yibai Pharmaceutical Co., Ltd. The dregs mainly included a certain proportion of Acanthopanax senticosus, ginseng and Astragalus. The materials were washed twice with tap water, then washed with deionized water and dried in a drying oven (101-2AB, Taisite) at 80 °C for 48 h. The dried dregs were crushed to less than 2 mm. Then, the biomass powder (80.00 g) was pyrolyzed in a tube furnace (SG-GL1200, Siom) under flowing N2 at an increasing rate of 10 °C min−1. The tube furnace was held at a target temperature of 450 °C for 1 hour. The biochar powder was cooled at room temperature, ground and sifted in 100 mesh.
TBC was synthesized at room temperature by a modified sol–gel method as reported previously.20 In brief, a certain amount of anhydrous ethanol, butyl titanate and concentrated hydrochloric acid were fully mixed and stirred at a certain rotating speed. Then, 3.00 g BC was added to the mixture as solution A, which was stirred at a certain rotating speed. A certain amount of anhydrous ethanol and deionized water were mixed completely as solution B. After solution A was stirred for 30 min, solution B was added dropwise into solution A. The mixture continued to be stirred slowly until the solution formed a gel. After aging at room temperature for 24 hours without light, the gel was placed in an oven at 60 °C and dried for 24 hours. After passing through a 100 mesh sieve, TBC was kept for reserve.
2.3 Adsorption experiments
The effect of the initial solution pH on the adsorption capacity at a pH range from 2 to 10 (at intervals of 2 pH units) was carried out at 25 °C. pH adjustment was accomplished by using of 1 M, 0.1 M and 0.01 M HCl and NaOH solutions. After shaking for 24 hours, the suspension was filtered, and the final pH values were recorded by a pH metre (PHS-3C, INESA, China). For adsorption kinetics experiments, initial concentrations of As(III) were 10, 20, 40 and 80 mg L−1 at 25 °C. At each sampling time (5, 10, 20, 40, 60, 120, 240, 480, 720, 1440 and 2880 min), the suspension was immediately filtered through 0.45 μm pore size membrane filters. In isothermal equilibrium experiments, the effect of the initial concentration of As(III) was studied for 24 hours by varying concentrations from 5 to 200 mg L−1 at 15 °C, 25 °C and 35 °C. All experiments were carried out with a biochar-weight-to-solution-volume ratio of 2 mg mL−1.
To understand the photocatalytic removal mechanism of As(III) onto TBC, two radical scavengers (SOD and TBA) were used to ensure that the major radical was responsible for As(III) removal and oxidation. The present investigation aimed to provide evidence for the mechanism of the oxidation and removal of trivalent arsenic from aqueous solution by TBC. SOD (superoxide dismutase) catalyses the dismutation of superoxide radicals to hydrogen peroxide and reacts with hydroxyl radicals.21 t-Butanol alcohol (TBA) can selectively quench hydroxyl radicals. The contents of total As and As(III) were analysed by atomic fluorescence spectrophotometry (AFS) (Haiguang, 8501).
2.4 Apparatus and measurements
The point of zero charge (PZC) of TBC and BC was examined using a zeta potential distribution/nanoparticle size analyser (DelsaNanoC particle analyser, USA) by the pH drift method. The surface areas of BC and TBC were examined by a 3H-2000PS4 (BSD, China) surface area analyser using BET N2 adsorption–desorption isotherms. Scanning electron microscopy/energy-dispersive X-ray (SEM-EDX) was carried out to examine BC and TBC surface architectures by Hitachi SU8010 (Japan) scanning electron microscopy (SEM). Transmission electron microscopy (TEM) study was undertaken using a TEM JEOL JEM-2100. Fourier transform infrared (FT-IR) spectra was recorded using a spectrometer (FTIR-850 spectrometer, China). X-ray photoelectron spectroscopy (XPS) analysis was performed using a Thermo Fisher K-Alpha XPS system. The composition and crystal structure of the adsorbates were analysed with X-ray diffraction (Bruker D8 Advance, Germany). The test method of As(III) was carried out according to “speciation of trivalent arsenic and pentavalent arsenic in seawater by atomic fluorescence spectroscopy”.22 The content of titanium in aqueous solution was detected by inductively coupled plasma mass spectrometer (ICP-MS) (Thermo Fisher, XII).
3. Results and discussions
3.1 Biochar elemental analysis, surface areas and morphologies
As shown in Fig. 1(a) and (b), scanning electron micrograph results exhibited that the surfaces of BC and TBC were full of rough and clear pores. After modification, it can be seen in Fig. 1(c) and (d) that a large number of TiO2 particles were loosely arranged on the surface of biochar fragments. Compared with BC, EDS data proved a decrease in surface carbon content and an increase in oxygen and titanium content in TBC due to TiO2 covering portions of BC's carbonaceous surface (Fig. 2 and Table 1). Data of BET N2 adsorption and desorption isotherms for BC and TBC were shown in Fig. 3. The surface areas of BC and TBC were 4.5888 m2 g−1 and 128.2171 m2 g−1, respectively. The total pore volumes of BC and TBC were 0.0235 mL g−1 and 0.0859 mL g−1, respectively. The average apertures of BC and TBC were 20.4847 nm and 2.6798 nm, respectively. It was proven that nano-TiO2 particles were successfully loaded onto BC. The specific surface area and total pore volumes of TBC increased while the average aperture decreased due to the loading of nano-TiO2 onto BC. Fig. 1(n), Fig. 2(c) and Table 1 showed SEM-EDX elemental maps of arsenic adsorbed onto TBC, which proved the presence of As.
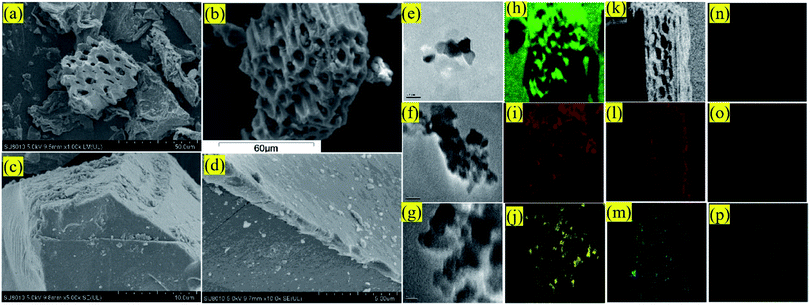 |
| | Fig. 1 SEM micrograph of BC (a) and TBC (b–d); TEM microscopy images of BC (e) and TBC (f and g); SEM-EDS elemental mapping image of C (h), O (i) and Ti (j) in TBC; SEM-EDS elemental mapping image of C (k), O (l), Ti (m), As (n), Ca (o) and Mg (p) in TBC loaded As. | |
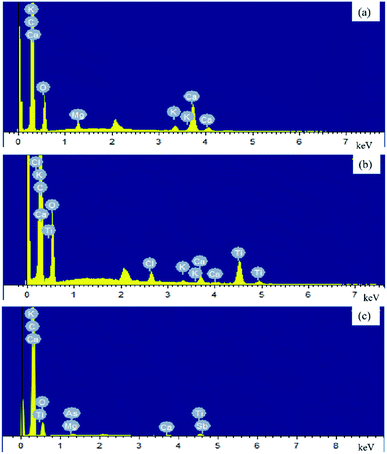 |
| | Fig. 2 EDS elemental mapping images of BC (a), TBC (b) and TBC loaded by As (c). | |
Table 1 Data of element contend in BC and TBC by EDS
| Element |
C |
O |
K |
Mg |
Ca |
Cl |
Ti |
As |
Total |
| BC |
87.74 |
11.83 |
0.07 |
0.07 |
0.29 |
|
|
|
100 (atomic%) |
| TBC |
84.67 |
13.70 |
0.07 |
|
0.13 |
0.30 |
1.13 |
|
100 (atomic%) |
| TBC loaded by As |
84.08 |
15.20 |
0.02 |
0.03 |
0.09 |
|
0.49 |
0.08 |
100 (atomic%) |
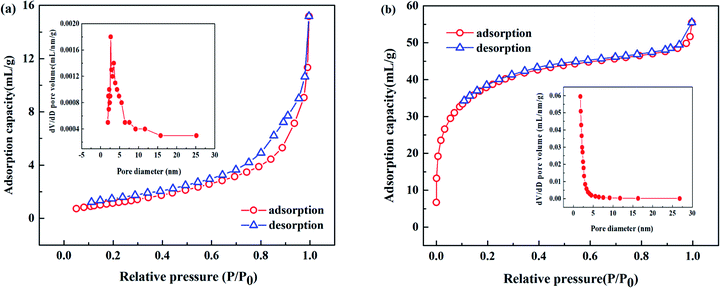 |
| | Fig. 3 N2 adsorption and de-sorption isotherms showing the mesoporous structure of BC (a) and TBC (b). | |
The XRD spectrums of BC showed that the fine and sharper peaks appeared at 2θ values of nearby 20–30°, indicating the formation of aromatic carbon compounds in the biochar materials and an additional amorphous phase coexisted with the crystalline phase (Fig. 4).23 Peaks of calcium carbonate were observed in BC. Unmodified biochar exhibited a crystallized peak at 26.64° (quartz), indicating that BC contained some SiO2. The XRD of TBC confirmed that the precipitated titanium oxide was primarily anatase (TiO2). The major peak at 2θ = 25.303° was for the crystalline plane with Miller indices of (101). Other low-intensity peaks were observed at 37.792° (004), 49.035° (200) and 53.753° (105), matching the standard diffraction patterns of TiO2. The broadening of the anatase (TiO2) peaks suggested that anatase (TiO2) onto TBC were poorly crystalline domains due to the composite TBC prepared at low temperature. After modification, peaks at 2θ values of nearby 20–30° were submerged, the quartz peaks became relatively diminished. The peaks of calcium carbonate disappeared. The reason may be that the peaks of calcium carbonate were masked by the peaks of the anatase (TiO2) or calcium carbonate was dissolved in the synthesis of modified biochar. These results revealed successful impregnation of BC with TiO2. The points of zero charge of BC and TBC are ∼2.30 and ∼4.40, respectively (Fig. 5).
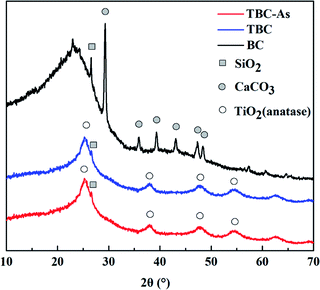 |
| | Fig. 4 XRD patterns of BC and TBC before or after As(III) adsorption. | |
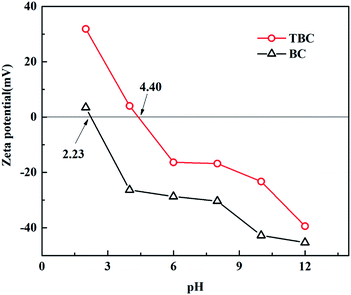 |
| | Fig. 5 Zeta potential plot for BC and TBC. | |
3.2 Effect of solution initial pH on As(III) adsorption capacity
H3AsO3 and H2AsO3− were dominant species in solution at pH values ranging from 2 to 10.5 The influence of initial pH on the As(III) adsorption capacity of BC and TBC was researched at pH values ranging from 2 to 10. The result was shown in Fig. 6. For BC, the adsorption capacity of arsenic was poor, ranging from 0.068 mg g−1 to 0.408 mg g−1 at an initial concentration of 10 mg L−1 As(III). It can be seen in Fig. 6(a) that BC had a buffering effect on solution pH. For TBC, the initial pH had little effect on the adsorption capacity of As(III), which ranged from 4.778 mg g−1 to 4.901 mg g−1. It was worth noting that the pH values of the suspensions decreased significantly after adsorption due to TiO2 loaded onto BC. Previous studies reported that pH had little influence on the effect of TiO2 photocatalytic oxidation (PCO) and the adsorption capacity of As(III).24 For TiO2 particles, its surface is positively charged at pH < pHPZC (eqn (1)), whereas at pH > pHPZC, the TiO2 surface is negatively charged (eqn (2)).24 Other studies also proposed the complexation reaction (eqn (3)) between TiO2 surface and H3AsO3.25 In addition, holes produced by TiO2 under the excitation of visible light can react with H2O to release hydrogen ions.26| | |
Ti–OH + H+ → Ti–O− + 2H+
| (1) |
| | |
Ti–OH + OH− → Ti–O− + H2O
| (2) |
| |
H3AsO3 + 2(![[double bond splayed left]](https://www.rsc.org/images/entities/char_e009.gif) TiOH) → ( TiOH) → (![[double bond splayed left]](https://www.rsc.org/images/entities/char_e009.gif) TiO)2AsO− + 2H2O + H+ TiO)2AsO− + 2H2O + H+
| (3) |
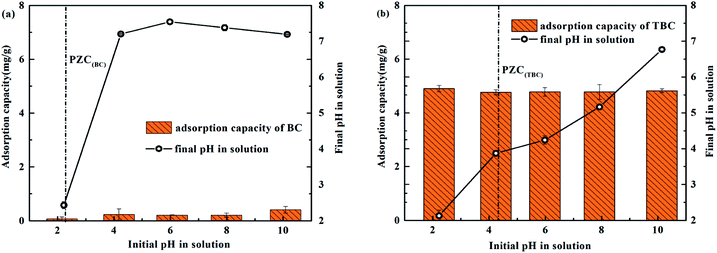 |
| | Fig. 6 Effect of initial solution pH on the adsorption capacity for As(III) removal by BC (a) or TBC (b) at As(III) initial concentration of 10 mg L−1. | |
3.3 Adsorption kinetics
The relationship between the adsorption capacity and equilibrium time was plotted at initial concentrations of 10, 20, 40 and 80 mg L−1 in Fig. 7(a). At the beginning of the reaction, the adsorption capacity (qt) increased quickly with increasing adsorption time due to a large number of active sites and large concentration gradients.27 As the concentration gradient and adsorption activity centrality gradually decreased, the degree of increase in adsorption capacity gradually decreased with increasing adsorption capacity until equilibrium. When the initial concentration of As(III) increased from 10 mg L−1 to 80 mg L−1, the adsorption capacity increased, while the removal percentage decreased (Fig. 7(b)). The average maximum removal percentages at initial concentrations of 10, 20, 40 and 80 mg L−1 were 98.62%, 94.56%, 89.79% and 82.56%, respectively. The reason would be attributed to the gradual reduction and saturation of available binding sites at modified biochar.20
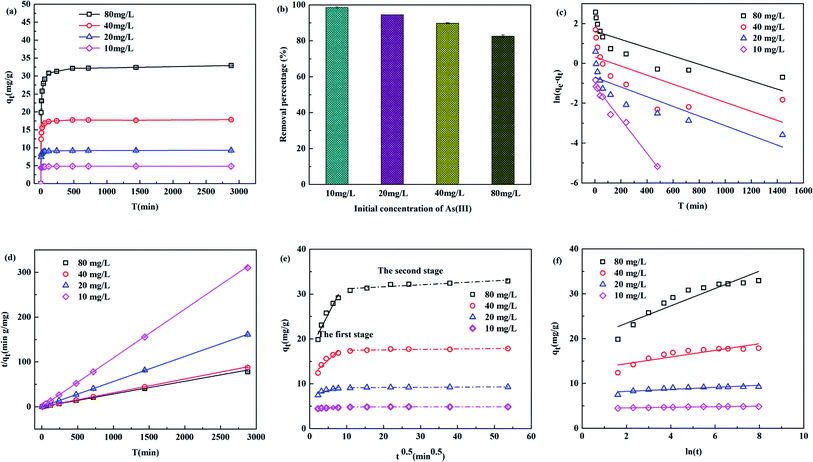 |
| | Fig. 7 Adsorption capacity vs. time with initial As(III) concentrations of 10, 20, 40 and 80 mg L−1 at 25 °C (a), removal percentage of arsenic onto TBC (b), pseudo-first-order model fitting (c), pseudo-second-order model fitting (d), intra-particle diffusion fitting (e), Elovich mode fitting (f). | |
To further explore the adsorption behaviour of arsenic on TBC, kinetics data at As(III) levels of 10, 20, 40 and 80 mg L−1 were simulated with the pseudo-first-order (PFO), pseudo-second-order (PSO), intra-particle diffusion (IPD) and Elovich (ELH) kinetic models. Linearized forms of aforementioned models have been presented in eqn (4)–(7).1,5,27,28
| |
ln(qe − qt) = ln![[thin space (1/6-em)]](https://www.rsc.org/images/entities/char_2009.gif) qe − k1t qe − k1t
| (4) |
| |
 | (5) |
| |
 | (7) |
In
eqn (4)–(7),
t (min) is the contact reaction time;
qt (mg g
−1) is the adsorption capacity at different contact reaction times (
t, min);
qe,exp (mg g
−1) is the absorption capacity at adsorption equilibrium in experiments;
qe,cal (mg g
−1) is the absorption capacity calculated according to the model;
k1 (min
−1) is the PFO rate constant, and
k2 (g mg
−1 min) is the PSO rate constant;
α (mg g
−1 min
−1) is the initial adsorption rate,
β (g mg
−1) is the Elovich constant. Parameters (
kdif and
C) of the IPD model are estimated from the slope and intercept of
qt vs. t0.5. Parameters in the ELH model (
α and
β) were obtained from the slope (1/
β) and intercept 1/
β![[thin space (1/6-em)]](https://www.rsc.org/images/entities/char_2009.gif)
ln(
αβ) of the curve
qt vs. ln(
t). In general, the Elovich kinetic model has been usually used for describing the adsorption kinetic of contaminants on the surface of a non-uniform solid adsorbent.
28
The calculated parameters were shown in Table 2. The adsorption kinetics were closer to the PSO model due to higher correlation coefficients of above 0.99 at all concentrations than to the PFO model, suggesting that the adsorption capacity was controlled by the number of available active sites on TBC.27 A comparatively high As(III) uptake rate (k2) decreases with the increases of initial As(III) concentration. The qe,cal values of the PSO model at 10, 20, 40 and 80 mg L−1 were 4.748, 9.194, 17.844 and 35.224 mg g−1 respectively, which perfectly coincided with the experimental data (4.869, 9.284, 17.851 and 32.924 mg g−1). The results indicated that the adsorption process of As(III) onto TBC was dominated by chemical adsorption, because the PSO model was considered that the adsorption rate was controlled by the chemical adsorption between the adsorbate and the adsorbent.18 According to the IPD model, two distinct stages of adsorption were clearly observed in Fig. 7(e). At the beginning of the adsorption process, the adsorption capacity increased rapidly with contact reaction time, then increased slowly, and the adsorption finally reached equilibrium. The first stage showed a good linear relationship between qt vs. t0.5, corresponding to the diffusion of As to the outer surface of TBC through external diffusion. The second stage showed that As entered through intragranular diffusion and was adsorbed inside the pore size, and the adsorption rate at this stage was controlled by diffusion in the particles. The fitting curve did not pass through the origin, indicating that the diffusion process in particles was not the only control step of the adsorption process.28 Compared with the second stage, the first stage had a larger slope, indicating a faster surface diffusion rate.27,28 The second stage adsorption was related to the thickness of the boundary layer.28 There was a larger intercept in the second stage, implying that the intra-particle diffusion played an important role in the rate-limiting step.27,28 The sequence of the suitability of kinetic models based on the value of R2 was PSO > ELH > PFO > IPD.
Table 2 Kinetic models constants for the adsorption of As(III) by TBC
| Model |
Parameters |
Initial concentration |
| 10 mg L−1 |
20 mg L−1 |
40 mg L−1 |
80 mg L−1 |
| Pseudo-first-order |
k1 (min−1) |
0.0084 |
0.0024 |
0.0022 |
0.0020 |
| qe,cal (mg g−1) |
0.318 |
0.493 |
1.354 |
4.921 |
| R2 |
0.970 |
0.684 |
0.412 |
0.640 |
| Pseudo-second-order |
k2 (g mg−1 min−1) |
0.2106 |
0.1088 |
0.0560 |
0.0284 |
| qe,cal (mg g−1) |
4.748 |
9.194 |
17.844 |
35.224 |
| R2 |
0.999 |
0.999 |
0.999 |
0.999 |
| Intra-particle diffusion |
The first stage |
C |
4.386 |
7.299 |
11.465 |
17.446 |
| kdif |
0.0417 |
0.2413 |
0.7619 |
1.6106 |
| R2 |
0.852 |
0.746 |
0.879 |
0.913 |
| The second stage |
C |
4.809 |
9.083 |
17.367 |
30.741 |
| kdif |
0.0011 |
0.0042 |
0.0097 |
0.0444 |
| R2 |
0.16976 |
0.76361 |
0.52759 |
0.79514 |
| Elovich |
α (mg g−1 min) |
1.91 × 1027 |
1.74 × 10¹⁴ |
27![[thin space (1/6-em)]](https://www.rsc.org/images/entities/char_2009.gif) 431 431![[thin space (1/6-em)]](https://www.rsc.org/images/entities/char_2009.gif) 655.17 655.17 |
47![[thin space (1/6-em)]](https://www.rsc.org/images/entities/char_2009.gif) 037.86 037.86 |
| β (g mg−1) |
14.890 |
4.411 |
1.349 |
0.516 |
| R2 |
0.874 |
0.704 |
0.7405 |
0.852 |
3.4 Adsorption isotherms
To further understand the adsorption mechanism and the maximum capacity of As(III) removal by TBC, adsorption isotherm data were obtained at 15 °C, 25 °C and 35 °C. The data were fitted by the Langmuir (eqn (8)), Freundlich (eqn (9)) and Sips models (eqn (10)), respectively.1,5,28–30| |
 | (8) |
| |
 | (9) |
| |
 | (10) |
In eqn (8)–(10), ce is the equilibrium concentration (mg L−1); qe is the adsorption capacity (mg g−1), and qm is the maximum adsorption capacity (mg g−1). Here, KL, KF and KS are the constants of the Langmuir, Freundlich and Sips models, respectively. In the Freundlich and Sips models, n is the adsorption intensity. The Freundlich model is suitable for low initial concentrations, while the Langmuir model is suitable for high adsorbate concentrations. To avoid the limitation of two parameter models, the three parameter Sips model is also applied. At low As(III) concentrations, the Sips model is simplified to the Freundlich isotherm. At high concentrations, it predicts the monolayer adsorption capacity characteristics of the Langmuir model.5
The fitting data were listed in Table 3. As shown in Fig. 8, the experimental data were well fitted to three isotherm models with R2 (>0.90). The absorption procedure of TBC for As(III) can be better described by the Langmuir isotherm model than the Freundlich isotherm model. The favourability of adsorption can be characterized with a dimensionless constant (RL) of the Langmuir isotherm defined with eqn (11).5,29,30
| |
 | (11) |
where
c0 is the initial concentration (mg L
−1). In this study, the value of
RL was in the range of 0.046 to 0.341, indicating the favourable adsorption of As(
III) onto TBC at 15 °C, 25 °C and 35 °C.
29 Freundlich's intensity factor
nF in the Freundlich isotherm was also used to evaluate the favourability of As(
III) onto TBC, representing the intensity of the adsorption process. In this study,
nF was calculated to be 3.361, 3.643 and 3.520 at 15 °C, 25 °C and 35 °C, respectively, indicating the favourable adsorption of As(
III) onto TBC.
29 The best fit isotherm was selected by its goodness of fit, correlation coefficient (
R2) and chi-square (
χ2) value of fitting to experimental data. The results showed that the best correlation coefficient and chi-square values were obtained by the Sips model. The results suggested that the adsorption process was controlled by diffusion at low As(
III) concentration, while the adsorption was monolayer adsorption at As(
III) concentration and had a saturation value.
Table 3 Isotherms parameters for As(III) adsorption onto TBC (15 °C, 25 °C and 35 °C)
| Model |
Parameters |
Temperature |
| 15 °C |
25 °C |
35 °C |
| Freundlich |
KF (mg g−1) |
13.081 |
15.630 |
15.934 |
| n |
3.361 |
3.643 |
3.520 |
| R2 |
0.9396 |
0.9396 |
0.9016 |
| Chi-square values (χ2) |
14.973 |
19.311 |
34.977 |
| Langmuir |
qm (mg g−1) |
43.642 |
49.191 |
53.539 |
| KL (L mg−1) |
0.1933 |
0.2612 |
0.2076 |
| R2 |
0.9435 |
0.9713 |
0.9731 |
| Chi-square values (χ2) |
14.024 |
9.167 |
9.570 |
| Sips |
qS (mg g−1) |
57.963 |
58.456 |
57.453 |
| KS (L mg−1) |
0.0768 |
0.1523 |
0.1742 |
| n |
1.756 |
1.505 |
1.221 |
| R2 |
0.968 |
0.986 |
0.974 |
| Chi-square values (χ2) |
6.644 |
7.328 |
7.463 |
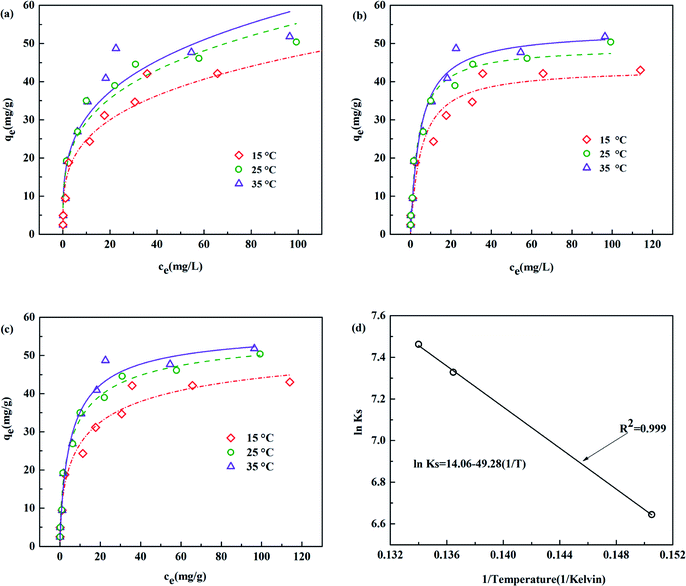 |
| | Fig. 8 Fits to (a) Langmuir, (b) Freundlich and (c) Sips model of arsenic adsorption onto TBC at 15, 25 or 35 °C, (d) van't Hoff plot of ln![[thin space (1/6-em)]](https://www.rsc.org/images/entities/char_2009.gif) KS vs. 1/T for the As(III) adsorption onto TBC from 15 to 35 °C. KS vs. 1/T for the As(III) adsorption onto TBC from 15 to 35 °C. | |
3.5 Adsorption thermodynamics
From Fig. 8 and Table 3, the experimental data proved that the adsorption reaction temperature influenced the As(III) adsorption equilibrium and capacity. The adsorption capacity (qe,exp) significantly increased from 45.526 mg g−1 to 50.394 mg g−1 with increasing adsorption reaction temperature from 15 °C to 25 °C. At higher temperatures (35 °C), it was slightly higher than that at 25 °C. The results indicated that the adsorption capacity increased as the temperature increased. The Sips adsorption capacity (qS) for As(III) onto TBC increased from 15 to 25 °C (57.963 to 58.456 mg g−1), while it slightly dropped to 35 °C (57.453 mg g−1). The Langmuir model capacity (qm) increased from 43.642 to 53.539 mg g−1 with increasing temperature from 15 to 35 °C, also indicating increasing capacity as temperature rose.
The changes in Gibbs free energy (ΔG), enthalpy (ΔH) and entropy (ΔS) were calculated using van't Hoff's equations, as shown in Table 4. The consistently negative values of ΔG over the temperature range from 288 to 308 K indicated that the adsorption process of TBC for As(III) was spontaneous. A continuous drop in ΔG with temperature from 288 K to 308 K implied that the adsorption capacity increased with increasing temperature. Meanwhile, the value of ΔH was positive. This meaned that the adsorption process of As(III) onto TBC was an endothermic reaction, and an increase in temperature was conducive to the reaction. This supported the influence of temperature on the adsorption properties. The Sips maximum adsorption capacity of 58.456 mg L−1 at 25 °C is much higher than that of other adsorbents reported in previous literature, as shown in Table 5. Table 5 listed a summary of some studies on the adsorption performance of adsorbents for As(III).
Table 4 Thermodynamic parameters for the adsorption of As(III) by TBC from 15 °C to 35 °C
| Temperature |
KS (L mg−1) |
KS/104 |
ln![[thin space (1/6-em)]](https://www.rsc.org/images/entities/char_2009.gif) KS KS |
ΔG (kJ mol−1) |
ΔH (kJ mol−1) |
ΔS (kJ mol−1 K−1) |
| 15 °C |
0.0768 |
768 |
6.644 |
−15.91 |
0.41 |
0.075 |
| 25 °C |
0.1523 |
1523 |
7.328 |
−18.16 |
|
|
| 35 °C |
0.1742 |
1742 |
7.463 |
−19.11 |
|
|
Table 5 Studies of As(III) removal by other sorbents
| Sorbent |
pH |
Model |
Maximum capacity (mg g−1) |
Reference |
| TiO2-loaded biochar prepared by waste Chinese traditional medicine dregs (TBC) |
|
Sips |
58.456 |
This study |
| Sesbania bispinosa biochar (SBC) |
4 |
Langmuir |
7.33 |
1 |
| SBC/CuO |
12.47 |
| SBC/Mn |
7.34 |
| Magnetic Fe3O4/Douglas fir biochar composites (MBC) |
7 |
Sips |
5.49 |
5 |
| TB800 (biochar synthesized at 800 °C using Tectona speciosa) |
7 |
Langmuir |
0.667 |
23 |
| LB800 (biochar synthesized at 800 °C using Lagerstroemia speciosa) |
0.454 |
| Raw pine cone (PC) biochar modified by Zn (NO3)2 |
4 |
Langmuir |
0.007 |
30 |
| Empty fruit bunch biochar (EFBB) |
8 |
Langmuir |
18.9 |
31 |
| A rice husk biochar (RHB) |
19.3 |
| EFBB coated by Fe(III) |
31.4 |
| RHB coated by Fe(III) |
30.7 |
| BC Fe(III)–SB (sugarcane bagasse) |
4 |
Langmuir |
20 |
32 |
| BC Fe(III)–CH (corncob husk) |
50 |
| Magnetic biochar-microbe biochemical composite synthesized by Bacillus sp. K1 loaded onto Fe3O4 biochar (MBB) |
|
Langmuir |
4.58 |
33 |
| Fe–Mn–La-impregnated biochar composites (FMLBCs) |
7.0 |
Langmuir |
15.34 |
34 |
| Amino-modified nanocellulose impregnated with iron oxide |
6.0 |
Langmuir |
23.6 |
35 |
| rGO–Fe3O4–TiO2 |
7 |
Langmuir |
147.1 |
36 |
| Fe3O4@ZIF-8 synthesized from Fe3O4 and 2-methylimidazole |
8 |
Langmuir |
100 |
37 |
| Cubic ZIFs (zeolitic imidazolate frameworks) |
8.5 |
Langmuir |
122.6 |
38 |
| Leaf-shaped ZIFs |
108.1 |
| Dodecahedral ZIFs |
117.5 |
| Iron oxide nanoneedle array-decorated biochar fibers (Fe-NN/BFs) |
7 |
Langmuir |
70.22 |
39 |
3.6 Reusability and stability
Generally, a high recycling performance and low-cost regeneration solution for adsorbents is required. In this study, 0.1 mol NaOH, 0.1 mol HCl, 0.1 mol EDTA and H2O were employed to evaluate the reusability of As(III) removal by TBC. There was no significant difference in the effects of the four regeneration solutions. As shown in Fig. 9(a), the adsorption capacity decreased slightly after 5 cycles, from 9.274, 9.306, 9.305 and 9.274 mg g−1 to 6.422, 5.649, 6.755 and 6.145 mg g−1 with 0.1 mol NaOH, 0.1 mol HCl, 0.1 mol EDTA and H2O, respectively. The sequence of the recycling performance was 0.1 mol EDTA > 0.1 mol NaOH > H2O > 0.1 mol HCl. Overall, TBC is a cost-effective adsorbent with good reproducibility and reusability.
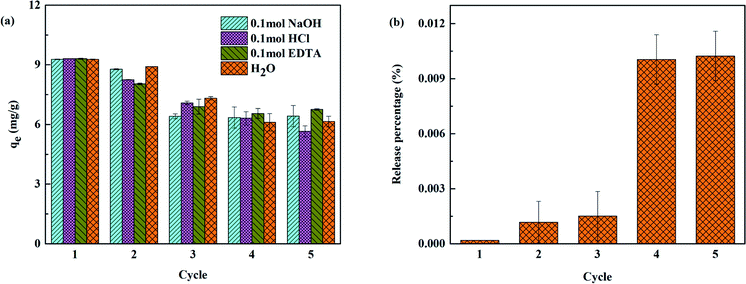 |
| | Fig. 9 (a) Reusability of TBC in arsenic adsorption with initial As(III) concentration of 20 mg L−1 and (b) stability of TBC. | |
In order to consider the stability of TBC, the release of titanium from TBC into the solution was also detected. The solution with the ratio of modified biochar weight to deionized water volume of 2 mg mL−1 was shaken for 24 hours at 25 °C, then the solution was filtered to detect the content of titanium. The shaking experiment was carried out five cycles. The experimental result was shown in Fig. 9(b). After five adsorption cycles, the release rate of titanium was only 0.011%. It suggested that the titanium release rate of TBC was low and had little impact on the environment, indicating that TBC had good stability and was a friendly adsorbent.
3.7 Adsorption mechanism
3.7.1 FT-IR. FT-IR spectra of BC and TBC were shown in Fig. 10. The functional groups in biochar clearly changed after loading with TiO2. Peaks at 3402–3432 cm−1 corresponded to the symmetric and asymmetric O–H vibrations of water molecules.40 The hydroxyl groups were observed with a maximum peak at 3432 cm−1 in BC. After activated by TiO2, peaks at 570 cm−1 corresponding to Ti–O or Ti–O–Ti stretching vibrations and peaks at 1620 cm−1 corresponding to Ti–OH vibrations appeared.40–42 The hydroxyl groups experienced a redshift from 3432 cm−1 to 3409 cm−1 in TBC. Following arsenic adsorption, the hydroxyl groups in TBC once again experienced a redshift from 3409 to 3402 cm−1, and the peak ascribing to the Ti–OH vibration shifted from 1620 to 1612 cm−1. The peak at 1057 cm−1 was attributed to –OH deformation vibrations.23 The peak at 1057 cm−1 was present on BC and TBC but disappeared after As was loaded onto TBC, and in the case of TBC a new peak appeared at 771 cm−1, corresponding to As–O stretching vibration. The adsorption band between 650 cm−1 and 950 cm−1 corresponding to As(V)–O stretching vibrations was reported in previous literature.43 The peak at 1589 cm−1 in BC could be ascribed to the C![[double bond, length as m-dash]](https://www.rsc.org/images/entities/char_e001.gif) O asymmetric stretching of ketones, aldehydes, lactones or carboxyl groups.32,44,45 The peak at 2900 cm−1 was the C–H stretching vibration or CH2 group.46,47 The peaks between 1427 cm−1 and 1440 cm−1 represented the presence of aromatic rings or rings with C
O asymmetric stretching of ketones, aldehydes, lactones or carboxyl groups.32,44,45 The peak at 2900 cm−1 was the C–H stretching vibration or CH2 group.46,47 The peaks between 1427 cm−1 and 1440 cm−1 represented the presence of aromatic rings or rings with C![[double bond, length as m-dash]](https://www.rsc.org/images/entities/char_e001.gif) C bonds.23
C bonds.23
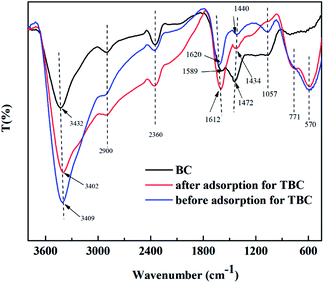 |
| | Fig. 10 The FTIR spectra of BC and TBC before or after arsenic adsorption. | |
3.7.2 The role of TiO2 modification in TBC on the adsorption and oxidation of As(III). TiO2 nanomaterials are widely used in arsenic remediation. However, its adsorption and photocatalytic capacity have been controversial.19,48 To further explore the mechanism of As(III) removal by TBC, two radical scavengers (SOD and TBA) were used to reveal the major radicals responsible for the oxidation of As(III). At the beginning of the adsorption reaction, the concentration of As in As–TBC immediately decreased from 10 mg L−1 to 0.659 mg L−1, as shown in Fig. 11(a). The arsenic removal rate reached 93.41% within 5 minutes. After that, the arsenic concentration gradually decreased to 0.083 mg L−1, and the removal rate was 99.17% within 4 hours. The decreasing tendency of As concentration in As–TBA–TBC was similar to that in As–TBC. In comparison with As–TBA–TBC and As–TBC, there was an obvious difference from the decreasing tendency of the As concentration in As–SOD–TBC. At the beginning of the adsorption reaction, the concentration of As in As–SOD–TBC (1.533 mg L−1) was higher than that in As–TBA–TBC and As–TBC, and the arsenic removal rate in As–SOD–TBC was 84.66%. Then, the arsenic concentration in As–SOD–TBC gradually decreased to 0.122 mg L−1. The arsenic removal rate was 98.77% within 4 hours.
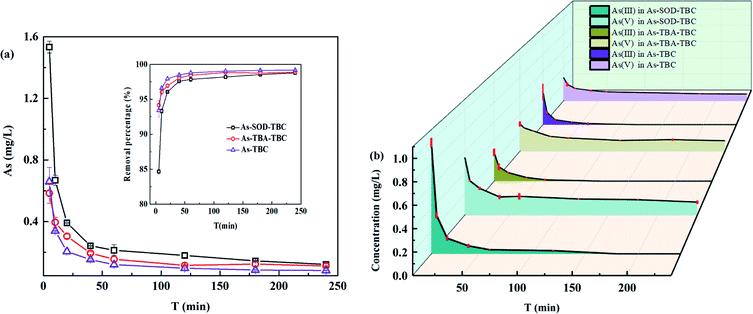 |
| | Fig. 11 Effect of scavengers on oxidation and adsorption of As(III). (a) Concentration and removal percentage of arsenic versus time in As–SOD–TBC, As–TBA–TBC and As–TBC; (b) concentration of As(III) and As(V) versus time in As–SOD–TBC, As–TBA–TBC and As–TBC. As–SOD–TBC: As(III) = 10 mg L−1, SOD = 500–1500 units per mL, TBC = 2 mg mL−1; As–TBA–TBC: As(III) = 10 mg L−1, t-butanol alcohol (TBA) = 100 mg L−1, TBC = 2 mg mL−1; As–TBC: As(III) = 10 mg L−1 As, TBC = 2 mg mL−1. | |
As shown in Fig. 11(b), the oxidation of As(III) in solution of three reaction groups was observed. In As–TBA–TBC and As–TBC, As(III) was completely converted to As(V) in 2 hours. However, it took three hours in As–SOD–TBC. During the 4 hour adsorption reaction, the concentrations of As and As(III) in As–SOD–TBC were always higher than those in the other two groups. With increasing reaction time, the inhibition of trivalent arsenic oxidation became weak due to the instability and inactivation of SOD. The results showed that SOD obviously weakened the oxidation and adsorption capacity of As(III) onto TBC. This implied that O2˙− significantly affected the oxidation and adsorption of As(III) by TBC. Under UV and visible light illumination, TiO2 photocatalyst absorbs photons with energy equal to or higher than its band gap energy, leading to the formation of electron (conduction band) and hole (valence band) pairs.19,48 O2 acts as an electron accepter in aerated aqueous suspensions, leading to superoxide anion radicals (O2˙− ions), which oxidizes As(III) to As(IV).19,48–50
To further explore the effect of electron acceptor O2 on photocatalytic oxidation of As(III), a N2 stripping experiment was carried out. The experimental results were shown in Fig. 12. After the first five minutes of the reaction, the concentration of arsenic and the arsenic removal rate were 1.304 mg L−1 and 86.96%, 0.921 mg L−1 and 90.78%, respectively, with or without continuous N2 purging. Then, the concentration of arsenic gradually decreased to 0.364 mg L−1 and 0.352 mg L−1, while the arsenic removal rate increased to 96.36% and 96.47% with or without N2 purging, respectively. Overall, the concentration of arsenic with N2 purging was higher, while the arsenic removal rate was lower than that without N2 purging. Since the contact surface between the solution and atmospheric environment increased during N2 stripping, the reaction system with nitrogen purging was not completely oxygen-free. This led to the oxidation of As(III) in solution with N2 purging. Within one hour of the adsorption reaction, the concentration of As(III) with N2 purging was slightly lower than that without N2 purging. In the latter reaction, there was no difference in the concentration of As(III) between solutions with or without N2 stripping. The reduction of oxygen content in the solution caused by N2 purging slowed down the oxidation of As(III) to a certain extent and affected the removal percentage of arsenic and the adsorption performance of TBC for arsenic. The experimental results of scavenging free radicals and N2 purging strongly indicated that O2˙− dominated As(III) photooxidation on TiO2.19,49,50 The oxidation of As(III) obviously affected the removal percentage of arsenic and the adsorption performance of TBC for arsenic.
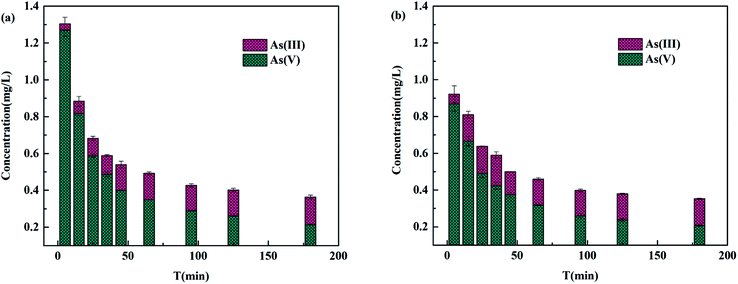 |
| | Fig. 12 Changes of the adsorption capacity and oxidation of As(III) by TBC (a) with or (b) without continuous nitrogen purging conditions. | |
3.7.3 XPS. XPS was used to analyse the surface chemical compositions of the adsorbents. Specifically, Fig. 13(a) showed that characteristic peaks of C 1s, O 1s and Ti 2p appeared at 284.68 eV, 531.08 eV and 458.98 eV in TBC, respectively. After adsorption, a new peak of As 3d appeared at a binding energy of 44.98 eV. In the high-resolution XPS spectra of Ti 2p, peaks at approximately 458.98 eV and 464.68 eV belonged to Ti 2p3/2 and Ti 2p1/2 of TiO2, respectively, as shown in Fig. 13(b). The binding energy difference (EB) between Ti 2p3/2 and Ti 2p1/2 of TiO2 was 5.7 eV, meeting the requirement of the valence state of Ti4+ in TiO2.51 The results further confirmed the existence of Ti as Ti4+ (TiO2).
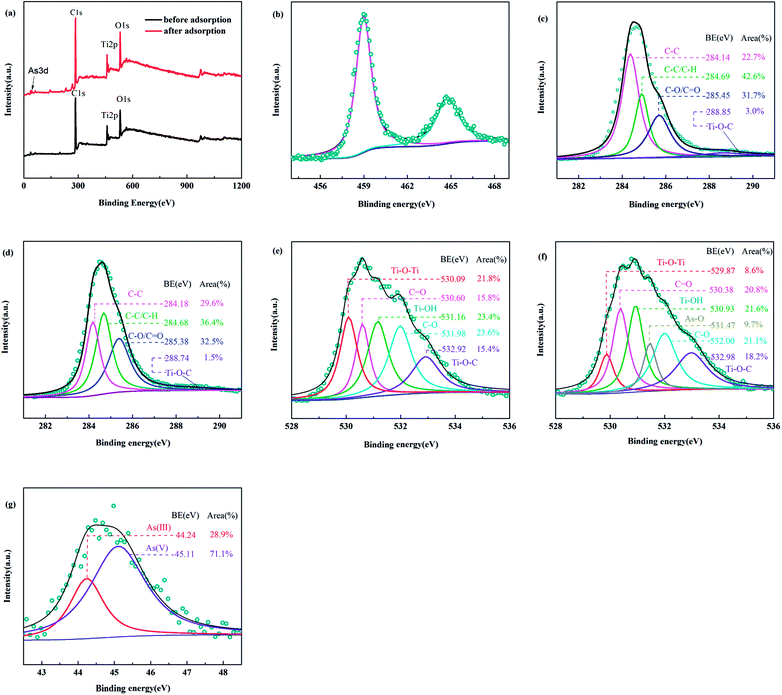 |
| | Fig. 13 The full spectrum of XPS of BC and TBC (a), the narrow scan XPS spectrum of Ti 2p (b) and C 1s before adsorption (c), C 1s after adsorption (d), O 1s before adsorption (e), O 1s (f) and As 3d after adsorption (g). | |
The strong carbon signal was mainly due to the presence of BC. As shown in Fig. 13(c), four peaks of carbon species were observed in the C 1s spectrum before adsorption. The peaks at binding energies of 284.14 eV and 284.69 eV corresponded to C–C and C–C/C–H,51,52 respectively. The peak at a binding energy of 285.45 eV was assigned to C–O or C![[double bond, length as m-dash]](https://www.rsc.org/images/entities/char_e001.gif) O.26,51 The peak at a binding energy of 288.85 eV was likely a signal for C in the lattice of TiO2 (Ti–O–C).26,51,53 After adsorption, four peaks of carbon species also appeared, as shown in Fig. 13(d). In Fig. 13(e), there were five peaks at binding energies of 530.09 eV, 530.60 eV, 531.16 eV, 531.98 eV and 532.92 eV in the O 1s spectrum of TBC, which were ascribed to Ti–O–Ti,26,51 C
O.26,51 The peak at a binding energy of 288.85 eV was likely a signal for C in the lattice of TiO2 (Ti–O–C).26,51,53 After adsorption, four peaks of carbon species also appeared, as shown in Fig. 13(d). In Fig. 13(e), there were five peaks at binding energies of 530.09 eV, 530.60 eV, 531.16 eV, 531.98 eV and 532.92 eV in the O 1s spectrum of TBC, which were ascribed to Ti–O–Ti,26,51 C![[double bond, length as m-dash]](https://www.rsc.org/images/entities/char_e001.gif) O,26,51,52 Ti–OH,26 C–O (C–OH, C–O–C or –OCOO-R) groups,26,51,52 and Ti–O–C,26 respectively. As shown in Fig. 13(f), a new peak at 531.47 eV ascribed to As–O appeared after adsorption.6 The decrease in Ti–OH area from 23.45% to 21.57.8% indicated that the hydroxyl groups on Ti–OH were involved in the adsorption of arsenic. After arsenic adsorption, new peaks at 44.98 eV binding energies appeared in TBC. The As 3d spectrum was decomposed into two individual component peaks, as shown in Fig. 13(g). The As 3d peaks for As(III) and As(V) responded to binding energy ranges of 44.24 eV and 45.11 eV, respectively.5,6,34,39 As 3d spectra confirmed that oxidation of As(III) occurred.
O,26,51,52 Ti–OH,26 C–O (C–OH, C–O–C or –OCOO-R) groups,26,51,52 and Ti–O–C,26 respectively. As shown in Fig. 13(f), a new peak at 531.47 eV ascribed to As–O appeared after adsorption.6 The decrease in Ti–OH area from 23.45% to 21.57.8% indicated that the hydroxyl groups on Ti–OH were involved in the adsorption of arsenic. After arsenic adsorption, new peaks at 44.98 eV binding energies appeared in TBC. The As 3d spectrum was decomposed into two individual component peaks, as shown in Fig. 13(g). The As 3d peaks for As(III) and As(V) responded to binding energy ranges of 44.24 eV and 45.11 eV, respectively.5,6,34,39 As 3d spectra confirmed that oxidation of As(III) occurred.
TBC could directly adsorb part of the trivalent arsenic (H3AsO3 or H2AsO3−) from aqueous solution. Meanwhile, Ti–OH on TBC can neutralize OH− at solution pH > pHPZC (4.40) while releasing H+ at solution pH < pHPZC (4.40).24 The related equations were as follows:
| | |
biochar2Ti–OH + H3AsO3 → biochar(TiO)2AsO− + 2H2O + H+
| (12) |
| |
biochar2Ti–OH + H2AsO3− → (![[double bond splayed left]](https://www.rsc.org/images/entities/char_e009.gif) TiO)2AsO− + 2H2O TiO)2AsO− + 2H2O
| (13) |
| | |
biocharTi–OH + OH− → Ti–O− + H2O
| (14) |
| | |
biocharTi–OH → Ti–O− + H+
| (15) |
These reactions caused a significant drop in solution pH. Under visible light illumination, the TiO2 photocatalyst absorbed photons with energy equal to or higher than its band gap energy, leading to the formation of electron (conduction band) and hole (valence band) pairs (eqn (16)).48 O2 acted as an electron accepter in aerated aqueous suspensions and was converted to a superoxide anion radical (O2˙−), which transformed As(III) into the intermediate product of As(IV) and then into less toxic As(V).19,48–50 These equations were as follows:19,48–50
| | |
biocharTiO2 + hv (visible light) → hVB+ + eCB−
| (16) |
| | |
O2 + eCB− → biocharO2˙−
| (17) |
| |
 | (18) |
| | |
biochar2Ti–OH + H2AsO4− → biochar(Ti–O)2AsO2− + 2H2O
| (19) |
The removal mechanisms of As(III) from aqueous solution by TBC was shown in Scheme 2.19,24,26,48–50,54
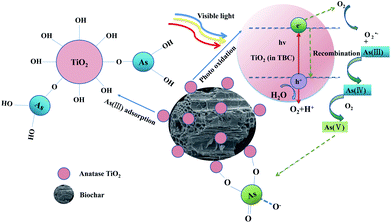 |
| | Scheme 2 The removal mechanisms of As(III) from aqueous solution by TBC. | |
4. Conclusions
In this study, TiO2-modified biochar produced by waste Chinese traditional medicine dregs (TBC) which was a friendly and inexpensive biosorbent showed efficient capacity in As(III) removal. Due to loading with TiO2, the microstructure and functional groups of the adsorbent obviously changed and the adsorption capability for As(III) removal reached up to 58.456 mg g−1. This excellent adsorption performance may be attributed to multiple roles for As(III) removal, including direct adsorption and photocatalytic oxidation adsorption. There was little effect on the adsorption capacity among a broad pH range at an initial concentration of 10 mg L−1 As(III). During and after As(III) adsorption on TBC, most As(III) was converted to less toxic As(V). The results of free radical scavenging and N2 purging experiments strongly indicated that O2 played a role as an electron accepter in aerated aqueous suspensions and O2˙− dominated As(III) photooxidation. The oxidation of trivalent arsenic obviously affected the adsorption capacity of TBC for As(III).
Author contributions
All authors contributed to the study conception and design. The first draft of the manuscript and the drawing of the diagram were completed by Yan Yang and all authors commented on previous versions of the manuscript. Manuscript writing guidance, the first draft revision was completed by the corresponding author Professor Shihua Qi. Experimental design was performed by Ruixue Zhang and Jian Zhu. Chinese traditional medicine dregs were collected by Jiayan Huang. Data interpretation and analysis was performed by Shiwan Chen and Pan Wu. Experimental operation and data collation were performed by Yan Yang.
Conflicts of interest
There are no conflicts of interest to declare.
Acknowledgements
This research was supported by the National Key Research and Development Program of China (No. 2019YFC1805300), National Natural Science Foundation of China, Project of Karst Scientific Research Center of the People's Government of Guizhou Province (Grant U1612442), and Science and Technology Planning Project of Guizhou Province (No. [2019]2864).
References
- M. Imran, M. M. Iqbal, J. Iqbal, N. S. Shah, Z. U. H. Khan, B. Murtaza, M. Amjad, S. Ali and M. Rizwan, Synthesis, characterization and application of novel MnO and CuO impregnated biochar composites to sequester arsenic (As) from water: Modeling, thermodynamics and reusability, J. Hazard. Mater., 2021, 401, 123338 CrossRef CAS PubMed.
- A. K. Sharma, J. C. Tjell, J. J. Sloth and P. E. Holm, Review of arsenic contamination, exposure through water and food and low cost mitigation options for rural areas, Appl. Geochem., 2014, 41, 11–33 CrossRef CAS.
- F. Liu, G. Zhang, S. Liu, Z. Fu, J. Chen and C. Ma, Bioremoval of arsenic and antimony from wastewater by a mixed culture of sulfate-reducing bacteria using lactate and ethanol as carbon sources, Int. Biodeterior. Biodegrad., 2018, 126, 152–159 CrossRef CAS.
- T. G. Asere, C. V. Stevens and G. D. Laing, Use of (modified) natural adsorbents for arsenic remediation: A review, Sci. Total Environ., 2019, 676, 706–720 CrossRef CAS PubMed.
- C. M. Navarathna, A. G. Karunanayake, S. R. Gunatilake, C. U. Pittman Jr, F. Perez, D. Mohan and T. Mlsna, Removal of arsenic(III) from water using magnetite precipitated onto Douglas fir biochar, J. Environ. Manage., 2019, 250, 109429 CrossRef CAS PubMed.
- S. R. Chowdhury, E. K. Yanful and A. R. Pratt, Arsenic removal from aqueous solutions by mixed magnetite–maghemite nanoparticles, Environ. Earth Sci., 2010, 64(2), 411–423 CrossRef.
- B. Liu, K.-H. Kim, V. kumar and S. Kim, A review of functional sorbents for adsorptive removal of arsenic ions in aqueous systems, J. Hazard. Mater., 2020, 388, 121815 CrossRef CAS PubMed.
- D. Zhong, Z. Zhao, Y. Jiang, X. Yang, L. Wang, J. Chen, C.-Y. Guan, Y. Zhang, D. C. W. Tsang and J. C. Crittenden, Contrasting abiotic As(III) immobilization by undissolved and dissolved fractions of biochar in Ca2+-rich groundwater under anoxic conditions, Water Res., 2020, 183, 116106 CrossRef CAS PubMed.
- G. Ungureanu, S. Santos, R. Boaventura and C. Botelho, Arsenic and antimony in water and wastewater: overview of removal techniques with special reference to latest advances in adsorption, J. Environ. Manage., 2015, 151, 326–342 CrossRef CAS PubMed.
- R. Amen, H. Bashir, I. Bibi, S. M. Shaheen, N. K. Niazi, M. Shahid, M. M. Hussain, V. Antoniadis, M. B. Shakoor, S. G. Al-Solaimani, H. Wang, J. Bundschuh and J. Rinklebe, A critical review on arsenic removal from water using biochar-based sorbents: The significance of modification and redox reactions, Chem. Eng. J., 2020, 396, 125195 CrossRef CAS.
- N. K. Niazi, I. Bibi, M. Shahid, Y. S. Ok, S. M. Shaheen, J. Rinklebe, H. Wang, Be. Murtaza, E. Islam, M. F. Nawaz and A. Lüttge, Arsenic removal by Japanese oak wood biochar in aqueous solutions and well water: Investigating arsenic fate using integrated spectroscopic and microscopic techniques, Sci. Total Environ., 2018, 621, 1642–1651 CrossRef CAS PubMed.
- M. Zhang, B. Gao, S. Varnoosfaderani, A. Hebard, Y. Yao and M. Inyang, Preparation and characterization of a novel magnetic biochar for arsenic removal, Bioresour. Technol., 2013, 130, 457–462 CrossRef CAS PubMed.
- S. Wang, B. Gao, Y. Li, A. E. Creamer and F. He, Adsorptive removal of arsenate from aqueous solutions by biochar supported zero-valent iron nanocomposite: Batch and continuous flow tests, J. Hazard. Mater., 2017, 322, 172–181 CrossRef CAS PubMed.
- S. M. Shaheen, N. K. Niazi, N. E. E. Hassan, I. Bibi, H. Wang, D. C. W. Tsang, Y. S. Ok, N. Bolan and J. Rinklebe, Wood-based biochar for the removal of potentially toxic elements in water and wastewater: a critical review, Int. Mater. Rev., 2019, 64(4), 216–247 CrossRef CAS.
- K. Z. Benis, A. M. Damuchali, J. Soltan and K. N. McPhedran, Treatment of aqueous arsenic-A review of biochar modification methods, Sci. Total Environ., 2020, 739, 139750 CrossRef PubMed.
- H. Li, X. Dong, E. B. Silva, L. M. Oliveira, Y. Chen and L. Q. Ma, Mechanisms of metal sorption by biochars: Biochar characteristics and modifications, Chemosphere, 2017, 178, 466–478 CrossRef CAS PubMed.
- W. He, L. He, W. Li, Q. Liao and J. Shang, adsorption of sulfamerazine from water by biochar derived from Astragalus membranaceus residue, China Environ. Sci., 2016, 36(11), 3376∼3382 Search PubMed.
- M. Deng, M. Chi, M. Wei, A. Zhu, L. Zhong, Q. Zhang and Q. Liu, A facile route of mesoporous TiO2 shell for enhanced arsenic removal, Colloids Surf., A, 2021, 627, 127138 CrossRef CAS.
- L. Yan, J. Du and C. Jing, How TiO2 facets determine arsenic adsorption and photooxidation: spectroscopic and DFT studies, Catal. Sci. Technol., 2016, 6, 2419–2426 RSC.
- M. Luo, H. Lin, Y. He, B. Li, Y. Dong and L. Wang, Efficient simultaneous removal of cadmium and arsenic in aqueous solution by titanium-modified ultrasonic biochar, Bioresour. Technol., 2019, 284, 333–339 CrossRef CAS PubMed.
- Z. Xu, C. Jing, F. Li and X. Meng, Mechanisms of photocatalytical degradation of monomethylarsonic and dimethylarsinic acids using nanocrystalline titanium dioxide, Environ. Sci. Technol., 2008, 42, 2349–2354 CrossRef CAS PubMed.
- State Oceanic Administration, Marine Industry Standard of the People's Republic of China, HY/T152-2013, 2013 Search PubMed.
- L. Verma and J. Singh, Synthesis of novel biochar from waste plant litter biomass for the removal of Arsenic (III and V) from aqueous solution: A mechanism characterization, kinetics and thermodynamics, J. Environ. Manage., 2019, 248, 109235 CrossRef CAS PubMed.
- P. K. Dutta, A. K. Ray, V. K. Sharma and F. J. Millero, Adsorption of arsenate and arsenite on titanium dioxide suspensions, J. Colloid Interface Sci., 2004, 278, 270–275 CrossRef CAS PubMed.
- L. Yan, Y. Huang, J. Cui and C. Jing, Simultaneous As(III) and Cd removal from copper smelting wastewater using granular TiO2 columns, Water Res., 2015, 68, 572–579 CrossRef CAS PubMed.
- X. Fu, H. Yang, H. Sun, G. Lu and J. Wu, The multiple roles of ethylenediamine modification at TiO2/activated carbon in determining adsorption and visible-light-driven photoreduction of aqueous Cr(VI), J. Alloys Compd., 2016, 662, 165–172 CrossRef CAS.
- L. Chang, Y. Pu, P. Jing, Y. Cui, G. Zhang, S. Xu, B. Cao, J. Guo, F. Chen and C. Qiao, Magnetic core-shell MnFe2O4@TiO2 nanoparticles decorated on reduced graphene oxide as a novel adsorbent for the removal of ciprofloxacin and Cu(II) from water, Appl. Surf. Sci., 2021, 541, 148400 CrossRef CAS.
- M. Wu, S. Zhao, R. Jing, Y. Shao, X. Liu, F. Lv, X. Hu, Q. Zhang, Z. Meng and A. Liu, Competitive adsorption of antibiotic tetracycline and ciprofloxacin on montmorillonite, Appl. Clay Sci., 2019, 180, 105175–105181 CrossRef CAS.
- C.-J. Sun, L.-Z. Sun and X.-X. Sun, Graphical evaluation of the favorability of adsorption processes by using conditional Langmuir constant, Ind. Eng. Chem. Res., 2013, 52, 14251–14260 CrossRef CAS.
- N. V. Vinh, M. Zafar, S. K. Behera and H.-S. Park, Arsenic(III) removal from aqueous solution by raw and zinc-loaded pine cone biochar: equilibrium, kinetics, and thermodynamics studies, Int. J. Environ. Sci. Technol., 2015, 12, 1283–1294 CrossRef.
- A. W. Samsuri, F. Sadegh-Zadeh and B. J. Seh-Bardan, Adsorption of As(III) and As(V) by Fe coated biochars and biochars produced from empty fruit bunch and rice husk, J. Environ. Chem. Eng., 2013, 1, 981–988 CrossRef CAS.
- J. I. Z. Montero, A. S. C. Monteiro, E. S. J. Gontijo, C. C. Bueno, M. A. Moraes and A. H. Rosa, High efficiency removal of As(III) from waters using a new and friendly adsorbent based on sugarcane bagasse and corncob husk Fe-coated biochars, Ecotoxicol. Environ. Saf., 2018, 162, 616–624 CrossRef CAS PubMed.
- L. Wang, Z. Li, Y. Wang, P. C. Brookes, F. Wang, Q. Zhang, J. Xu and X. Liu, Performance and mechanisms for remediation of Cd(II) and As(III) co-contamination by magnetic biochar-microbe biochemical composite: Competition and synergy effects, Sci. Total Environ., 2021, 750, 141672 CrossRef CAS PubMed.
- L. Lin, G. Zhang, X. Liu, Z. H. Khan, W. Qiu and Z. Song, Synthesis and adsorption of Fe-Mn-La-impregnated biochar composite as an adsorbent for As(III) removal from aqueoussolutions, Environ. Pollut., 2019, 247, 128–135 CrossRef CAS PubMed.
- K. A. Taleb, J. D. Rusmirovic, M. P. Rancic, J. B. Nikolic, S. Z. Drmanic, Z. S. Velickovic and A. D. Marinkovic, Efficient pollutants removal by amino-modified nanocellulose impregnated with iron oxide, J. Serb. Chem. Soc., 2016, 81, 1199–1213 CrossRef CAS.
- P. Benjwal, M. Kumar, P. Chamoli and K. K. Kar, Enhanced photocatalytic degradation of methylene blue and adsorption of arsenic (III) by reduced graphene oxide (rGO)-metal oxide (TiO2/Fe3O4) based nanocomposites, RSC Adv., 2015, 5, 73249–73260 RSC.
- J.-B. Huo, L. Xu, J.-C. E. Yang, H.-J. Cui, B. Yuan and M.-L. Fu, Magnetic responsive Fe3O4-ZIF-8 core-shell composites for efficient removal of As (III) from water, Colloids Surf., A, 2018, 539, 59–68 CrossRef CAS.
- B. Liu, M. Jian, R. Liu, J. Yao and X. Zhang, Highly efficient removal of arsenic (III) from aqueous solution by zeolitic imidazolate frameworks with different morphology, Colloids Surf., A, 2015, 481, 358–366 CrossRef CAS.
- Y. Wei, S. Wei, C. Liu, T. Chen, Y. Tang, J. Ma, K. Yin and S. Luo, Efficient removal of arsenic from groundwater using iron oxide nanoneedle array-decorated biochar fibers with high Fe utilization and fast adsorption kinetics, Water Res., 2019, 167, 115107 CrossRef CAS PubMed.
- A. Sarkar and B. Paul, Synthesis, characterization of iron-doped TiO2 (B) nanoribbons for the adsorption of As (III) from drinking water and evaluating the performance from the perspective of physical chemistry, J. Mol. Liq., 2021, 322, 114556 CrossRef CAS.
- Z. Gao, Z. Wu, X. Chen and X. Yang, Effective synthesis of nanoscale anatase TiO2 single crystals using activated carbon template to enhance the photodegradation of crystal violet, Appl. Organomet. Chem., 2019, e4664 CrossRef.
- S. S. Mali, C. A. Betty, P. N. Bhosale and P. S. Patil, Synthesis, Characterization of hydrothermally grown MWCNT–TiO2 photoelectrodes and their visible light absorption properties, ECS J. Solid State Sci. Technol., 2012, 1(2), M15–M23 CrossRef CAS.
- Y. Jia, L. Xu, X. Wang and G. P. Demopoulos, Infrared spectroscopic and X-ray diffraction characterization of the nature of adsorbed arsenate on ferrihydrite, Geochim. Cosmochim. Acta, 2007, 71, 1643–1654 CrossRef CAS.
- Z. Zhou, Y. Liu, S. Liu, H. Liu, G. Zeng, X. Tan, C. Yang, Y. Ding, Z. Yan and X. Cai, Sorption performance and mechanisms of arsenic(V) removal by magnetic gelatin-modified biochar, Chem. Eng. J., 2017, 314, 223–231 CrossRef CAS.
- Y. Huang, M. Gao, Y. Deng, Z. H. Khan, X. Liu, Z. Song and W. Qiu, Efficient oxidation and adsorption of As(III) and As(V) in water using a Fenton-like reagent, (ferrihydrite)-loaded biochar, Sci. Total Environ., 2020, 715, 136957 CrossRef CAS PubMed.
- N. Li and R. Bai, Highly Enhanced adsorption of lead ions on chitosan granules functionalized with poly(acrylic acid), Ind. Eng. Chem. Res., 2006, 45(23), 7897–7904 CrossRef CAS.
- M. Momčilović, M. Purenović, A. Bojić, A. Zarubica and M. Ranđelović, Removal of lead(II) ions from aqueous solutions by adsorption onto pine cone activated carbon, Desalination, 2011, 276, 53–59 CrossRef.
- X. Guan, J. Du, X. Meng, Y. Sun, B. Sun and Q. Hu, Application of titanium dioxide in arsenic removal from water: A review, J. Hazard. Mater., 2012, 215–216, 1–16 CrossRef CAS PubMed.
- J. Ryu and W. Choi, Effects of TiO2 surface modifications on photocatalytic oxidation of arsenite:the role of superoxides, Environ. Sci. Technol., 2004, 38, 2928–2933 CrossRef CAS PubMed.
- W. Choi, J. Yeo, J. Ryu, T. Tachikawa and T. Majima, Photocatalytic Oxidation Mechanism of As(III) on TiO2: Unique Role of As(III) as a Charge Recombinant Species, Environ. Sci. Technol., 2010, 44(23), 9099–9104 CrossRef CAS PubMed.
- L. Luo, Y. Yang, M. Xiao, L. Bian, B. Yuan, Y. Liu, F. Jiang and X. Pan, A novel biotemplated synthesis of TiO2/wood charcoal composites for synergistic removal of bisphenol A by adsorption and photocatalytic degradation, Chem. Eng. J., 2015, 262, 1275–1283 CrossRef CAS.
- B. Gao, P. S. Yap, T. M. Lim and T.-T. Lim, Adsorption-photocatalytic degradation of Acid Red 88 by supported TiO2: Effect of activated carbon support and aqueous anions, Chem. Eng. J., 2011, 171, 1098–1107 CrossRef CAS.
- G. Liu, C. Han, M. Pelaez, D. Zhu, S. Liao, V. Likodimos, N. Ioannidis, A. G. Kontos, P. Falaras, P. S. M. Dunlop, J. A. Byrne and D. D. Dionysiou, Synthesis, characterization and photocatalytic evaluation of visible light activated C-doped TiO2 nanoparticles, Nanotechnology, 2012, 23, 294003 CrossRef PubMed.
- A. García, M. Rosales, M. Thomas and G. Golemme, Arsenic photocatalytic oxidation over TiO2-loaded SBA-15, J. Environ. Chem. Eng., 2021, 9, 106443 CrossRef.
|
| This journal is © The Royal Society of Chemistry 2022 |
Click here to see how this site uses Cookies. View our privacy policy here.  Open Access Article
 *a
*a

![[double bond splayed left]](https://www.rsc.org/images/entities/char_e009.gif) TiOH) → (
TiOH) → (![[double bond splayed left]](https://www.rsc.org/images/entities/char_e009.gif) TiO)2AsO− + 2H2O + H+
TiO)2AsO− + 2H2O + H+

![[thin space (1/6-em)]](https://www.rsc.org/images/entities/char_2009.gif) qe − k1t
qe − k1t


![[thin space (1/6-em)]](https://www.rsc.org/images/entities/char_2009.gif) ln(αβ) of the curve qt vs. ln(t). In general, the Elovich kinetic model has been usually used for describing the adsorption kinetic of contaminants on the surface of a non-uniform solid adsorbent.28
ln(αβ) of the curve qt vs. ln(t). In general, the Elovich kinetic model has been usually used for describing the adsorption kinetic of contaminants on the surface of a non-uniform solid adsorbent.28
![[thin space (1/6-em)]](https://www.rsc.org/images/entities/char_2009.gif) 431
431![[thin space (1/6-em)]](https://www.rsc.org/images/entities/char_2009.gif) 655.17
655.17![[thin space (1/6-em)]](https://www.rsc.org/images/entities/char_2009.gif) 037.86
037.86


![[thin space (1/6-em)]](https://www.rsc.org/images/entities/char_2009.gif) KS
KS
![[double bond, length as m-dash]](https://www.rsc.org/images/entities/char_e001.gif) O asymmetric stretching of ketones, aldehydes, lactones or carboxyl groups.32,44,45 The peak at 2900 cm−1 was the C–H stretching vibration or CH2 group.46,47 The peaks between 1427 cm−1 and 1440 cm−1 represented the presence of aromatic rings or rings with C
O asymmetric stretching of ketones, aldehydes, lactones or carboxyl groups.32,44,45 The peak at 2900 cm−1 was the C–H stretching vibration or CH2 group.46,47 The peaks between 1427 cm−1 and 1440 cm−1 represented the presence of aromatic rings or rings with C![[double bond, length as m-dash]](https://www.rsc.org/images/entities/char_e001.gif) C bonds.23
C bonds.23
![[double bond, length as m-dash]](https://www.rsc.org/images/entities/char_e001.gif) O.26,51 The peak at a binding energy of 288.85 eV was likely a signal for C in the lattice of TiO2 (Ti–O–C).26,51,53 After adsorption, four peaks of carbon species also appeared, as shown in Fig. 13(d). In Fig. 13(e), there were five peaks at binding energies of 530.09 eV, 530.60 eV, 531.16 eV, 531.98 eV and 532.92 eV in the O 1s spectrum of TBC, which were ascribed to Ti–O–Ti,26,51 C
O.26,51 The peak at a binding energy of 288.85 eV was likely a signal for C in the lattice of TiO2 (Ti–O–C).26,51,53 After adsorption, four peaks of carbon species also appeared, as shown in Fig. 13(d). In Fig. 13(e), there were five peaks at binding energies of 530.09 eV, 530.60 eV, 531.16 eV, 531.98 eV and 532.92 eV in the O 1s spectrum of TBC, which were ascribed to Ti–O–Ti,26,51 C![[double bond, length as m-dash]](https://www.rsc.org/images/entities/char_e001.gif) O,26,51,52 Ti–OH,26 C–O (C–OH, C–O–C or –OCOO-R) groups,26,51,52 and Ti–O–C,26 respectively. As shown in Fig. 13(f), a new peak at 531.47 eV ascribed to As–O appeared after adsorption.6 The decrease in Ti–OH area from 23.45% to 21.57.8% indicated that the hydroxyl groups on Ti–OH were involved in the adsorption of arsenic. After arsenic adsorption, new peaks at 44.98 eV binding energies appeared in TBC. The As 3d spectrum was decomposed into two individual component peaks, as shown in Fig. 13(g). The As 3d peaks for As(III) and As(V) responded to binding energy ranges of 44.24 eV and 45.11 eV, respectively.5,6,34,39 As 3d spectra confirmed that oxidation of As(III) occurred.
O,26,51,52 Ti–OH,26 C–O (C–OH, C–O–C or –OCOO-R) groups,26,51,52 and Ti–O–C,26 respectively. As shown in Fig. 13(f), a new peak at 531.47 eV ascribed to As–O appeared after adsorption.6 The decrease in Ti–OH area from 23.45% to 21.57.8% indicated that the hydroxyl groups on Ti–OH were involved in the adsorption of arsenic. After arsenic adsorption, new peaks at 44.98 eV binding energies appeared in TBC. The As 3d spectrum was decomposed into two individual component peaks, as shown in Fig. 13(g). The As 3d peaks for As(III) and As(V) responded to binding energy ranges of 44.24 eV and 45.11 eV, respectively.5,6,34,39 As 3d spectra confirmed that oxidation of As(III) occurred.![[double bond splayed left]](https://www.rsc.org/images/entities/char_e009.gif) TiO)2AsO− + 2H2O
TiO)2AsO− + 2H2O


