DOI:
10.1039/D1RA08778A
(Paper)
RSC Adv., 2022,
12, 4455-4468
Identification of absorbed compounds of Xiao Yao San Jia Wei and pharmacokinetic study in depressed rats by force swimming stress†
Received
2nd December 2021
, Accepted 15th January 2022
First published on 4th February 2022
Abstract
Xiao-Yao-San-Jia-Wei (XYSJW) is a commonly prescribed formulation for depression and anorexia in the Jiang Su Province Hospital of Chinese Medicine. Unfortunately, the proper dosage of this formulation is still unclear due to its limited chemical and pharmacokinetic profiles. Thus, in the present study, a sensitive, precise, and rapid procedure for the identification of absorbed compounds (Cs) in the plasma of depressed rats together with a pharmacokinetic analysis was established with the help of ultra-flow liquid chromatography coupled with quadrupole time-of-flight mass spectrometry (UFLC-Q-TOF MS/MS) and ultra-flow liquid chromatography coupled with electrospray ionization triple quadrupole tandem mass spectrometry (UFLC-QQQ MS/MS). Based on the characteristic fragmentation, neutral loss, mass defect filter, relevant literature and reference standards, 225 Cs in the XYSJW extract and 20 Cs in the plasma of the depressed rats were tentatively recognized via UFLC-Q-TOF MS/MS and UFLC-QQQ MS/MS. Then, the 12 major absorbed Cs in the depressed rats after oral XYSJW administration were chosen to further investigate its pharmacokinetic profile by UFLC-QQQ MS/MS. This study provides a systematic approach for the rapid and qualitative analysis of absorbed Cs in depressed rats and investigating the pharmacokinetics of XYSJW. More importantly, our work provides key information on the chemical and pharmacokinetic profiles of XYSJW in vitro and in vivo, which may benefit its therapeutic efficacy and further pharmacological studies involving this formulation.
1. Introduction
The Global Burden of Disease Study 2017 identified major depressive disorder (MDD) as the second largest worldwide producer of disability.1 MDD is characterized by poor mood, disinterest, and displeasure, together with somatic and psychiatric symptomology such as nausea, headache, insomnia, and agitation.2 In the majority of cases, MDD therapy involves the use of antidepressants, namely selective serotonin reuptake inhibitors (SSRIs).3 However, although positive effects have been observed with SSRIs, the presence of multiple adverse reactions associated with this type of drug warrants caution.4
Traditional Chinese medicine (TCM) frequently provides therapy for poor mental health in China.5 Xiao-Yao-San is a Chinese herbal formulation that was first introduced in the Taiping Huimin Heji Jufang, the initial global medical official documentation during the Song Dynasty (960–1127 AD). Growing evidence suggests that Xiao-Yao-San is beneficial for the correction of liver qi stagnation and spleen deficiency, a condition that induces both states of depression and loss of appetite.6 In prior investigations, we demonstrated that Xiao-Yao-San and Xiao-Yao-San-Jia-Wei (modified Xiao-Yao-San, XYSJW) exert an anti-depressive effect via modulation of the hippocampus,7,8 amygdala,9 locus coeruleus,10 and hypothalamus.11 Additionally, XYSJW can relieve depressive symptoms via regulation of gut microbes.12 Recently, XYSJW has become the first choice for treating depression, sleep disturbances, and anxiety disorder due to its good clinical manifestations and low side effects in China.13
As is known, most TCM are orally administrated, and thus only the ingredients absorbed into the blood can exert their bioactivities.14 Therefore, tracing the compounds in a TCM prescription in vivo and evaluation their pharmacokinetics provide more in-depth insight into the main active components and therapeutic mechanisms of TCM formulations. Compared to the clinical and pharmacological studies on XYSJW, the chemical and pharmacokinetic profile of this formulation is limited, and to date, pharmacokinetic studies in depressed rats are also rare. This study utilized ultra-flow liquid chromatography coupled with mass spectrometry (UFLC-MS/MS), a robust detecting system, with high resolution and sensitivity,15 to detect hundreds of active compounds (Cs) in XYSJW. Based on our research, 225 Cs and 20 absorbed Cs were tentatively identified in the XYSJW extract and depressed rat plasma after 30 kg g−1 oral XYSJW administration, respectively. Then, 12 absorbed Cs were detected by UFLC-QQQ-MS/MS and their pharmacokinetic parameters were determined. The chemical and pharmacokinetic data from this study will provide meaningful information in the fields of pharmacological research and rational use of this formulation in clinics.
2. Materials and method
2.1. Materials and reagent
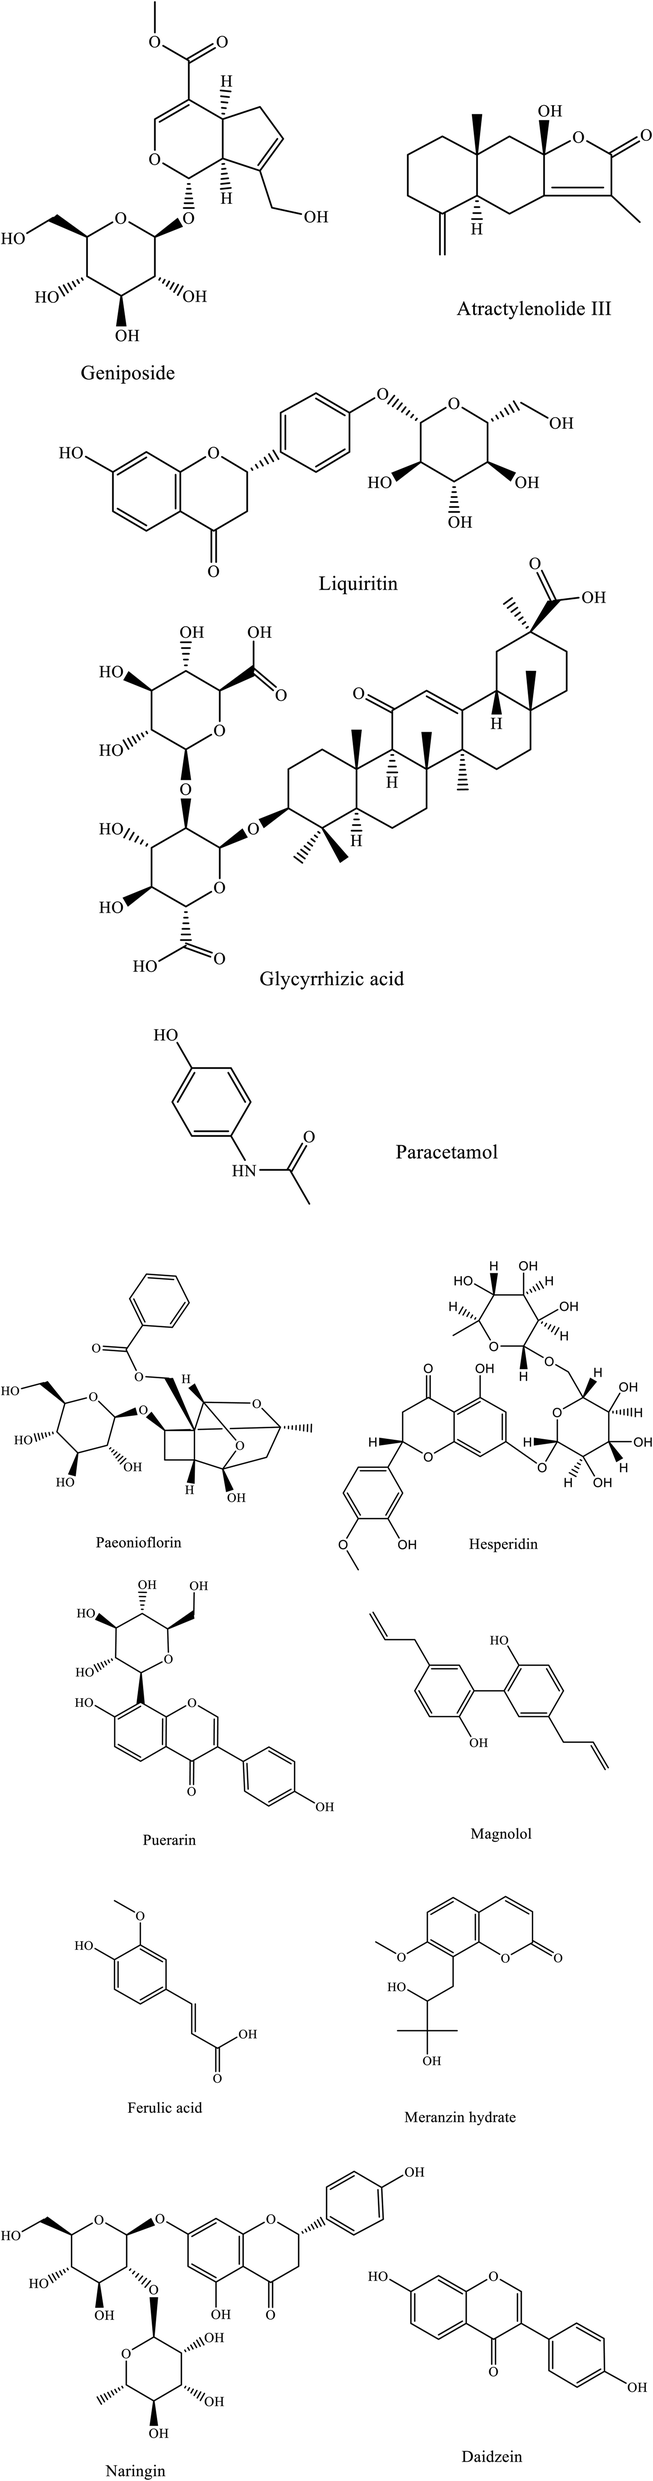
Prepared slices of the crude drugs, namely, Paeoniae Radix Alba, Angelicae sinensis Radix, Aurantii Fructus, Radix Puerariae, Glycyrrhiza uralensis Fisch, Atractylodes macrocephala Koidz., Jujubae Fructus, Zingiberis Rhizoma, Cortex Moutan, Poria cocos (Schw.) Wolf, Gardeniae Fructus, Menthae Herba, Bupleuri Radix, and Magnolia officinalis Rehd. Et Wils were obtained from Laobaixing Pharmaceutical Co., Ltd. All drugs were critically examined and validated by Prof. Jian-wei Chen (Nanjing University of Chinese Medicine). HPLC-grade acetonitrile, formic acid, and methanol were purchased from Merck Co. (Darmstadt, Germany). Ultra-pure water was obtained from a Milli-Q SP Reagent system (Bedford, MA, USA). Meranzin hydrate, atractylenolide III, hesperetin, daidzein, liquirtin, magnolol, puerarin, paeoniflorin, naringin, hesperidin, glycyrrhizic acid, ferulic acid, geniposide, and paracetamol with purity ≥98%, were obtained from Nanjing Jin Yibai Biological Technology Co. Ltd. Their chemical structures are illustrated in Fig. 1.
 |
| | Fig. 1 Typical chemical structures of XYSJW in depressed rats and IS. | |
2.2. UFLC-MS/MS conditions
A UFLC (Shimadzu Corporation UFLC XR; Kyoto, Japan) attached to a Triple TOF MS (Triple TOF MS 5600 system, AB SCIEX, Los Angeles, CA, USA), using an electrospray ionization (ESI) source, was employed for qualitative analysis. For chromatographic separation (CGS), Shimadzu Shim-pack XR-ODS C18 (100 × 2.0 mm, 2.2 µm Kyoto, Japan) was used. A binary solvent gradient was prepared using water with 0.1% formic acid and acetonitrile with 0.1% formic acid. The flow rate was adjusted to 0.4 mL min−1 and the complete run time was 60 min. The gradient was as follows: 0–5 min 2–8% B; 5–12 min 8–10% B; 12–16 min 10–15% B; 16–38 min 15–35% B; 38–45 min 35–50% B; 45–52 min 50–95% B; 52–55 min 95% B; 55–57 min 95–2% B; and 57–60 min 2% B.
A UFLC (Shimadzu Corporation UFLC XR; Kyoto, Japan) attached to a Q-Trap-MS (Q-Trap 5500 system, AB SCIEX, Los Angeles, CA, USA), using an electrospray ionization (ESI) source, was employed for quantitative analysis. For the CGS, a Waters BEH C18 column was used (2.1 mm × 50 mm, 1.7 µm) (Waters Corporation, Milford, MA, USA). A binary solvent gradient was prepared using water with 0.1% formic acid and acetonitrile with 0.1% formic acid. The flow rate was adjusted to 0.35 mL min−1 and the complete run time was 10 min. The gradient was as follows: 0–5 min 8–95% B; 5–7 min 95% B; 7–8 min 95–8% B; and 8–10 min 8% B. Lastly, the column temperature and injection volume were 40 °C and 2 µL, respectively.
Samples were subjected to full scans and multiple reaction surveillance scans using positive (+) and negative (−) ion modes. ESI was used to maintain the temperature at 550 °C. Nitrogen gas and ions were utilized to form the collision gas. Ion source gases 1 and 2, 55 psi each; entrance potential, ±10 V; curtain gas, 45 psi and ion spray voltage floating, 5500 V and −4500 V, under + and − ion modes respectively.
2.3 Formulation preparation
XYSJW was prepared using routine protocols in the Formularies of the Bureau of People's Welfare Pharmacies. The crude drug form of Paeoniae Radix Alba (25 g), Angelicae sinensis Radix (25 g), Aurantii Fructus (30 g), Radix Puerariae (40 g), Glycyrrhiza uralensis Fisch (15 g), Atractylodes macrocephala Koidz. (25 g), Jujubae Fructus (15 g), Zingiberis Rhizoma (25 g), Cortex Moutan, Poria Cocos (Schw.) Wolf (15 g), Gardeniae Fructus (15 g), Menthae Herba (15 g), Bupleuri Radix (25 g), and Magnolia officinalis Rehd Et Wils (30 g) were precisely weighed and boiled twice in 3.150 L and 2.52 L of water, respectively. The samples were then filtered and lyophilized. Subsequently, 2 mL methanol: water (50![[thin space (1/6-em)]](https://www.rsc.org/images/entities/char_2009.gif) :50 v/v) was combined with 5 mg lyophilized powder, vortexed for 3.0 min, and centrifuged for 10 min at 12000 rpm. 2 µL of the supernatant (S) was then injected into the UFLC-Q-TOF MS/MS.
:50 v/v) was combined with 5 mg lyophilized powder, vortexed for 3.0 min, and centrifuged for 10 min at 12000 rpm. 2 µL of the supernatant (S) was then injected into the UFLC-Q-TOF MS/MS.
2.4. Sample processing
5 µL IS (4 µg mL−1) and 400 µL methanol were combined with 50 µL of plasma sample to allow precipitation of protein and vortexed for 3.0 min, then centrifuged for 10 min at 12000 rpm, 400 µL of S was retrieved and dried at 40 °C under an N2 flow, and then reconstituted in 50 µL of acetonitrile: water (5:5, v/v). Subsequently, after vortexing for another 3 min and centrifugation at 12000 rpm for 10 min, 5 µL of S was injected into the UFLC-Q-TOF MS/MS for qualitative examination and 2 µL of S was injected into the UFLC-QQQ MS/MS for quantitative examination.
2.5. Verifying the UFLC-MS/MS technique
We confirmed our UFLC-MS/MS results based on the US FDA principles for the verification of bioanalytical methods, which include selectivity, carry-over effect calibration curves, lower limit of quantification (LLOQ), precision, accuracy, recovery, and matrix effect.
2.5.1 Selectivity and carry-over effect. For the estimation of selectivity, we accumulated blank rat plasma (BRP) from 6 rats, BRP with standards, and real rat plasma (RRP) samples obtained from rats receiving an oral dosage of XYSJW half hour before RRP collection.To assess the carry-over effect, the highest calibration standard and IS were injected five times before the injection of the blank sample. Carry-over in the blank plasma was required to be <20% for the LLOQ of each sample and <5% for IS.
2.5.2 Linearity and LLOQ. Calibration curves were generated via the plot of peak area ratio of analyte to IS against working solution concentrations. The weighted least-square linear regression method, with a weight of 1/x2, was adopted to acquire the regression equation, the slope and y-intercept, and correlation coefficient (r). The LLOQ was the lowest concentration of the standard. Furthermore, it required that the signal-to-noise ratio (S/N) of C feedback be > ten for LLOQ.
2.5.3 Precision investigation. The intra-day precision was examined with 6 replicates at 4 different concentrations (LLOQ, Low (L), Medium (M), and High (H)), using standard solutions prepared simultaneously. The inter-precision was evaluated via the injection of 4 concentrations (LLOQ, L, M, and H), over six consecutive days. The relative error (RE %) predicted the accuracy and relative standard deviation (RSD) estimated the precision. Based on our calculations, the inter-day and intra-day precision was between −15% and +15%, and the results from the LLOQ samples ranged from −20% to +20%.
2.5.4 Matrix effect and recovery. To assess the extraction recovery and matrix effect, 6 sources of matrix and 4 different level QC samples (LLOQ, L, M, and H) were obtained and used in this study. The extraction recovery was the peak area ratio of the samples added to the blank matrix prior to and after extracting the same concentration. The matrix effect was the comparison of the analyte added to the post-extraction blank matrix, with the corresponding pure reference standard solution.
2.5.5 Stability. The rat plasma analyte stability was measured using LLOQ, and L, M, and H concentration (n = 6) of RSD and RE were evaluated under various processing and storage conditions as follows: auto-sampler at 10 °C for 8 h for processed stability, complete freeze/thaw 3 times from −20 °C to room temperature, at −20 °C for 30 days for long-term stability, and at ambient temperature for 4 h for short-term stability. The deviation within ±15.0% was acceptable at L, M, and H concentration and within ±20.0% at LLOQ concentration.
2.6 Animal experiments
Six Sprague Dawley rats (weighing 200 ± 20 g) were obtained from the Laboratory Animal Center of Nanjing University of Chinese Medicine and maintained in a controlled environment at 22 °C ± 2 °C. The forced swimming stress rat model was established according to Yoshimi Kitsda's protocol16 and involved a swimming test and open field test (ESI Table 1†). For pharmacokinetic examination, 30 g kg−1 XYSJW was administered to the rats and 0.2 mL blood samples were extracted at different time points, namely, 0.0833, 0.25, 0.5, 1, 1.5, 2, 3, 4, 6, 8, 10, 12, and 24 h. The blood samples were from the jugular veins and stored in heparinized tubes. Subsequently, the samples were centrifuged at 2000 g for 10 min and Ss were maintained at −20 °C until further examination. Meanwhile, 2 mL of sterile isotonic saline was injected into the rats to eliminate any adverse effects from blood loss. Plasma was isolated at various times after oral formulation ingestion, namely at 1 h, 2 h, and 4 h, and used for qualitative analysis. All protocols involving care and treatment were approved by the Animal Ethics Committee of NJUCM (no. ACU-11(20201120)).
2.7 Data processing
UFLC-QQQ- MS/MS and UFLC-Q-TOF- MS/MS data were generated using Analyst® version 1.6 and analyzed using PeakView® version 1.2 and MultiQuant™ version 3.2. All the above-mentioned software were obtained from AB SCIEX, Los Angeles, CA, USA. The main pharmacokinetic parameters were measured using Phoenix®WinNonlin® 8.1 (Pharsight Corporation, Mountain View, CA, USA), utilizing the non-compartmental method.
3. Results and discussion
3.1 MS and chromatographic condition developments
To achieve appropriate chromatographic parameters, several analytical columns were investigated, including Shimadzu Shim-pack XR-ODS C18 (100 × 2.0 mm, 2.2 µm Kyoto, Japan), Waters XBridge Amide column (4.6 × 100 mm, 3.5 µm Milford, USA), and Waters BEH C18 (2.1 × 50 mm, 1.7 µm Milford, USA) column. The results revealed that the Shimadzu Shim-pack XR-ODS C18 exhibited the greatest separation in the qualitative analysis and Waters BEH C18 column exhibited the greatest resolution and sensitivity in the quantitative analysis. Furthermore, several mobile phases, flow rates, and gradient elution were investigated. The acetonitrile–water system was chosen as the mobile phase due to its larger signal outcomes compared to the methanol–water system. To achieve higher ionization efficiency and shape peak, four mobile phase systems were investigated in our research including pure water, 0.1% formic acid, 3 mM ammonium acetate, and 0.1% formic acid plus 3 mM ammonium acetate. Finally, 0.1% formic acid was added to the mobile phase. To increase the selectivity of our identification, 30 standard Cs and several gradients were tested, where all the standard Cs were baseline separated at 60 min including some isomers in the current condition. To achieve a selective and sensitive MRM mode, the corresponding standard solutions of the target Cs were separately injected into the MS, with the spectra recorded between m/z 50 and 1000. The result demonstrated that some Cs responded well in the negative mode, whereas others were better in the positive mode. The optimized results, including ion transitions (ESI Fig. 1†) and C-independent mass parameters, are presented in Table 1. In addition, another 18 Cs in XYSJW were optimized and validated, including albiflorin, rutin, narirutin, rosmarinic acid, neohesperidin, naringenin, isoliquiritigenin, 6-gingerol, saikosaponin (SS) A, genipin, honokiol, atractylenolide I, glycyrrhetic acid, atractylenolide I, poricoic acid A, gardenoside, zizyvoside I, and ononin. However, they were not detected in the plasma samples of the depressed rats, which is likely due to the excessive herb content in this formula. Moreover, each dosage of these undetectable Cs was 0.35–2.71 mg kg−1 after oral administration of the XYSJW extract and 0.5–1 ng mL−1 in real plasma (their concentrations in the plasma were lower than the LLOQ). In addition, their bioavailabilities were very low. Although the real method validation included 30 Cs between 2 ng mL−1 and 2 µg mL−1, only 12 Cs were quantified and their pharmacokinetic parameters profiled.
Table 1 Optimized multiple reaction monitoring parameters for the analytes and internal standard (IS)
| Analyte |
Precursor ion (Da) |
Product ion (Da) |
Collision energy (eV) |
Cell exit potential (V) |
Declustering potential (V) |
Retention time (min) |
| Meranzin hydrate |
279.0 |
261.1 |
+7 |
+10 |
+60 |
2.66 |
| Puerarin |
417.0 |
296.9 |
+35.0 |
+14 |
+80 |
1.69 |
| Paracetamol (IS) |
152.0 |
110.0 |
+21 |
+14 |
+80 |
0.75 |
| Atractylenolide III |
247.0 |
203.0 |
−20 |
−17 |
−110 |
4.02 |
| Daidzein |
253.0 |
224.0 |
−36 |
−17 |
−185 |
2.7 |
| Ferulic acid |
193.0 |
134.0 |
−22 |
−13 |
−85 |
2.18 |
| Geniposide |
433.1 |
224.9 |
−18 |
−13 |
−40 |
1.77 |
| Glycyrrhizic acid |
821.3 |
351.0 |
−52 |
−13 |
−150 |
3.46 |
| Hesperidin |
609.1 |
301.0 |
−36 |
−25 |
−150 |
2.41 |
| Liquiritin |
417.0 |
255.0 |
−26 |
−19 |
−120 |
2.16 |
| Magnolol |
265.0 |
247.0 |
−28 |
−13 |
−155 |
4.66 |
| Naringin |
579.0 |
270.9 |
−42 |
−19 |
−180 |
2.32 |
| Paeoniflorin |
525.0 |
449.0 |
−20 |
−43 |
−75 |
1.99 |
| Paracetamol (IS) |
150.3 |
106.9 |
−22 |
−13 |
−100 |
0.75 |
To obtain an appropriate internal standard that responds well under both + and − modes, several synthetic Cs were investigated, including paracetamol, glimepiride sulfonamide, and penicillin. High extract recovery in the rat plasma and great stability are the basic requirements for selecting the internal standard. Based on our result, paracetamol achieved 89.5 ± 3.91% recovery, ±5.5% stability and 91.34 ± 4.71% matrix effect, and thus was chosen for further investigation in our study.
3.2 UFLC-Q-TOF MS analysis of absorbed Cs in depressed rat plasma
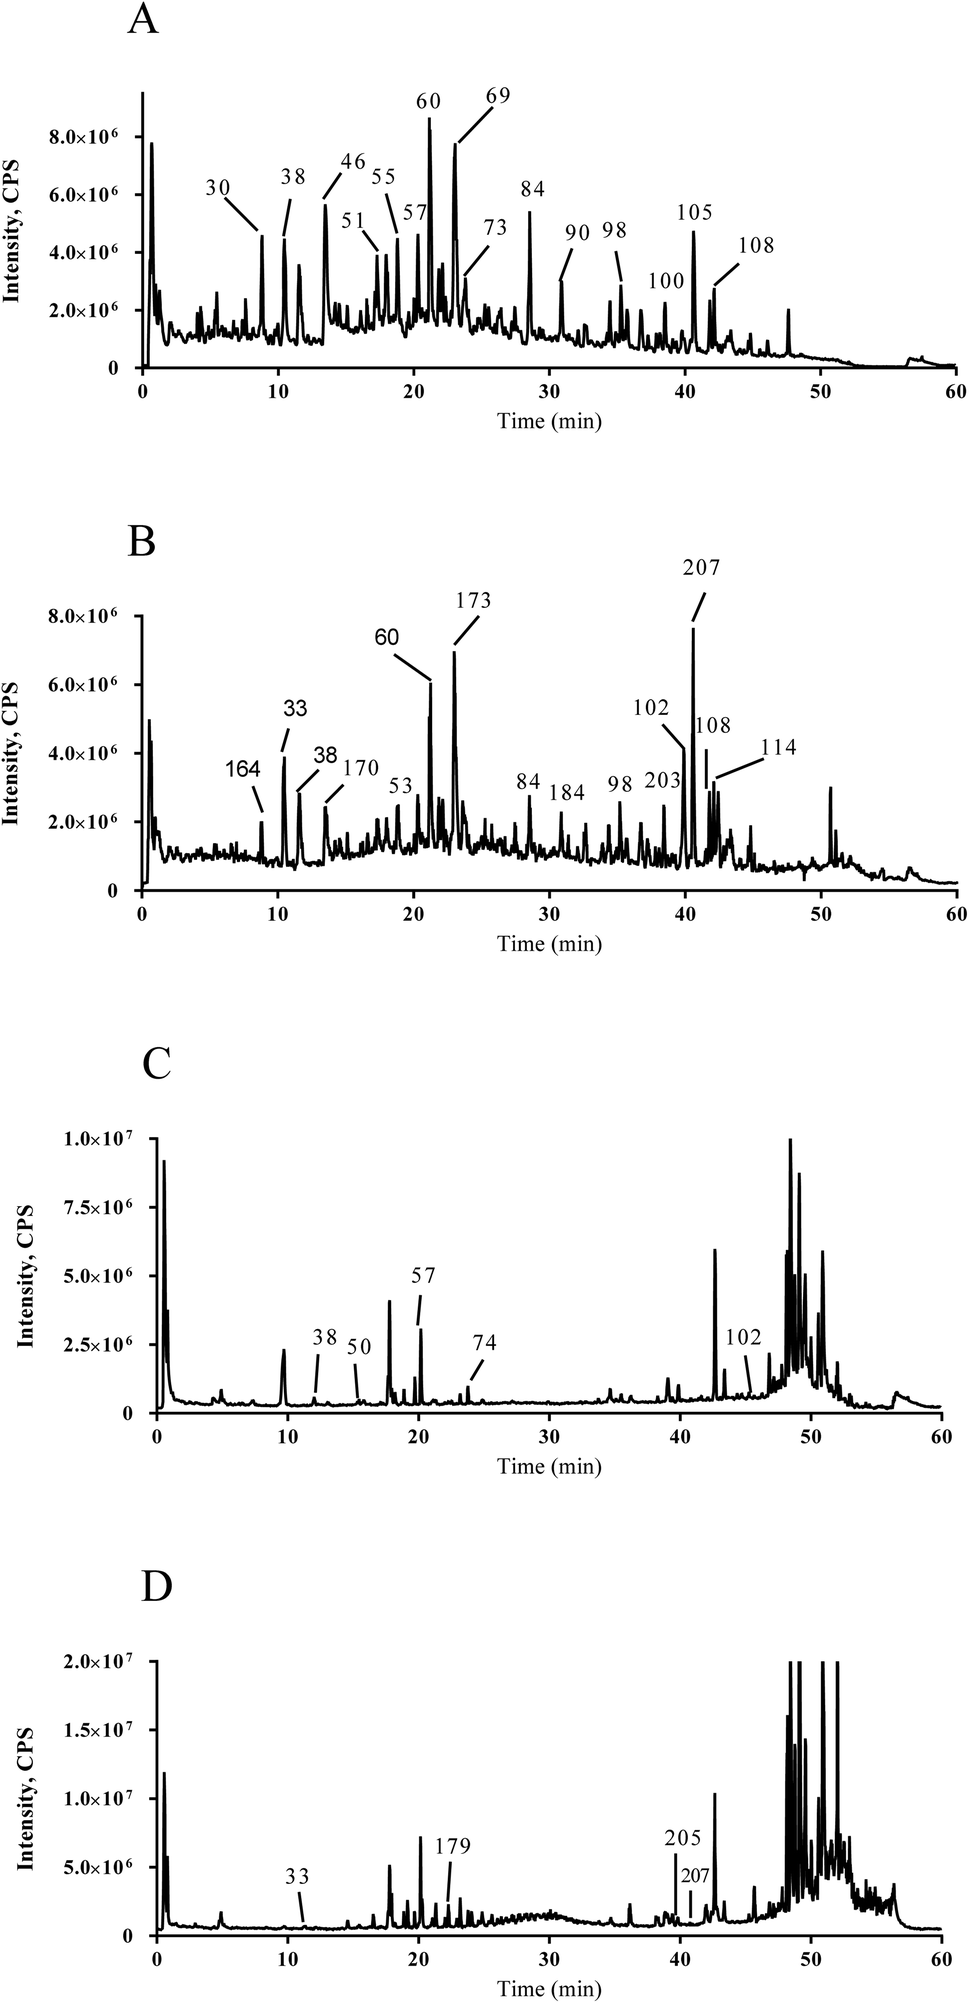
The total ion chromatogram profiles of the XYSJW extract and RRP after oral administration were expressed in positive and negative modes, as depicted in Fig. 2. The components in XYSJW and RRP were sufficiently separated by the UFLC/Q-TOF–MS/MS technique. Specifically, there were 225 Cs in the XYSJW extract (ESI Table 2† and Table 3) according to the characteristic fragmentation, neutral loss, mass defect filter, relevant literature and reference standards (CF). Furthermore, 16 Cs in RRP were tentatively identified by UFLC-QTOF-MS/MS. Their retention times (RTs) and the MS/MS information of the absorbed compounds are listed in Table 2 and Table 3.
 |
| | Fig. 2 Total ion chromatograms of (A) XYSJW in negative mode, (B) XYSJW in positive mode, (C) plasma after oral administration of XYSJW extract in negative mode and (D) plasma after oral administration of XYSJW extract in positive mode. | |
Table 2 UFLC-Q-TOF-MS/MS identification of absorbed compounds in negative mode
| No. |
TR (min) |
Identification |
Molecular formula |
Ion species |
Theoretical mass (Da) |
Measured mass (Da) |
Mass accuracy (ppm) |
MS/MS fragments ions |
Ref. |
| 1 |
4.33 |
Shanzhiside |
C16H24O11 |
[M − H]− |
391.12459 |
391.12389 |
−1.8 |
229.0723, 59.0170 |
17 |
| 2 |
4.53 |
Geniposidic acid |
C16H22O10 |
[M − H]− |
373.11402 |
373.11419 |
0.5 |
211.0602, 167.0701, 149.0601, 123.0447 |
17 |
| 3 |
10.57 |
Genipin |
C11H14O5 |
[M − H]− |
225.07685 |
225.07742 |
2.5 |
210.0494, 180.0431, 165.0181, 137.0228 |
17 |
| 4 |
11.52 |
Puerarin |
C21H20O9 |
[M − H]− |
415.10346 |
415.10326 |
−0.5 |
295.0594, 277.0594, 267.0647 |
18 |
| 5 |
17.31 |
Liquiritin |
C21H22O9 |
[M − H]− |
417.11911 |
417.11819 |
−2.2 |
255.0683, 135.0076, 119.0496 |
19 and 20 |
| 6 |
20.25 |
Naringin |
C27H32O14 |
[M − H]− |
579.17193 |
579.1704 |
−2.6 |
271.0596, 151.0028 |
21 and 22 |
| 7 |
22.11 |
Hesperidin |
C28H34O15 |
[M − H]− |
609.18249 |
609.18019 |
−3.8 |
609.1521, 301.0692 |
21 and 22 |
| 8 |
23.5 |
Neohesperidin |
C28H34O15 |
[M − H]− |
609.18249 |
609.18019 |
−3.8 |
489.1402, 343.0812, 301.0691 |
21 and 22 |
| 9 |
24.21 |
Daidzein |
C15H10O4 |
[M − H]− |
253.05063 |
253.05107 |
1.7 |
233.0388, 208.0522 |
23 |
| 10 |
42.231 |
6-Gingerol |
C17H26O4 |
[M − H]− |
293.17583 |
293.17611 |
0.9 |
99.0800, 57.0366 |
24 |
| 11 |
47.909 |
Magnolol |
C18H18O2 |
[M − H]− |
265.1234 |
265.12415 |
2.8 |
247.1101, 245.0952, 243.0803, 223.0747 |
25 |
Table 3 UFLC-Q-TOF-MS/MS identification of absorbed compounds in positive mode
| No. |
TR (min) |
Identification |
Molecular formula |
Ion species |
Theoretical mass (Da) |
Measured mass (Da) |
Mass accuracy (ppm) |
MS/MS fragments ions |
Ref. |
| 1 |
10.49 |
Genipin |
C11H14O5 |
[M + H]+ |
227.0914 |
227.09161 |
0.9 |
177.0549, 149.0600, 121.0663, 91.0567, 77.0422 |
17 |
| 2 |
23.56 |
4′,7-Dihydroxyflavone |
C15H10O4 |
[M + H]+ |
255.06519 |
255.06527 |
0.3 |
237.0552, 227.0716, 199.0761, 181.0654, 137.0243, 91.0570 |
17 |
| 3 |
23.64 |
Meranzin hydrate |
C15H18O5 |
[M + H]+ |
279.1227 |
279.1227 |
0.1 |
243.1031, 189.0551, 131.0504 |
21 and 22 |
| 4 |
39.93 |
Nobiletin |
C21H22O8 |
[M + H]+ |
403.13874 |
403.13909 |
0.9 |
388.1173, 373.0929 |
21 and 22 |
| 5 |
40.98 |
Glycyrrhizic acid |
C42H62O16 |
[M + H]+ |
823.41106 |
823.41152 |
0.6 |
647.3800, 417.3479, 453.3360, 435.3269 |
19 and 20 |
| 6 |
41.06 |
Atractylenolide III |
C15H20O3 |
[M + H]+ |
249.14852 |
249.14865 |
0.5 |
231.1389, 163.0756, 105.0708 |
26 |
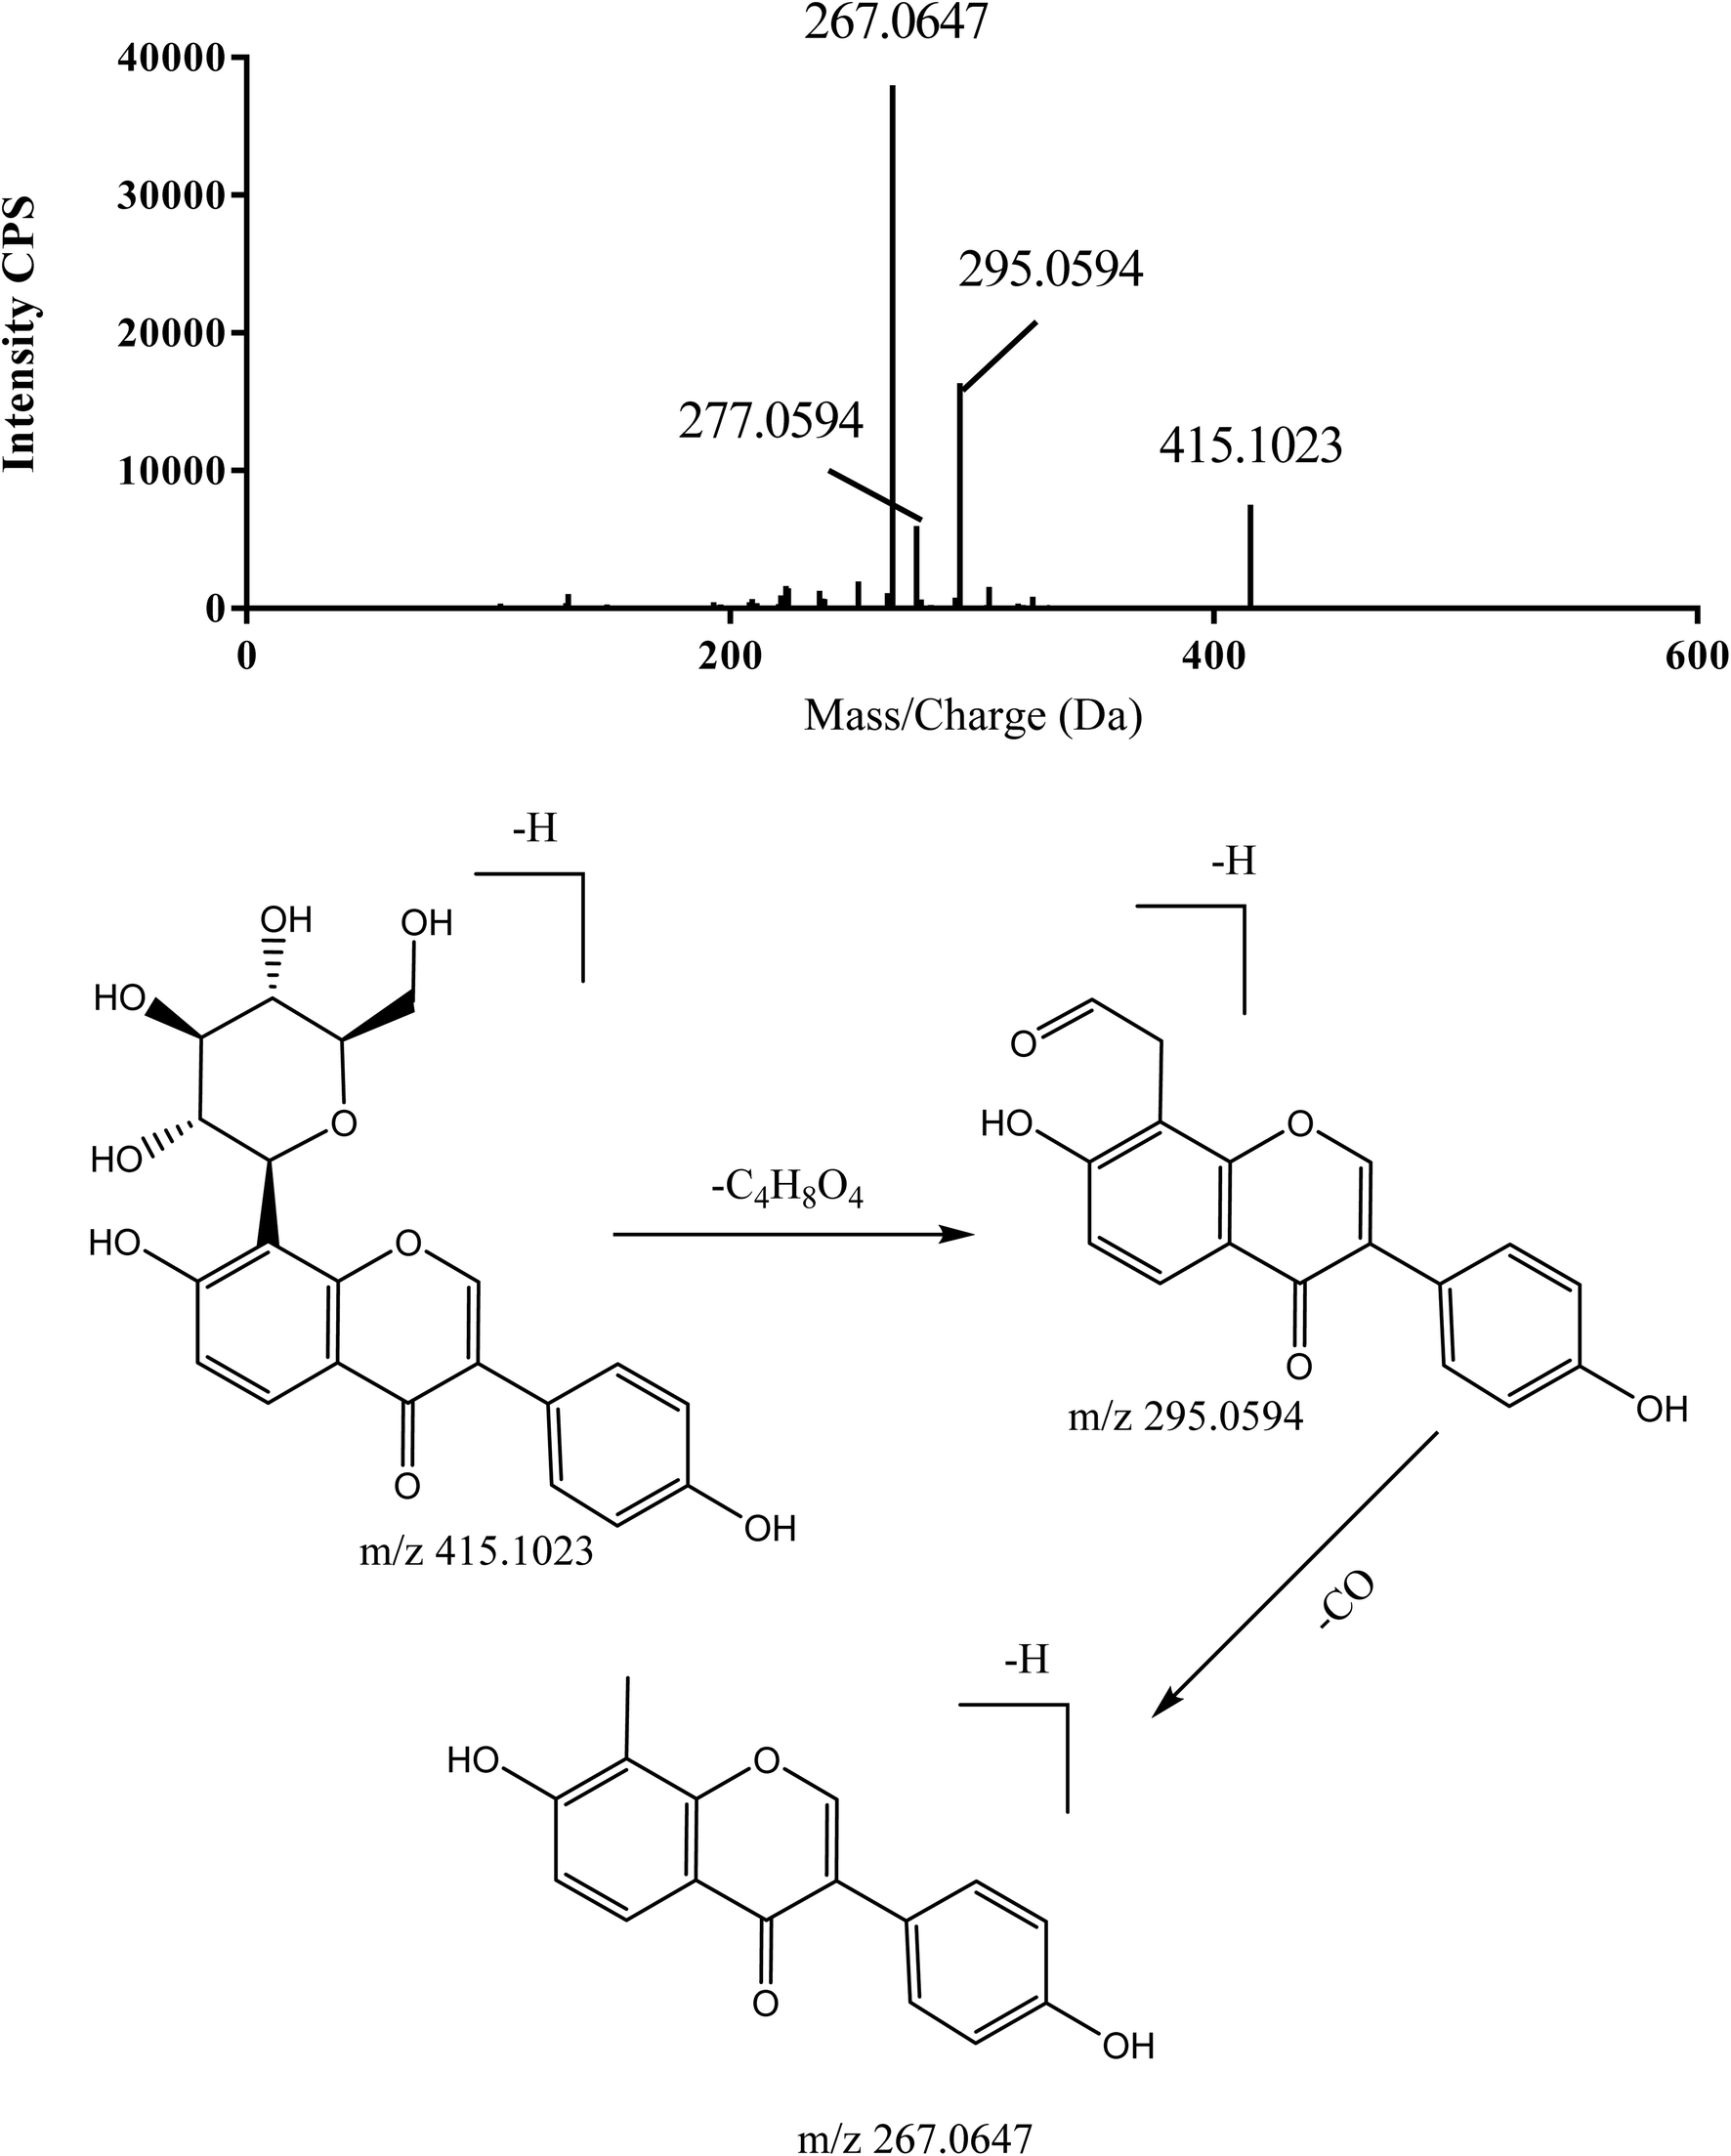
3.2.1. Identification of flavonoids. Using puerarin (C 38) as a reference standard in negative mode, its molecular weight of 415.10236 Da and mass defect at 102 mDa were calculated. Then its fragmentation ions at m/z 295.0594 [M–H–C4H8O4]−, 277.0594 [M–H–C4H8O4–H2O]−, and 267.0647 [M–H–C5H8O5]− were identified and the MS/MS information and proposed fragmentation pathway are shown in Fig. 3. According to the previous report, m/z 267.0647 can be the CF ion in the identification of isoflavone. C 73 had an RT of 23.84 min and its molecular formula (MF) was estimated to be C22H22O9 (m/z 475.1234 [M + COOH]−), which was 60 Da higher than C 38, showing the same CF at m/z 267.0647 and similar mass defect (within 50 mDa). Hence, C 73 was potentially recognized as ononin.
 |
| | Fig. 3 MS/MS information and proposed fragmentation pathway of puerarin. | |
Using narirutin (C 57) as the authentic standard in negative mode, we found a neutral loss (NL) of 308 Da (Fig. 4), and mass defect at 170 ± 80 mDa, which are important characteristics in the identification of flavonoids. Based on the NL of 308 Da and the reference standards, C 51, C 60, C 63, C 69, and C 90 were unambiguously identified as rutin, naringin, hesperidin, neohesperidin, and hesperetin, respectively.
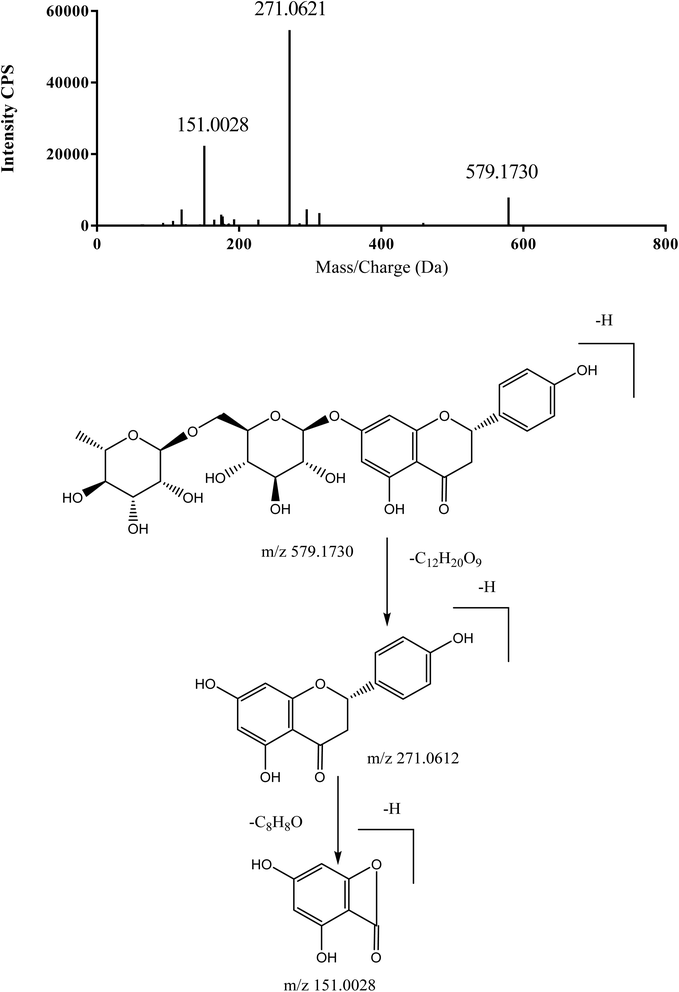 |
| | Fig. 4 MS/MS information and proposed fragmentation pathway of narirutin. | |
3.2.2. Identification of SS. SSs were separated into 3 groups, namely, SSs (Grp 1), acetyl-SSs (Grp 2), and malonyl-SSs (Grp 3). In addition to the CF and NL of saponins from Bupleuri Radix, the standard fragmentation directives are as follows: SS goes through a gradual loss of the 146 Da sugar chain, which is replaced with a rhamnose (Rha)/fucose (Fuc) molecule or replaces the 162 Da with a glucose (Glc)/galactose (Gal)/etc. Thus, aglycons are generated. Eventually, massive fragment ions form via the loss of CH3OH (32 Da) and various quantities of water molecules (18 Da). CF was observed at m/z 619 [C36H58O8]+, m/z 603 [C36H58O7]+, m/z 473 [C30H48O4]+. Moreover, the Grp I Cs had a differential neutral loss (DNL) of CH3OH (32 Da). Grp 2 Cs experienced a DNL to produce CH2CO (42 Da) due to the presence of an acetyl group. Finally, Grp III generated C3H2O3 (86 Da) due to the malonyl group. Therefore, all the SSs were quickly recognized by CF and NL. C 108, in the positive mode, had an RT of 42.1 min and its MF was estimated to be C42H68O13. Aglycons were generated via the gradual loss of Glc and Fuc; subsequently, CH3OH (32 Da) and a molecule of water were eliminated from aglycon. The fragment ion data in the positive ion mode was m/z 781.4733 [M + H]+, m/z 763.4543 [M + H–H2O]+, m/z 619.2516 [M + H–C6H10O5]+, m/z 473.2350 [M + H–C6H10O5–C6H10O4]+, m/z 441.1020 [M + H–C6H10O5–C6H10O4–CH3OH]+, and m/z 455.1356 [M + H–C6H10O5–C6H10O4–H2O]+. Thus, based on the above guidelines, C117 was recognized as SSs (Grp 1) according to the CF at m/z 619.2516 [M + H–C6H10O5]+, whereas the fragment ion at m/z 441.1020 [M + H–C6H10O5–C6H10O4–CH3OH]+ indicated the loss of CH3OH (NL of type 1). Hence, given the fragment peaks and supporting literature, C108 was estimated to be SS D. The MS/MS information and proposed fragmentation pathway are presented in Fig. 5.
 |
| | Fig. 5 MS/MS information and proposed fragmentation pathway of SS D. | |
3.2.3. Identification of triterpene saponins. The triterpene saponin displayed fragmentation, wherein the glycosyl or sugar chains, namely, Glc, arabinose (Ara), Rha, and glucuronic acid (GlcA), were eliminated to produce the aglycon structure. We demonstrated that these types of substances generated common NLs of 162 Da for Glc (C6H10O5), 176 Da for GlcA (C6H8O6), 146 Da for Rha (C6H10O4), 132 Da for Ara (C5H8O4) and 18 Da for water (H2O). Next, the C eliminated a specific quantity of H2O (18 Da), C7H4O2 (120 Da), HCOOH (46 Da), or CH3COOH (60 Da) groups. For example, C 105 showed the loss of two 176 Da (two molecules of GlcA), which indicated that this C was a triterpene saponin. Moreover, elimination of HCOOH (46 Da) and water molecules generated fragment ions at m/z 423.0104 [M–H–2C6H8O6–HCOOH]− and m/z 405.0689 [M–H–2C6H8O6–HCOOH–H2O]− (the MS/MS information and proposed fragmentation pathway in Fig. 6). Combined with the literature, this C was potentially recognized as glycyrrhizic acid.
 |
| | Fig. 6 MS/MS information and proposed fragmentation pathway of glycyrrhizic acid. | |
3.2.4. Identification of other Cs. For example, C 204 was eluted at an RT of 39.86 min, a protonated molecular ion of m/z 277.1799 (18 Da less than C 102), and its MF was estimated as C17H24O3 and mass defect at 172 mDa. MS/MS of this precursor ion produced CF at m/z 145.0652 (18 Da less than CF of C 102) and 137.0605 (as same as CF of C 102). C 102 was unambiguously identified as 6-gingerol using the authentic standard. Therefore, C 204 was speculated to be 6-shogaol. The MS/MS information and proposed fragmentation pathway of 6-shogaol are shown in Fig. 7.
 |
| | Fig. 7 MS/MS information and proposed fragmentation pathway of 6-shogaol. | |
3.3. Procedural verification
3.3.1 Selectivity and carry-over effect. To estimate the selectivity of this method, 6 individual BRP, BRP containing standards, and RRP collected from rat receiving an oral dosage of XYSJW were collected. Based on our results, no drastic interfering peaks appeared from the samples at the RTs for these analytes.After injection of the highest standards, the analyte peaks were <5% of the LLOQ in the BRP, indicating the absence of a marked carry-over effect. The typical MRM chromatograms are presented in ESI Fig. 2.†
3.3.2 Linearity and LLOQ. All calibration curves, between 2 and 2000 ng mL−1, exhibited excellent linearity with r > 0.9961. The LLOQ of all analytes was 2 ng mL−1, which is satisfactory for the pharmacokinetics study (Table 4).
Table 4 The regression equation, linear range, and lower limit of quantification (LLOQ) for the determination of the analytes in rat plasma
| Analyte |
Regression equation |
R |
Linear range (ng mL−1) |
LLOQ (ng mL−1) |
| Atractylenolide III |
Y = 0.000173X − 0.000519 |
0.9961 |
2.0–2000 |
2.0 |
| Daidzein |
Y = 0.00485X + 0.00497 |
0.9990 |
2.0–2000 |
2.0 |
| Ferulic acid |
Y = 0.00411X − 0.00433 |
0.9981 |
2.0–2000 |
2.0 |
| Geniposide |
Y = 0.00892X + 0.00724 |
1.0000 |
2.0–2000 |
2.0 |
| Glycyrrhizic acid |
Y = 0.00164X + 0.00329 |
0.9994 |
2.0–2000 |
2.0 |
| Hesperidin |
Y = 0.00456X + 0.00862 |
0.9983 |
2.0–2000 |
2.0 |
| Liquiritin |
Y = 0.0137X + 0.0185 |
1.0000 |
2.0–2000 |
2.0 |
| Magnolol |
Y = 0.0232X + 0.0197 |
0.9971 |
2.0–2000 |
2.0 |
| Meranzin hydrate |
Y = 0.0000463X + 0.0000521 |
0.9996 |
2.0–2000 |
2.0 |
| Naringin |
Y = 0.0337X + 0.0415 |
0.9994 |
2.0–2000 |
2.0 |
| Paeoniflorin |
Y = 0.00456X + 0.00862 |
0.9975 |
2.0–2000 |
2.0 |
| Puerarin |
Y = 0.000114X + 0.000114 |
1.0000 |
2.0–2000 |
2.0 |
3.3.3 Accuracy and precision. We demonstrated that our established method is both accurate and precise with intra- and inter-day accuracies (RE) between −13.45% and 12% and intra- and inter-day accuracy within ±14.37% at the 4 examined concentrations (LLOQ, L, M, and H). This result proved the accuracy, precision, and reproducibility of this method in determining Cs in RRP (ESI Table 4†).
3.3.4 Extraction recovery and matrix effect. The average extraction recoveries were in the range of 90.97% to 97.95% at 4 QC level, which is indicative of the successful extraction of the analytes from RRP using this method (ESI Table 5†). With regard to the matrix effect, the results of 90.11–97.88% were achieved for all Cs and no marked effects were seen in the determination of all the analytes.
3.3.5 Stability. In the case of stability, the long-term stability at −20 °C for 30 days, freeze-thaw stability after freeze/thaw 3 times, short-term stability at ambient temperature for 4 h, and processed-stability in an auto-sampler at 10 °C for 8 h were tested. As shown in ESI Table 6,† the results were in the range of −14.98% to +14.98%, proving that the plasma was stable under different conditions.
3.4 Pharmacokinetic study
Our established technique was effectively used toward the pharmacokinetic investigation of 30 g kg−1 XYSJW-administered depressed rats. The profiles of the average plasma concentration versus duration of each analyte are depicted in Fig. 8. The significant pharmacokinetic profiles are listed in Tables 5–7.
 |
| | Fig. 8 Mean (±SD, n = 6) plasma concentration–time profiles of twelve compounds in depression rats induced by force swimming stress. 8. | |
Table 5 Pharmacokinetic parameters of atractylenolide III, daidzein, ferulic acid and geniposide in depressed rats induced by force swimming stress after oral administration of 30 g kg−1 XYSJW
| Parameters |
Atractylenolide III |
Daidzein |
Ferulic acid |
Geniposide |
| Dose |
(mg kg−1) |
0.80 ± 0.00 |
0.73 ± 0.00 |
0.08 ± 0.00 |
1.15 ± 0.00 |
| Tmax |
(h) |
4.51 ± 3.76 |
0.29 ± 0.10 |
1,67 ± 0.41 |
1.67 ± 1.13 |
| Cmax |
(ng mL−1) |
291.00 ± 123.74 |
31.62 ± 6.58 |
35.23 ± 13.07 |
724.33 ± 330.02 |
| T1/2 |
(h) |
4.50 ± 1.19 |
3.91 ± 1.97 |
9.54 ± 3.83 |
8.00 ± 6.02 |
| AUC0-t |
(h ng mL−1) |
2270.12 ± 622.78 |
93.41 ± 13.07 |
128.52 ± 35.04 |
6041.50 ± 1723.20 |
| AUC0–∞ |
(h ng mL−1) |
2523.37 ± 634.62 |
106.88 ± 9.37 |
173.84 ± 47.70 |
6912.69 ± 1312.93 |
| Clz/F |
(mL h−1 kg−1) |
368.10 ± 110.36 |
6886.78 ± 598.63 |
467.24 ± 162.62 |
242.98 ± 124.36 |
| MRT0-t |
(h) |
9.90 ± 3.12 |
4.24 ± 0.74 |
6.59 ± 2.14 |
6.99 ± 1.29 |
| MRT0–∞ |
(h) |
16.58 ± 7.31 |
6.35 ± 2.25 |
14.03 ± 5.14 |
11.08 ± 5.72 |
Table 6 Pharmacokinetic parameters of glycyrrhizic acid, hesperidin, liquiritin and magnolol in depressed rats induced by force swimming stress after oral administration of 30g kg−1 XYSJW
| Parameter |
Glycyrrhizic acid |
Hesperidin |
Liquiritin |
Magnolol |
| Dose |
(mg kg−1) |
8.43 ± 0.00 |
61.13 ± 0.00 |
8.45 ± 0.00 |
3.55 ± 0.00 |
| Tmax |
(h) |
2.25 ± 2.82 |
0.33 ± 0.13 |
1.21 ± 1.40 |
0.33 ± 0.13 |
| Cmax |
(ng mL−1) |
16.68 ± 7.78 |
233.25 ± 119.82 |
58.70 ± 14.74 |
18.78 ± 14.80 |
| T1/2 |
(h) |
14.54 ± 3.32 |
13.27 ± 6.42 |
11.26 ± 6.79 |
12.94 ± 7.72 |
| AUC0-t |
(h ng mL−1) |
108.75 ± 58.44 |
499.61 ± 151.29 |
316.16 ± 111.56 |
33.42 ± 9.27 |
| AUC0–∞ |
(h ng mL−1) |
149.27 ± 60.85 |
574.94 ± 182.33 |
319.01 ± 189.99 |
41.52 ± 12.84 |
| Clz/F |
(mL h−1 kg−1) |
53421.79 ± 19547.67 |
90463.59 ± 13912.24 |
43021.80 ± 6734.19 |
48217.80 ± 712.78 |
| MRT0-t |
(h) |
8.26 ± 2.66 |
7.79 ± 1.04 |
9.26 ± 2.06 |
3.91 ± 1.54 |
| MRT0–∞ |
(h) |
30.88 ± 20.21 |
19.19 ± 6.19 |
30.31 ± 20.96 |
17.73 ± 1.95 |
Table 7 Pharmacokinetic parameters of meranzin hydrate, naringin, paeoniflorin and puerarin in depressed rats induced by force swimming stress after oral administration of 30 g kg−1 XYSJW
| Parameter |
Meranzin hydrate |
Naringin |
Paeoniflorin |
Puerarin |
| Dose |
(mg kg−1) |
22.41 ± 0.00 |
14.73 ± 0.00 |
37.10 ± 0.00 |
115.44 ± 0.00 |
| Tmax |
(h) |
0.96 ± 0.51 |
0.33 ± 0.13 |
2.50 ± 1.18 |
0.67 ± 0.49 |
| Cmax |
(ng mL−1) |
999.67 ± 131.67 |
43.78 ± 22.39 |
460.17 ± 280.95 |
13.37 ± 6.11 |
| T1/2 |
(h) |
9.91 ± 4.75 |
14.62 ± 6.18 |
9.73 ± 4.15 |
11.16 ± 9.34 |
| AUC0-t |
(h ng mL−1) |
4098.00 ± 396.59 |
59.08 ± 17.94 |
2011.61 ± 854.80 |
46.73 ± 16.08 |
| AUC0–∞ |
(h ng mL−1) |
5142.68 ± 1067.26 |
74.2 ± 35.32 |
2512.79 ± 1240.32 |
61.38 ± 30.21 |
| Clz/F |
(mL h−1 kg−1) |
4490.97 ± 276.78 |
127960.57 ± 8100.51 |
17676.94 ± 2273.36 |
2091817.62 ± 63106.15 |
| MRT0-t |
(h) |
6.27 ± 1.82 |
4.79 ± 4.84 |
7.60 ± 0.58 |
6.78 ± 3.68 |
| MRT0–∞ |
(h) |
12.59 ± 6.77 |
10.88 ± 7.58 |
13.29 ± 4.67 |
18.65 ± 15.66 |
3.5 Discussion
Although 225 Cs were tentatively identified in the XYSJW extract, only 20 absorbed Cs were identified in the depressed rats after oral 30 g kg−1 XYSJW extract administration using the current Q-TOF MS/MS (16 Cs) and QQQ-MS/MS (12 Cs) methods. According to the relevant literature,27 the absorption in the depressed rats was lower than that in the normal rats. In addition, the oral bioavailability of over 30% Cs in the XYSJW extract was 12.7% by screening the Traditional Chinese Medicine Systems Pharmacology Database and Analysis Platform. Therefore, only 8.5% of the 225 Cs was identified in the depressed rats. In our future investigation, the metabolites of the 225 Cs in the depressed rats will be tentatively identified and their potential pharmacological effects will be examined.
According to the area under the curve and the dosage (0.08–1.15 mg kg−1), atractylenolide III, daidzein, ferulic acid, and geniposide exhibited good oral absorption in the depressed rats in our current study. In contrast, based on our previous study,28 puerarin displayed poor oral absorption in the depressed rats with a relatively low maximum plasma drug concentration compared to the orally administered 115.44 mg kg−1 puerarin in the XYSJW extract. Ironically, although the concentration of glycyrrhetic acid was much higher than glycyrrhizic acid in the extract, glycyrrhetic acid was hardly detected in the depressed rats, which indicated that the UDP-glucuronosyl transferases were highly activated in the depressed rats after oral administration of the XYSJW extract.29 According to our current study, the CL/Fz data of atractylenolide III, ferulic acid and geniposide were not more than 500 mL h−1 kg−1, while the CL/Fz data of hesperidin, naringin and puerarin were more than 90000 mL h−1 kg−1. Compared with the literature,28,30–34 the results indicate that some metabolic enzymes in the depressed rats were activated by acute stress, while some were inhibited, highlighting the value of studying the metabolism of depression in vivo and in vitro. Thus, our future research will focus on the metabolism of XYSJW and compatibility mechanism using depressed rats and rat liver microsomes.
Moreover, the concentration of each C in the depressed rat plasma provides evidence for in vitro experiments. In our current DPPH research, the 12 absorbed Cs represented 95.7% antioxidant effect of the XYSJW extract. The antidepressant effect of the 12 absorbed Cs in this formulation will be studied in cell research and the contribution rate of each C will be published in the future.
4 Conclusions
Firstly, we developed an UFLC-Q- TOF-MS/MS method for the tentative identification of 225Cs in XYSJW extract and 20 absorbed Cs of XYSW in depressed rats. Subsequently, we established and verified a quick, selective, sensitive, and reliable UFLC-QQQ-MS/MS procedure for the simultaneous quantification of the 12 main absorbed Cs in depressed rats and their pharmacokinetics characteristics were studied further. To the best of our knowledge, this research is the first study on the chemical and pharmacokinetic profiles of XYSJW, especially in depressed rats. Our findings will be of high interest in clinical applications and in the development of anti-depressive therapy. However, this method has some limitations. Thus, to comprehend the true pharmacokinetic profiles of Cs in the XYSJW extract, we will do our best to improve our method and determine more Cs and their potential pharmacokinetic effects in depressed rats.
Conflicts of interest
The authors declare no conflicts of interest.
Acknowledgements
This project was funded by the Graduate Research and Innovation Projects of Jiangsu Province (Grant KYXC20_1512) and the National Natural Science foundation of China (grant numbers: 81973589 and 81373855).
References
- Q. Liu, H. He, J. Yang, X. Feng, F. Zhao and J. Lyu, J. Psychiatr. Res., 2020, 126, 134–140 CrossRef PubMed.
- J. C. Nelson, E. Weiller, P. Zhang, C. Weiss and M. Hobart, J. Affective Disord., 2018, 227, 103–108 CrossRef CAS PubMed.
- J. Marjoribanks, J. Brown, P. M. S. O’Brien and K. Wyatt, Cochrane Database Syst. Rev., 2013,(6), CD001396 Search PubMed.
- M. Xu, Y. Liu, Y. Guo, C. Liu, Y. Liu, Z. Yan, Y. Hou, X. Li, Q. Ma and X. Zhou, Medicine, 2020, 99, e19425 CrossRef PubMed.
- W. Dai, K. Feng, X. Sun, L. Xu, S. Wu, K. Rahmand, D. Jia and T. Han, J. Ethnopharmacol., 2021, 114692, DOI:10.1016/j.jep.2021.114692.
- Q. Ma, X. Li, Z. Yan, H. Jiao, T. Wang, Y. Hou, Y. Jiang, Y. Liu and J. Chen, Front. Psychiatry, 2019, 10, 910 CrossRef PubMed.
- L. Gao, P. Huang, Z. Dong, T. Gao, S. Huang, C. Zhou, Y. Lai, G. Deng, B. Liu and G. Wen, Front. Pharmacol., 2018, 9, 1098 CrossRef CAS PubMed.
- H. Jiao, Z. Yan, Q. Ma, X. Li, Y. Jiang, Y. Liu and J. Chen, Neuropsychiatr. Dis. Treat., 2019, 15, 21 CrossRef CAS PubMed.
- X. Guo, W. Qiu, Y. Liu, Y. Zhang, H. Zhao and J. Chen, Molecules, 2017, 22, 1386 CrossRef PubMed.
- X. Zhu, O. Xia, W. Han, M. Shao, L. Jing, Q. Fan, Y. Liu, J. Diao, Z. Lv and X. Sun, Evid.-based Complement. Altern. Med., 2014, 2014, 902516 Search PubMed.
- Z. Yan, H. Jiao, X. Ding, Q. Ma, X. Li, Q. Pan, T. Wang, Y. Hou, Y. Jiang and Y. Liu, Molecules, 2018, 23, 1073 CrossRef PubMed.
- H.-Z. Zhu, Y.-D. Liang, Q.-Y. Ma, W.-Z. Hao, X.-J. Li, M.-S. Wu, L.-J. Deng, Y.-M. Li and J.-X. Chen, Biomed. Pharmacother., 2019, 112, 108621 CrossRef CAS PubMed.
- D. N. H. Tran, I. H. Hwang, F. J. Chen, Y. P. Tseng, C. M. Chang, S. J. Tsai, J. L. Yang, T. P. Wu, C. H. Hsu, F. P. Chen and Y. Y. Kung, Integr. Med. Res., 2021, 10, 100707 CrossRef PubMed.
- Y. Tao, H. Y. Xu, S. S. Wang, B. Wang, Y. C. Zhang, W. H. Wang, B. Huang, H. W. Wu, D. F. Li, Y. Zhang, X. F. Xiao, Y. B. Li, H. J. Yang and L. Q. Huang, J. Chromatogr. B, 2013, 935, 1–9 CrossRef CAS PubMed.
- L. Shan, N. Yang, Y. Zhao, X. Sheng, S. Yang and Y. Li, J. Sep. Sci., 2018, 41, 3791–3805 CrossRef CAS PubMed.
- Y. Kitada, T. Miyauchi, A. Satoh and S. Satoh, Eur. J. Pharmacol., 1981, 72, 145–152 CrossRef CAS PubMed.
- Z. Fu, Y. Ling, Z. Li, M. Chen, Z. Sun and C. Huang, Biomed. Chromatogr., 2014, 28, 475–485 CrossRef CAS PubMed.
- T. Wu, C. Liu, Y. Huang, S. Li and Y. Wang, J. Sep. Sci., 2018, 41, 4458–4468 CrossRef CAS PubMed.
- Q. Wang, Y. Qian, Q. Wang, Y. F. Yang, S. Ji, W. Song, X. Qiao, D. A. Guo, H. Liang and M. Ye, J. Pharm. Biomed. Anal., 2015, 115, 515–522 CrossRef CAS PubMed.
- Y. F. Wong, F. Cacciola, S. Fermas, S. Riga, D. James, V. Manzin, B. Bonnet, P. J. Marriott, P. Dugo and L. Mondello, Electrophoresis, 2018, 39, 1993–2000 CrossRef CAS PubMed.
- Y. Bai, Y. Zheng, W. Pang, W. Peng, H. Wu, H. Yao, P. Li, W. Deng, J. Cheng and W. Su, Molecules, 2018, 23, 803 CrossRef PubMed.
- Y. He, Z. Li, W. Wang, S. R. Sooranna, Y. Shi, Y. Chen, C. Wu, J. Zeng, Q. Tang and H. Xie, Molecules, 2018, 23, 2189 CrossRef PubMed.
- Y. Yan, C.-Z. Chai, D.-W. Wang, X.-Y. Yue, D.-N. Zhu and B.-Y. Yu, J. Pharm. Biomed. Anal., 2013, 80, 192–202 CrossRef CAS PubMed.
- X. Nöst, E.-M. Pferschy-Wenzig, S. Nikles, X. He, D. Fan, A. Lu, J. Yuk, K. Yu, G. Isaac and R. Bauer, Molecules, 2019, 24, 3116 CrossRef PubMed.
- Z. Xue, C. Lai, L. Kang, A. Kotani, H. Hakamata, Z. Jing, H. Li, W. Wang and B. Yang, J. Chromatogr. A, 2020, 1611, 460583 CrossRef CAS PubMed.
- X. Sun, X.-b. Cui, H.-m. Wen, C.-x. Shan, X.-z. Wang, A. Kang, C. Chai and W. Li, J. Pharm. Biomed. Anal., 2017, 141, 19–31 CrossRef CAS PubMed.
- X. J. Li, W. Q. Qiu, X. L. Da, Y. J. Hou, Q. Y. Ma, T. Y. Wang, X. M. Zhou, M. Song, Q. L. Bian and J. X. Chen, Anat. Rec., 2020, 303, 2154–2167 CrossRef CAS PubMed.
- C. Shan, Q. Yuan, X. Cui, C. Chai, S. Yu, H. Wen and X. Huang, Biomed. Chromatogr., 2020, 34, e4818 CAS.
- F. Li, S. Wang, D. Lu, Y. Wang, D. Dong and B. Wu, Xenobiotica, 2017, 47, 369–375 CrossRef CAS PubMed.
- W. Li, J. Guo, Y. Tang, H. Wang, M. Huang, D. Qian and J. A. Duan, Int. J. Mol. Sci., 2012, 13, 3583–3597 CrossRef CAS PubMed.
- T. P. Hsueh and T. H. Tsai, Molecules, 2018, 23(10), 2716 CrossRef PubMed.
- J. A. Araujo-Leon, R. Ortiz-Andrade, R. A. Vera-Sanchez, J. E. Oney-Montalvo, T. I. Coral-Martinez and Z. Cantillo-Ciau, Molecules, 2020, 25(18), 4241 CrossRef CAS PubMed.
- Y. Bai, W. Peng, C. Yang, W. Zou, M. Liu, H. Wu, L. Fan, P. Li, X. Zeng and W. Su, Front. Pharmacol., 2020, 11, 364 CrossRef CAS PubMed.
- S. H. Jeong, J. H. Jang, G. Y. Lee, S. J. Yang, H. Y. Cho and Y. B. Lee, J. Pharm. Anal., 2021, 11, 444–457 CrossRef PubMed.
Footnote |
| † Electronic supplementary information (ESI) available. See DOI: 10.1039/d1ra08778a |
|
| This journal is © The Royal Society of Chemistry 2022 |
Click here to see how this site uses Cookies. View our privacy policy here. 
 Open Access Article
 This Open Access Article is licensed under a Creative Commons Attribution-Non Commercial 3.0 Unported Licence