 Open Access Article
Reaction mechanism of the green synthesis of glutaric acid†
Jie Hu ,
Chun-Sheng Cheng
 *,
Xuan Liu,
Xu Ming,
Zhen-Yun Wei and
Quan-Guo Li
Sinochem Safety Science Research (Shenyang) CO., LTD, Shenyang 110870, Liaoning, China. E-mail: chengchunsheng@sinochem.com
First published on 17th January 2022
Abstract
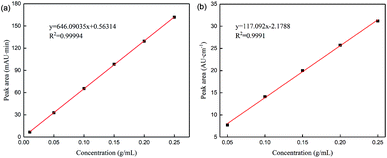
In this study, the reaction mechanism underlying the green synthesis of glutaric acid was studied via joint test technology. Density functional theory calculations were used to verify the mechanism. Quantitative analysis of glutaric acid via infrared spectroscopy and HPLC was established. The linear correlation between the two methods was good, from 0.01 to 0.25 g mL−1. The analysis results of the two methods were consistent as the reaction progressed.
1. Introduction
The concept of Quality by Design (QbD)1 has increased attention on process analytical technology (PAT).2 PAT uses automated analytical instruments and chemometrics technologies,3 and it offers real-time analysis, data processing, condition optimization, and process feedback. The entire production process is under real-time monitoring, which can make production reasonable, reduce production costs, improve product quality, and reduce environmental pollution.4,5 Online spectroscopy is an advanced instrument and a component of process analysis technology. Commonly used instruments include online infrared (IR) spectroscopy and online Raman spectroscopy.6,7 IR spectroscopy is widely used in chemical, pharmaceutical, biological, food, and other fields8–12 because of its simplicity, fast analysis speed, and non-destructive characteristics. Online spectroscopy can measure the concentrations of reactants, intermediate products, and final products during the reaction process. It can also identify the best reaction time and obtain expected reaction products. Finally, it can be used to study the reaction mechanism by comparing the disappearance and absorption of the characteristic absorption peaks.13,14Glutaric acid is a colorless and needle-like crystalline solid. Glutaric acid and its derivatives are important fine chemical raw materials and intermediates with a wide range of applications in chemical, construction, medicine, agriculture, biology, and other fields.15–17 In recent years, the green process of preparing glutaric acid by oxidizing cyclopentene with hydrogen peroxide has attracted much attention.18–22 It uses environmentally friendly, inexpensive, and easily available hydrogen peroxide to replace the traditional high-polluting oxidants that fundamentally eliminates pollution sources. Research on the reaction mechanism of the green synthesis of glutaric acid remains controversial. The reaction mechanism has the following two pathways (Scheme 1): K. Sato23 detected intermediates 2, 3, and 4 by GC in the synthesis of adipic acid. Separate experiments showed that these intermediates are oxidized to glutaric acid under similar reaction conditions, and thus path A was proposed. During the synthesis of glutaraldehyde, Dai Weilin24 et al. purified the clean intermediate 8 by flash column chromatography and characterized it by 1H NMR, MS, and IR. The reaction process was further studied by GC, and epoxycyclopentane 2 was found to be quickly transformed into intermediate 8 that was then gradually transformed into glutaraldehyde 9. Therefore, reaction path B was proposed. During the synthesis of glutaric acid, Chen Hui25 used GC to study the reaction process and detected intermediates 3, 9, and glutaric acid 7. The absence of intermediate 8 indicated that intermediate 8 was unstable. However, these data do not prove that path A does not exist; thus, it is speculated that both pathways may exist. Most research on the reaction mechanisms of green synthesis in glutaric acid is via offline GC analysis; there is no spectroscopic study on glutaric acid synthesis to date. Here, we studied the reaction mechanism of the green synthesis of glutaric acid via joint testing technology.
Studying the reaction mechanism of the green synthesis process of glutaric acid can help improve the selectivity of the experiment and can lead to higher yields. It can also explain the danger of the reaction process, improve the reaction, increase safety, and reduce economic losses.26 This work used the synthetic method proposed by Chen Hui (Scheme 2).25 Tungstic acid is the catalyst, and cyclopentene is directly oxidized by hydrogen peroxide to produce glutaric acid. The method does not use organic solvents or phase transfer catalysts. It is environmentally friendly, has good cost-effectiveness, and conforms to the concepts of green development.27
 | ||
| Scheme 2 Preparation of glutaric acid through catalytic oxidation of cyclopentene with hydrogen peroxide. | ||
This article uses joint testing technology to explore the reaction mechanism of the green synthesis process of glutaric acid. We used real-time monitoring of the change in each component of the reaction process through online IR and online Raman spectroscopy. This was combined with HPLC offline analysis at various time points. Gaussian calculation methods were used to verify the synthesis mechanism of glutaric acid. We then established a quantitative analysis method for infrared spectroscopy and HPLC, conducted quantitative analysis, and compared the glutaric acid data between methods.
2. Reagents and instrumentation
2.1 Chemical reagents
Hydrogen peroxide (50 wt%), glutaraldehyde, 25% aqueous solution (BR), tungstic acid (AR), cyclohexene (AR), adipic acid (AR), methanol (AR), potassium dihydrogen phosphate (AR), and phosphoric acid (AR) were purchased from Sinopharm Chemical Reagent Co., Ltd.; cyclopentene (purity 98%, Shanghai Aladdin Biochemical Technology Co., Ltd.), 1,2-epoxycyclopentane (purity 98%), and glutaric acid (98% purity) were purchased from Shanghai Macleans Biochemical Technology Co., Ltd., water (ultra-pure water). All reagents were used without further purification.2.2 Instruments
Online IR (ReactIR 702L, Mettler Toledo); online Raman (ReactRaman 785, Mettler Toledo); HPLC (UltiMate 3000, Thermo Scientific); fully automated synthesis reactor (EasyMax 102, Mettler Toledo); 1/100![[thin space (1/6-em)]](https://www.rsc.org/images/entities/char_2009.gif) 000 electronic balance (SQP, Sartorius); ultrasonic oscillator (AS3120, Autoscience).
000 electronic balance (SQP, Sartorius); ultrasonic oscillator (AS3120, Autoscience).
2.3 HPLC detection method
Chromatographic column: Thermo Syncronis C18 (250 mm × 4.6 mm (id), 5 μm); mobile phase: 0.01 mol L−1 potassium dihydrogen phosphate aqueous solution (phosphoric acid adjusted to pH 2–3)–acetonitrile (volume ratio 70![[thin space (1/6-em)]](https://www.rsc.org/images/entities/char_2009.gif) :
:![[thin space (1/6-em)]](https://www.rsc.org/images/entities/char_2009.gif) 30); column temperature: 30 °C; flow rate: 1.0 mL min; detection wavelength: 209 nm; injection volume: 1.0 μL.
30); column temperature: 30 °C; flow rate: 1.0 mL min; detection wavelength: 209 nm; injection volume: 1.0 μL.
2.4 Calculation method
All calculations used Gaussian 16 program with density functional theory (DFT) at the level of m062x/6-31g(d). This step optimized and analyzed the frequency of reactants, transition states, intermediates, and products.2.5 Configuration of standard solution
Glutaric acid (accurate to 0.1 mg) was placed in a 50 mL volumetric flask and dissolved in water to accurately determine the volume. We then configured these as 0.01, 0.05, 0.10, 0.15, 0.20, and 0.25 g mL−1.2.6 Green synthesis process of glutaric acid
Hydrogen peroxide (52.80 g; 0.7760 mol) and tungstic acid (1.00 g; 0.004 mol) were used as a primer. This was stirred at 43 °C for 0.5 h, and cyclopentene (12.26 g; 0.1764 mol) was added dropwise for 1 hour and then incubated for 2 h. The temperature was then increased to 95 °C for three hours, and the temperature was held constant for 5 hours.3. Results and discussion
3.1 Reaction mechanism through online spectroscopy
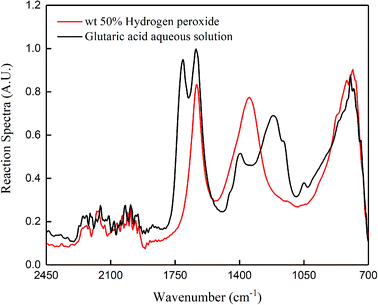
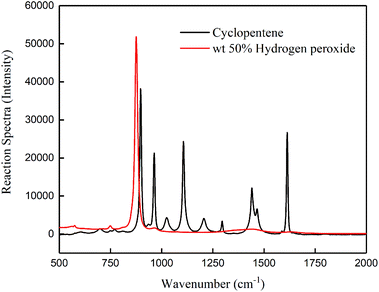
Fig. 1 shows the standard spectrum obtained by online IR scanning of 50% hydrogen peroxide and glutaric acid aqueous solution. We observed the changes in the glutaric acid based on the peak at 1707 cm−1 (C![[double bond, length as m-dash]](https://www.rsc.org/images/entities/char_e001.gif) O stretching vibration). Fig. 2 shows the standard spectrum obtained by online Raman scanning of 50% hydrogen peroxide and cyclopentene based on the peaks at 1614 cm−1 (C
O stretching vibration). Fig. 2 shows the standard spectrum obtained by online Raman scanning of 50% hydrogen peroxide and cyclopentene based on the peaks at 1614 cm−1 (C![[double bond, length as m-dash]](https://www.rsc.org/images/entities/char_e001.gif) C stretching vibration) and 876 cm−1 (O–O stretching vibration) to observe the change in cyclopentene and hydrogen peroxide.
C stretching vibration) and 876 cm−1 (O–O stretching vibration) to observe the change in cyclopentene and hydrogen peroxide.
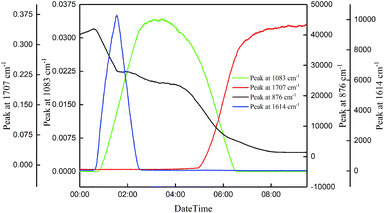
![[double bond, length as m-dash]](https://www.rsc.org/images/entities/char_e001.gif) C stretching vibration in cyclopentene) was detected by online Raman. This quickly increased to the maximum. The peak quickly disappeared after addition of cyclopentene. At the same time, online IR spectroscopy detected a peak at 1083 cm−1 (C–O stretching vibration). This increased rapidly until it plateaued. The peak gradually decreased until it disappeared as the temperature rises. The peak at 1707 cm−1 (attributable to the C
C stretching vibration in cyclopentene) was detected by online Raman. This quickly increased to the maximum. The peak quickly disappeared after addition of cyclopentene. At the same time, online IR spectroscopy detected a peak at 1083 cm−1 (C–O stretching vibration). This increased rapidly until it plateaued. The peak gradually decreased until it disappeared as the temperature rises. The peak at 1707 cm−1 (attributable to the C![[double bond, length as m-dash]](https://www.rsc.org/images/entities/char_e001.gif) O stretching vibration in glutaric acid) was detected by online IR spectroscopy, and it gradually rises and plateaus.
O stretching vibration in glutaric acid) was detected by online IR spectroscopy, and it gradually rises and plateaus.
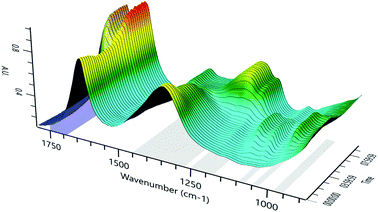
Fig. 4 displays a three-dimensional spectrum obtained by online IR spectroscopy during the reaction process, which shows the changes in each component during the reaction process in more detail and more intuitively. The figure shows the peaks at 1083 cm−1, 1037 cm−1 (C–O stretching vibration), and 965 cm−1 (O–O asymmetric stretching vibration). These then disappear at the end of the reaction. The trend in the change is also consistent: we speculated that these changes are the characteristic absorption peaks of the same intermediate, which is consistent with the IR spectrum of intermediate 8.24 Concurrently, we show that intermediate 8 is relatively stable in the system in contrast to prior work.25
The results show that cyclopentene is first oxidized to produce intermediate 8, which is relatively stable at low temperatures. As the temperature rises, intermediate 8 is gradually converted into glutaric acid according to path B described in Scheme 1.
3.2 HPLC analysis results and discussion
Samples were taken every 0.5 h and analyzed by HPLC (Fig. 5). When the dropwise cyclopentene addition is over, the response value of intermediate 8 reaches its highest value, and there is basically no change during the heat-preservation process. The response value of the intermediate gradually decreases as the temperature rises, and glutaraldehyde 9 is produced concurrently. After 5.5 hours, glutaric acid 7 appeared in sampling analysis, and the response value of glutaric acid 7 gradually increased as the reaction proceeded. The response value of glutaric acid was constant after 8 hours of reaction.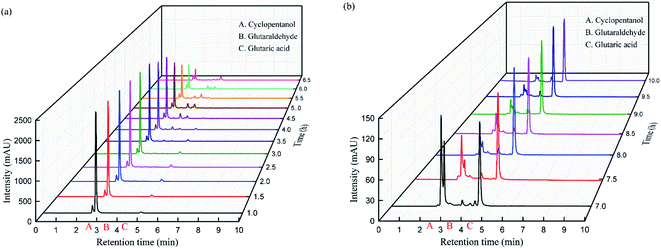 | ||
| Fig. 5 HPLC results of the green synthesis of glutaric acid. (a) 1.0 to 6.5 hours. (b) 7.0 to 10.0 hours. | ||
3.3 Reaction mechanism
The combination of online spectroscopy and HPLC showed that cyclopentene 1 is oxidized to intermediate 8 and then intermediate 8 is converted to glutaraldehyde 9. Finally, glutaraldehyde 9 is oxidized to produce glutaric acid 7 (Scheme 3). The reaction mechanism is basically the same as the path B reported in Scheme 1. The difference is that intermediate 8 is relatively stable.3.4 Theoretical calculation and verification
We also used Gaussian to perform theoretical calculations on the reaction process and evaluate the reaction pathway by comparing the energy required to form a transition state during the reaction process.30–34 The difference in reaction mechanism is mainly in the ring-opening reaction of 1,2-epoxide; thus, only the calculation of the process is performed. The acidic ring-opening reaction mechanism of 1,2-epoxide is shown in Scheme 4.35 Under these acidic conditions, the oxygen atom is protonated and positively charged in the epoxide; the nucleophile attacks the adjacent carbon atom to cause a SN2 (ref. 36) reaction.The calculation results of the acidic ring-opening reaction of 1,2-epoxide during the synthesis of glutaric acid is shown in Fig. 6. The calculated activation free energy is 11.97 kcal mol−1 in pathway A of the TS2 transition state. The calculated activation free energy of 11.38 kcal mol−1 is lower than that from route B. The results show that pathway B has a lower reaction energy barrier than pathway A and is more likely. The calculated results are consistent with the experimental results.
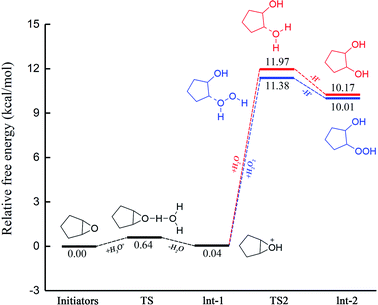 | ||
| Fig. 6 Comparison of the free energy of the two reaction pathways of the ring-opening reaction of 1,2-epoxide in the green synthesis of glutaric acid. | ||
3.5 Quantitative analysis
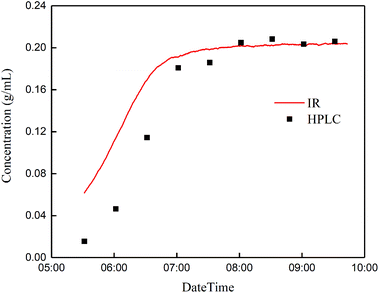
![[double bond, length as m-dash]](https://www.rsc.org/images/entities/char_e001.gif) O stretching vibration) of the product glutaric acid. During the gradual conversion of glutaraldehyde to glutaric acid, the concentration of glutaric acid obtained by online IR spectroscopy is increasingly consistent with the concentration of glutaric acid obtained by HPLC. Until glutaraldehyde is completely converted to glutaric acid, the concentration of glutaric acid remains basically constant, and the results of the two methods are consistent.
O stretching vibration) of the product glutaric acid. During the gradual conversion of glutaraldehyde to glutaric acid, the concentration of glutaric acid obtained by online IR spectroscopy is increasingly consistent with the concentration of glutaric acid obtained by HPLC. Until glutaraldehyde is completely converted to glutaric acid, the concentration of glutaric acid remains basically constant, and the results of the two methods are consistent.
4. Conclusions
We evaluated the reaction mechanism underlying the green synthesis of glutaric acid via online and offline analyses. Online spectroscopy and offline HPLC analyzed the concentration of each component during the reaction process. The reaction mechanism was found to follow route B. Gaussian calculations of the free energy change during the acidic ring-opening process of 1,2-epoxide were compared to the reaction energy barriers of different pathways. The results show that the reaction mechanism conformed to path B, which is consistent with the experimental results. Finally, a quantitative analysis method for IR spectroscopy of glutaric acid was established and verified and compared with HPLC. The linear correlation between the two methods was good from 0.01 to 0.25 g mL−1. The concentration measured by online IR spectroscopy was higher than that measured by HPLC when the reaction was incomplete because of the influence of glutaraldehyde. The results from the two methods gradually became similar as the reaction proceeded.In conclusion, online spectroscopic analysis technology can monitor changes in each component during the reaction process in real-time. The results can show whether an active intermediate has been formed. Offline analysis technology and Gaussian calculations can further explore the reaction mechanism. In addition, online IR spectroscopy can be used for quantitative analysis and real-time monitoring of changes in concentration. This can eliminate the need for offline sampling.
Author contributions
Conceptualization: Chun-Sheng Cheng, Zhen-Yun Wei and Jie Hu; methodology: Xuan Liu, Xu Ming and Quan-Guo Li; resources: Chun-Sheng Cheng and Zhen-Yun Wei; writing (original draft preparation): Jie Hu; writing, review, and editing: Chun-Sheng Cheng and Zhen-Yun Wei.Conflicts of interest
There are no conflicts to declare.Acknowledgements
The authors thank for Shenyang Shenhua Institute Testing Technology Co., Ltd providing the LC-MS results.References
- A. S. Rathore, Roadmap for implementation of quality by design (QbD) for biotechnology products, Trends Biotechnol., 2009, 27(9), 546–553 CrossRef CAS PubMed.
- M. Ulmschneider and Y. Roggo, Process Analytical Technology, American Cancer Society, 2010 Search PubMed.
- H. Yuan and W. Lu, Commonly used chemometric methods in modern spectroscopy analysis, Modern Scientific Instruments, 1998, pp. 6–9 Search PubMed.
- P. Hamilton, M. J. Sanganee and J. P. Graham, et al., Using PAT To Understand, Control, and Rapidly Scale Up the Production of a Hydrogenation Reaction and Isolation of Pharmaceutical Intermediate, Org. Process Res. Dev., 2015, 19(1), 236–243 CrossRef CAS.
- J. Workman Jr, M. Koch and D. J. Veltkamp, Process Analytical Chemistry, Anal. Chem., 2005, 77(12), 3789–3806 CrossRef PubMed.
- B. C. Smith, Fundamentals of Fourier Transform Infrared Spectroscopy, CRC Press, 2nd edn, 2011 Search PubMed.
- I. M. Clegg, J. Pearce and S. Content, In Situ Raman Spectrosco-py: A Process Analytical Technology Tool to Monitor a De-protection Reaction Carried Out in Aqueous Solution, Appl. Spectrosc., 2012, 66(2), 151–156 CrossRef CAS PubMed.
- A. Hart, S. A. Kelley and T. Harless, et al., An efficient method for the reductive conversion of acyclic esters to ethers via a TMS-protected acetal, Tetrahedron Lett., 2017, 58(31), 3024–3027 CrossRef CAS.
- E. Shane and A. Raymond, et al., Utilization of React IR in Fit for Purpose Process Enablement, Org. Process Res. Dev., 2015, 19(1), 244–248 CrossRef.
- Z. Zhang, Y. B. Han and J. Guin, et al., Asymmetric counteranion-directed Lewis acid organocatalysis for the scalable cyanosilylation of aldehydes, Nat. Commun., 2016, 7(1), 12478 CrossRef CAS PubMed.
- W. Shi, Y. Luo and X. Luo, et al., Investigation of an Efficient Pal-ladium-Catalyzed C(sp)C(sp) Cross-Coupling Reaction Using Phos-phineOlefin Ligand: Application and Mechanistic Aspects, ChemInform, 2009, 40(44), 14713–14720 Search PubMed.
- K. S. Rao, F. St-Jean and A. Kumar, Quantitation of a Ketone Enolization and a Vinyl Sulfonate Stereoisomer Formation Using Inline IR Spectroscopy and Modeling, Org. Process Res. Dev., 2019, 23(5), 945–951 CrossRef CAS.
- J. N. Payette and H. Yamamoto, Nitrosobenzene-mediated C-C bond cleavage reactions and spectral observation of an oxazetidin-4-one ring system, ChemInform, 2009, 40(37), 12276–12278 Search PubMed.
- P. Reich, Infrared and Raman Spectroscopy. Methods and Applications, Z. Phys. Chem., 1998, 205(1), 127–128 CrossRef.
- M. Besson, F. Gauthard and B. Horvath, et al., Catalytic Oxidation with Air of Cyclohexanone to Dicarboxylic Acids on Synthetic Carbons. Effect of Supported Metals and Solvents, J. Phys. Chem. B, 2005, 109(6), 2461–2467 CrossRef CAS PubMed.
- J. Li, X. Gao and S. Ding, et al., Separation and preparation of high-purity glutaric acid from mixed dicarboxylic acids, Chem. Ind. Eng., 2011, 2011(1), 53–56 Search PubMed.
- Y. Zhou, Coupling separation and purification of glutaric acid by solution crystallization-melting crystallization, Hebei University of Technology., 2019 Search PubMed.
- X. Xu, H. Chen, J. Deng and A. Jiang, Hydrogen peroxide aqueous solution catalyzed oxidation of cyclopentene to produce glutaraldehyde, Acta Chim. Sin., 1993, 4(4), 399–403 Search PubMed.
- E. Antonelli, R. D’Aloisio and M. Gambaro, et al., Efficient Oxidative Cleavage of Olefins to Carboxylic Acids with Hydrogen Peroxide Catalyzed by Methyltrioctylammonium Tetrakis(oxodiperoxotungsto)phosphate(3-) under Two-Phase Conditions. Synthetic Aspects and Investigation of the Re, J. Org. Chem., 1998, 63(21), 7190–7206 CrossRef CAS PubMed.
- J. Minghui, H. Shu and H. Li, et al., Microwave promotes the oxidation of cyclopentene to glutaric acid, Guangdong Chem. Ind., 2009, 2009(11), 8–9 Search PubMed.
- D. Zhu, Study on the synthesis of epoxycyclopentane and glutaric acid, Zhengzhou University, 2010 Search PubMed.
- G. Zhang, Research on the green synthesis process and heterogeneous catalyst of glutaric acid, Qingdao University of Science and Technology, 2017 Search PubMed.
- K. Sato, M. Aoki and R. Noyori, A 'Green' Route to Adipic Acid: Direct Oxidation of Cyclohexenes with 30 Percent Hydrogen Peroxide, Science, 1998, 281(5383), 1646–1647 CrossRef CAS PubMed.
- W. Dai, H. Yu, J. Deng and A. Jiang, Study on the catalytic oxidation of cyclopentene to glutaraldehyde by aqueous hydrogen peroxide solution, Acta Chim. Sin., 1995, 2, 188–192 Search PubMed.
- C. Hui, Research on the green synthesis process and new catalyst of glutaric acid, Fudan University, 2007 Search PubMed.
- S. Aperger, Chemical Kinetics and Reaction Mechanisms, Van Nostrand Reinhold Co., 2003 Search PubMed.
- W. Jiang, L. Ni and J. Jiang, et al., Thermal hazard and reaction mechanism of the preparation of adipic acid through the oxidation with hydrogen peroxide, AIChE J., 2020, 67(1), e17089 Search PubMed.
- Y. Chae, S. Min and E. Park, et al., Real-Time Reaction Monitoring with In Operando Flow NMR and FTIR Spectroscopy: Reaction Mechanism of Benzoxazole Synthesis, Anal. Chem., 2021, 93(4), 2106–2113 CrossRef CAS PubMed.
- D. L. Pavia, G. M. Lampman and G. S. Kriz, Introduction to spectroscopy: a guide for students of organic chemistry, Brooks/Cole, 2009 Search PubMed.
- G. J. Cheng, X. M. Zhong and Y. D. Wu, et al., Mechanistic under-standing of catalysis by combining mass spectrometry and computation, Chemical Communications, 2019, 55, 12749–12764 RSC.
- S. Essiz and U. Bozkaya, Computational Study for the Reaction Mechanism of N-Hydroxyphthalimide-Catalyzed Oxidative Cleavage of Alkenes, J. Org. Chem., 2020, 85(15), 10136–10142 CrossRef CAS PubMed.
- Q. Liu, Y. Lan and J. Liu, et al., Revealing a Second Transmetalation Step in the Negishi Coupling and Its Competition with Reductive Elimination: Improvement in the Interpretation of the Mechanism of Biaryl Syntheses, J. Am. Chem. Soc., 2009, 131(29), 10201–10210 CrossRef CAS PubMed.
- G. J. Cheng, X. Zhang and L. W. Chung, et al., Computational Organic Chemistry: Bridging Theory and Experiment in Establishing the Mechanisms of Chemical Reactions, J. Am. Chem. Soc., 2015, 137(5), 1706–1725 CrossRef CAS PubMed.
- S. Mohseni, M. Bakavoli and A. Morsali, Theoretical and experimental studies on the regioselectivity of epoxide ring opening by nucleophiles in nitromethane without any catalyst: nucleophilic-chain attack mechanism, Prog. React. Kinet. Mech., 2014, 39(1), 89–102 CrossRef CAS.
- Q. Xing, Basic Organic Chemistry, Higher Education Press, 1983 Search PubMed.
- F. Carrion and M. Dewar, et al., Ground states of molecules. 59. MNDO study of SN2 reactions and related processes, J. Am. Chem. Soc., 1984 Search PubMed.
Footnote |
| † Electronic supplementary information (ESI) available. See DOI: 10.1039/d1ra08650b |
| This journal is © The Royal Society of Chemistry 2022 |


