 Open Access Article
Influence of zirconia addition in TiO2 and TiO2–CeO2 aerogels on the textural, structural and catalytic properties of supported vanadia in chlorobenzene oxidation
Chiraz Gannoun *a,
Abdelhamid Ghorbelb and
Eric M. Gaigneaux
 c
c
aCentre National des Recherches en Sciences des Matériaux (CNRSM), Technopôle, Borj Cedria, BP73, 8027 Soliman, Tunisia. E-mail: gannoun.chiraz@gmail.com
bLaboratoire de Chimie des Matériaux et Catalyse, Département de Chimie, Faculté des Sciences de Tunis, Campus Universitaire, 2092 El Manar Tunis, Tunisia
cUniversité Catholique de Louvain, Institute of Condensed Matter and Nanosciences (IMCN), Division “Molecular Chemistry, Materials and Catalysis (MOST)”, Place Louis Pasteur 1 L4.01.09, B-1348 Louvain-la-Neuve, Belgium
First published on 7th April 2022
Abstract
This paper studies the effect of the direct incorporation of ZrO2 in TiO2 and TiO2–CeO2 aerogel supports prepared by sol–gel route on the physico–chemical and catalytic properties of supported vanadia catalysts in the total oxidation of chlorobenzene. The obtained catalysts have been characterized by means of ICP-AES, N2 adsorption–desorption at 77 K, XRD, XPS, H2-TPR and NH3-TPD. The results revealed that Zr-doped V2O5 based catalyst is beneficial for the improvement of catalytic properties in chlorobenzene total oxidation. In particular, in the absence of cerium groups, this beneficial effect is correlated with the better acidic properties or/and the stabilization of the V2O5 active phase in a higher oxidation state. However, in the case of cerium rich catalyst, this positive effect is much stronger thanks to the enhanced redox properties of V2O5/TiO2–CeO2–ZrO2.
1. Introduction
Vanadia based TiO2 materials constitute a very important class of catalytic materials resistant against chlorinated volatile organic compounds (Cl-VOCs) released in the atmosphere.1–5 The latter have been considered to be very toxic, carcinogenic and environmentally persistent organic pollutants.3,6,7 The catalytic destruction of chlorinated VOCs to COx, H2O, HCl and Cl2 appears as a very promising solution since it allows destroying these pollutants without deactivation of V2O5/TiO2 catalysts by chlorine poisoning on their surfaces.3Besides, we have demonstrated that the direct incorporation of cerium species in the TiO2 aerogel support prepared by the sol gel route has generated great interest in the catalytic performances of the V2O5/TiO2 catalyst in the total oxidation of chlorobenzene.8 The success of the use of cerium oxide as a promoter of the V2O5/TiO2 material is due to its oxygen storage and reduction/oxidation properties.9–11 In fact, labile oxygen vacancies and bulk oxygen species with relatively high mobility are easily formed during the redox shift between Ce3+ and Ce4+ under oxidizing and reducing conditions. The mechanism of the oxidation reactions of Cl-VOCs over ceria is usually considered to be of the redox or Mars and van Krevelen type. The key step of this mechanism is that CeO2 supplies active oxygen to the vanadium species that are reduced during the catalytic reaction.8
However, the capabilities of the redox couple Ce4+/Ce3+ could be strongly enhanced if other elements are introduced into the CeO2 lattice. Among various elements, the introduction of zirconium in the lattice of CeO2 is particularly effective in the enhancement of the storage/release capacity and redox properties of CeO2.12,13
On the other hand, the combined TiO2–ZrO2 mixed oxide has also attracted considerable attention recently as active catalyst as well as support for a wide variety of catalytic applications.14–20 In fact, it is established in the literature that mixing these two dissimilar oxides could lead to totally different physico–chemical properties and catalytic behavior since they are liable to form new stable compounds.21 Such advanced titania–zirconia mixed oxides not only take advantage of both TiO2 (active catalyst and support) and ZrO2 (acid–base properties), but also extend their application through the generation of new catalytic sites due to a strong interaction between them.21 In fact, the facile formation of zirconium titanate (ZrTiO4) compound between ZrO2 and TiO2 allows excellent catalytic properties for various reactions.21
Therefore, given the favorable characteristics of zirconia, the aim of this work is to study the effect of the direct incorporation of ZrO2 in TiO2 and TiO2–CeO2 aerogel supports prepared by sol–gel route on the physico–chemical and catalytic properties of supported vanadia catalysts in the total oxidation of chlorobenzene.
To determine the physico–chemical properties of various samples elaborated, different characterization techniques namely, BET surface area, inductively coupled plasma-atomic emission spectroscopy (ICP-AES), X-ray diffraction (XRD), temperature-programmed reduction (TPR) with H2, temperature-programmed desorption of ammonia (NH3-TPD) and in situ diffuse reflectance infrared spectroscopy (DRIFTS) were employed.
2. Experimental
2.1 Elaboration of catalysts
TiO2, TiO2–ZrO2, TiO2–CeO2 and TiO2–CeO2–ZrO2 supports were prepared via sol–gel method as follows: titanium(IV) isopropoxide (Aldrich, 98%), as precursor, with anhydrous ethanol (Aldrich, 98%), as solvent, was chemically modified by adding acetylacetone (Fluka, 99%) according to a molar ratio acetylacetone/Ti = 1 in order to control hydrolysis and condensation reaction rates. This solution was maintained for 1 h under stirring. To obtain mixed oxides, cerium nitrate (Aldrich, 99.5%) or/and zirconium acetylacetonate (Aldrich, 98%) were added to titanium isopropoxide according to molar ratios Ce/Ti = 0.1 and Zr/Ti = 0.1. Homogenous gels are obtained by hydrolysis and condensation after HNO3 supply. The amount of distilled water added corresponded to the molar ratio H2O/Ti = 10. The gels were thereafter transformed into aerogels by drying under supercritical conditions of ethanol (P = 63 bars, T = 243 °C).Catalysts with nominal vanadia loading of 2 wt% were elaborated by impregnating 2 g of support with 4 ml of an acetone solution of vanadyl acetylacetonate (Fluka, 95%).
The obtained solids are then dried in an oven at 60 °C for 24 h. Finally, catalysts are calcined for 3 h at 500 °C under flowing O2 (30 ml min−1) and denoted respectively VTi, VTiZr, VTiCe and VTiCeZr.
2.2 Characterization of catalysts
2.3 Catalytic test
Catalytic tests were performed with 200 mg of catalyst (200–315 μm) diluted in 800 mg of inactive glass spheres with diameters in the range 315–500 μm in a metallic fixed-bed micro-reactor (PID Eng&Tech, Madrid, Spain) operating at atmospheric pressure and fully monitored by computer. The gas stream was composed of 100 ppm of chlorobenzene, 20 vol% of O2 and helium as diluting gas to obtain 200 ml min−1 (space velocity (VVH) = 37![[thin space (1/6-em)]](https://www.rsc.org/images/entities/char_2009.gif) 000 h−1). The reaction was run from 100 to 400 °C by steps of 50 °C. At each temperature investigated, the catalyst was stabilized for 150 min in order to reach steady state. Analysis of the reactants and products was continuously performed by on line gas chromatography (GC). The GC allowed chlorobenzene, O2, CO, and CO2 to be quantified and other chlorohydrocarbons to be detected. To calculate the conversion, only the concentrations of the reactants and products measured after stabilization and averaged in a period of time from 100 to 150 minutes were taken into account. The measured performances were accurate within a range of about 1% (in relative) for the conversion of chlorobenzene. Analysis of reactants and products was continuously performed by on line gas chromatography (GC).
000 h−1). The reaction was run from 100 to 400 °C by steps of 50 °C. At each temperature investigated, the catalyst was stabilized for 150 min in order to reach steady state. Analysis of the reactants and products was continuously performed by on line gas chromatography (GC). The GC allowed chlorobenzene, O2, CO, and CO2 to be quantified and other chlorohydrocarbons to be detected. To calculate the conversion, only the concentrations of the reactants and products measured after stabilization and averaged in a period of time from 100 to 150 minutes were taken into account. The measured performances were accurate within a range of about 1% (in relative) for the conversion of chlorobenzene. Analysis of reactants and products was continuously performed by on line gas chromatography (GC).
3. Results and discussion
3.1 Elemental analysis
Nominal and experimental chemical compositions of the VTi, VTiZr, VTiCe and VTiCeZr samples are compared in Table 1. The results indicate a good agreement with the nominal compositions revealing that vanadium, zirconium and cerium were successfully incorporated in the catalysts. The small difference observed may result from inaccuracies in the preparation of the solution of samples for ICP analysis (ca. weighing).| Catalyst | Bulk composition (wt%) | Nominal composition (wt%) | ||||
|---|---|---|---|---|---|---|
| V | Ce | Zr | V | Ce | Zr | |
| VTi | 1.6 | 1.1 | ||||
| VTiCe | 1.08 | 14.22 | 1.1 | 14.4 | ||
| VTiZr | 0.99 | 12.34 | 1.1 | 12.4 | ||
| VTiCeZr | 1.02 | 14.36 | 12.23 | 1.1 | 14.4 | 12.4 |
3.2 N2-adsorption–desorption at 77 K
The specific surface areas and pore diameters of TiO2, TiO2–ZrO2, TiO2–CeO2 and TiO2–CeO2–ZrO2 aerogel supports (as references) and VTi, VTiZr, VTiCe and VTiCeZr catalysts, calcined at 500 °C are given in Table 2.| Sample | Surface area (m2 g−1) | Pore diameter (Å) |
|---|---|---|
| TiO2 | 115 | 80 |
| TiO2–CeO2 | 140 | 174 |
| TiO2–ZrO2 | 110 | 137 |
| TiO2–CeO2–ZrO2 | 94 | 134 |
| VTi | 136 | 98 |
| VTiCe | 141 | 114 |
| VTiZr | 128 | 139 |
| VTiCeZr | 102 | 95 |
All solids are classified as mesoporous materials (pores between 20 and 500 Å) and exhibited specific surface areas higher than industrial TiO2 such as TiO2 Degussa P 25, which is a mixture of anatase (70%) and rutile (30%) and which has a surface area of 50 m2 g−1.22
From Table 2, it can be seen that specific surface area of aerogel TiO2 support synthesized by one-pot sol–gel method appeared to depend only on the cerium content. In fact, CeO2 is beneficial for the specific surface area of TiO2 aerogel which increases from 115 m2 g−1 to 140 m2 g−1 after incorporation of ceria. However, doping TiO2 with ZrO2 allows preserving its pristine specific surface area.
Furthermore, the TiO2–CeO2 sample exhibits specific surface area of 140 m2 g−1. A steady decrease from 140 to 94 m2 g−1 is observed in the case of TiO2–CeO2–ZrO2 aerogel support. The observed decrease could be due to the penetration of the dispersed zirconium oxide into the pores of TiO2–CeO2 support, thereby narrowing its pore diameter and blocking some of the pores.23
On the other hand, vanadia based materials were found to display greater or quiet similar specific surface area than TiO2, TiO2–ZrO2, TiO2–CeO2 and TiO2–CeO2–ZrO2 supports. It is probable that this effect is due to the elaboration route of vanadia based materials which occurs in two steps.
N2 adsorption–desorption isotherms at 77 K and pore size distribution curves of Ti, TiCe, TiZr, TiCeZr (as references) and VTi, VTiCe, VTiZr and VTiCeZr are displayed in Fig. 1 and 2, respectively. According to the IUPAC classification,24 all the samples are characterized by the type IV isotherms (behavior characteristic of mesoporous materials) with hysteresis loops type H1 characteristic of porous materials.24
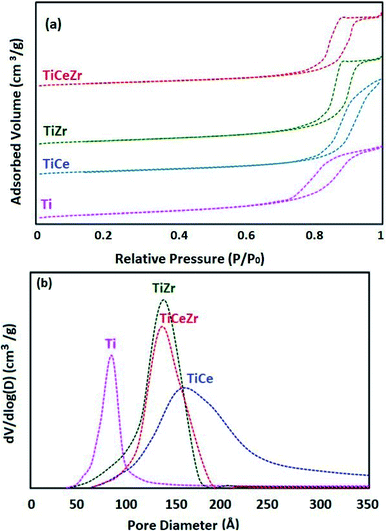 | ||
| Fig. 1 Textural properties of Ti, TiCe, TiZr and TiCeZr supports: (a) N2 adsorption–desorption isotherms and (b) pore size distribution curves. | ||
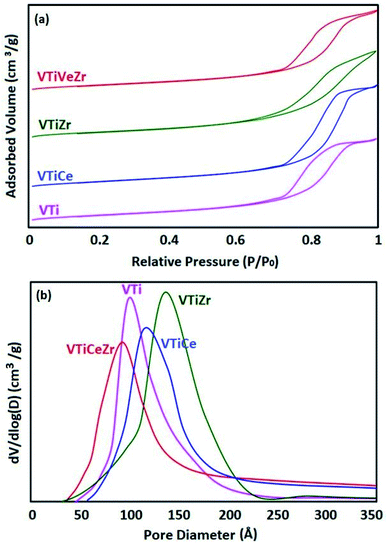 | ||
| Fig. 2 Textural properties of VTi, VTiCe, VTiZr and VTiCeZr supports: (a) N2 adsorption–desorption isotherms and (b) pore size distribution curves. | ||
It is clearly seen from the pore size distribution curves of the supports that the modification of TiO2 by CeO2, ZrO2 or CeO2–ZrO2 contributes to the enlargement of its pors. The observed increase in the diameter of pores could result from the combination of different pore sizes derived from TiO2 particle and TiO2–ZrO2 or TiO2–CeO2 particle on the other hand.25,26
After vanadium impregnation, the average pore diameter of TiO2 increases leading to clear changes in the textural properties. These results could be attributed to the reorganization of TiO2 crystallites sizes after vanadium impregnation.27
In the case of ceria rich catalysts, a decrease in the average pore diameter is observed which could be due to the plugging of the small pores by cerium incorporation.28 On the contrary, V2O5–TiO2 and V2O5–TiO2–ZrO2 samples had narrow BJH pore size distributions with diameters centered at 137 Å and 139 Å (Table 2), demonstrating that the doping of zirconium stabilized the mesoporous structure.29
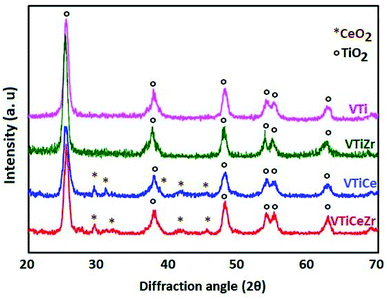
3.3 X-ray diffraction
The XRD patterns of VTi, VTiZr, VTiCe and VTiCeZr samples calcined at 500 °C are shown in Fig. 3. Only the broad diffraction lines due to TiO2 anatase with high cristallinity such as 2θ = 25°, 37°, 48° and 53° (PDF-ICDD 21-1272) plus a few peaks belonging to cubic CeO2 at 2θ = 28.5°, 33.3° and 47.4° (PDF 00-034-0394) are identified.The absence of characteristic lines of ZrO2 at 2θ values around 28.2°, 31.5°, 38.5°, 50.1°, and 59.8° (ICDD file no. 37-1484) indicates that ZrO2 is dispersed on TiO2 and TiO2–CeO2 supports.30
In addition, the absence of crystalline features of V2O5 in the case of the vanadia based materials indicates that vanadium oxide is also dispersed on the surface of the support as vanadates or under the form of small vanadia crystallites undetectable via XRD.31
3.4 X-ray photoelectron spectroscopy
To investigate the surface composition of the catalysts, XPS measurements were performed. The electron binding energies (eV) of Ti 2p, Ce 3d, Zr 3d and V 2p and the surface atomic ratios V/Ti, V/(Ti + Zr),V/(Ti + Ce), V/(Ti + Ce + Zr) are displayed in Table 3.| Catalyst | Binding energy (eV) | Atomic ratio V/X (X = Ti, Ti + Zr, Ti + Ce, Ti + Zr + Ce) | ||||||||
|---|---|---|---|---|---|---|---|---|---|---|
| Ti 2p3/2 | Ce 3d5/2 | Zr 3d3/2 | Zr 3d5/2 | V5+ 2p3/2 | V4+ 2p3/2 | V/Ti | V/(Ti + Zr) | V/(Ti + Ce) | V/(Ti + Ce + Zr) | |
| VTi | 458.2 | — | — | 517.2 | 515.9 | 0.032 | — | — | — | |
| VTiCe | 458.5 | 884.5 | — | 517.3 | 515.7 | — | — | 0.077 | — | |
| VTiZr | 485.3 | — | 182.0 | 184.6 | 517.3 | — | — | 0.019 | — | — |
| VTiZrCe | 485.2 | 182.2 | 184.4 | 517.3 | — | — | — | — | 0.047 | |
Table 3 reveals that vanadia spreads more on the surface of TiO2 and TiO2–CeO2 aerogel supports in the absence of zirconium since ratios (V/Ti and V/(Ti + Ce)) diminish when zirconia was incorporated.
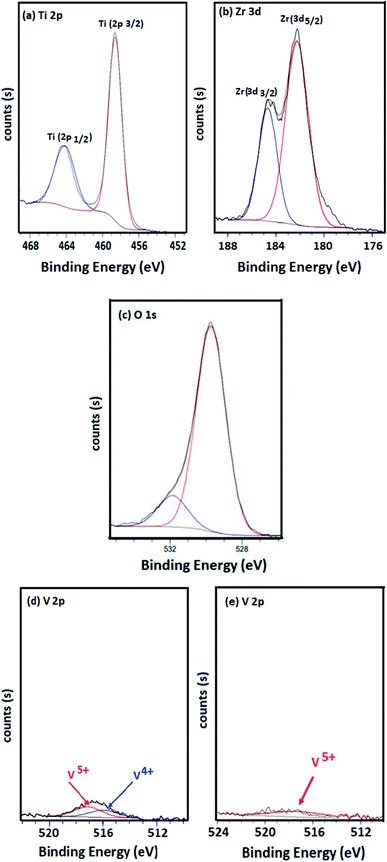
The XPS spectra of Ti, Zr, O, Ce and V are presented in Fig. 4. The binding energies of Ti 2p3/2 and Ti 2p1/2 were found around 459 and 464 eV for all catalysts. These mentioned results were illustrated in Fig. 4(a). A contribution with binding energies around 182 and 184 eV was detected for samples containing zirconia (Fig. 4(b)). These peaks concerned Zr 3d3/2 and Zr 3d5/2. Both Ti 2p and Zr 3d binding energies revealed the presence of 4+ oxidation state for Zr and Ti in the prepared samples.30,32 However, no indication was observed for metallic Zr (∼178 eV).32
The spectra of O 1s for the four catalysts were investigated (Fig. 4(c)) and the results showed a main peak located at 530 eV which is typically assigned to the lattice oxygen associated to the metal oxides.33,34
Moreover, in the absence of zirconium, a contribution with binding energies around 515 and 517 eV is detected for VTi and VTiCe samples, suggesting that vanadium is a mixture of IV and V oxidation states (Fig. 4(d)).35 However, doping catalysts with zirconium induces a higher oxidation state of vanadium since only binding energy of V5+ is detected (Fig. 4(e)). This result is very promising for the reactivity of V2O5 based catalysts in the total oxidation of chlorobenzene since the catalytic response is strongly governed by the higher vanadium oxidation level.36
The Ce 3d XPS profiles of VTiCe and VTiZrCe samples treated at 500 °C are shown in Fig. 5. The two samples exhibit peaks due to the presence of both Ce4+ and Ce3+, implying that cerium is present at the surface in both 4+ and 3+ oxidation states.37,38 In particular, the sub-bands labeled with u′′′, u′′, u, v′′′, v′′ and v represent the 3d104f0 state of Ce4+,39 and the sub-bands labeled with u, u°, v’ and v° represent the 3d94f1 state corresponding to Ce3+.39 However, the calculated Ce3+ fraction of zirconia containing catalyst (61%) is higher than that of VTiCe (37%), indicating that the catalyst with added ZrO2 contains more Ce3+ ions that provides more redox active sites on catalyst surface and plays the role of oxygen vacancy. This result is very promising for the chlorobenzene abatement which is related to the enhanced redox properties.
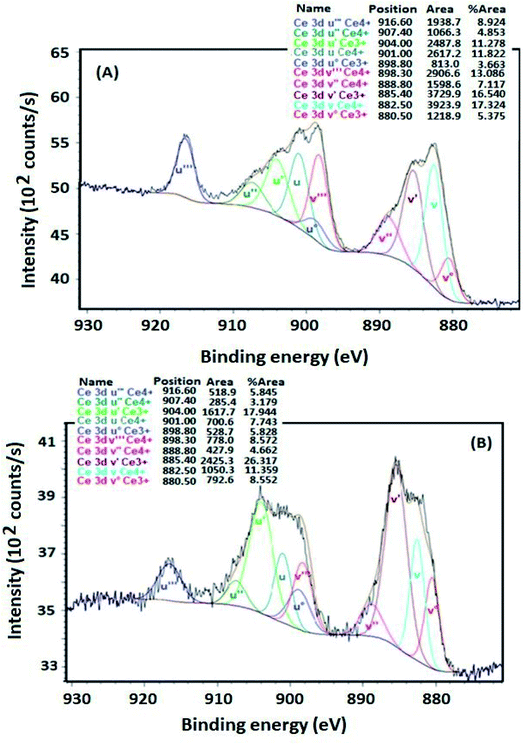 | ||
| Fig. 5 Ce 3d XPS profile of samples treated at 500 °C, (A) Ce 3d XPS profile of VTiCe catalyst, (B) Ce 3d XPS profile of VTiCeZr catalyst. | ||
3.5 NH3-TPD
To evaluate the acidic properties of the elaborated oxides, NH3-TPD experiments were undertaken. The obtained profiles are displayed in Fig. 6. The NH3 desorption profile of VTi shows two unresolved peaks at around 100 °C and 350 °C which are attributed, respectively, to weak and strongly adsorbed ammonia (Fig. 6(a)).1,40,41 The incorporation of cerium to this sample enhances the total acidity of this catalyst as proven by the increase of the intensities of the two peaks mentioned above8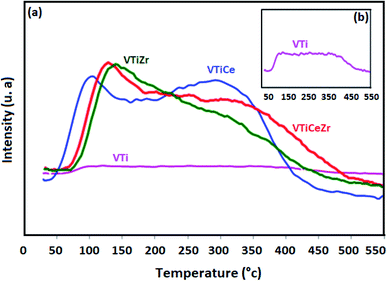 | ||
| Fig. 6 NH3-TPD profiles of catalysts treated at 500 °C: (a) NH3-TPD of VTi, VTiCe, VTiZr and VTiCeZr, (b) NH3-TPD of VTi. | ||
Besides, it seems that the global acidity of V2O5/TiO2 and V2O5/TiO2–CeO2 materials is influenced by the addition of ZrO2. In particular, the intensity of the first peak centred at 100 °C increases considerably indicating that zirconium generates a new type of weak acid sites on the surface of V2O5/TiO2 catalyst which could reveal highly beneficial for the catalytic performances of V2O5/TiO2 as discussed in earlier works.1,42 For VTiCeZr sample, the NH3-desorption temperatures from weak acid sites are shifted toward higher temperatures reflecting an increase in the strength of the weak acid sites. This result is very promising since the acidity is crucial in the adsorption of the VOCs on its surface.1
Furthermore, the introduction of ZrO2 did not seem to change significantly the peak intensities of strong acidic sites in the case of VTiZr and VTiCeZr materials. However, TPD profile of V2O5/TiO2–CeO2–ZrO2 revealed that the strength of strong acid sites was higher than that of V2O5/TiO2–CeO2 since the NH3-desorption temperatures shifted toward higher temperatures. Based on literature,43 strong acid sites which are present on the surface of supports improve the spreading of VOx active phase and consequently, could favour a better catalytic activity.
3.6 H2-TPR
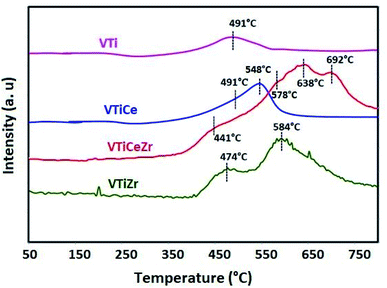
The reducibility of zirconium, vanadium and cerium species was examined by H2-TPR (Fig. 7). The TPR profiles of V2O5 based materials exhibit unresolved peaks maximizing at about 491 °C, 474 °C and 441 °C which might be ascribed to the reduction of dispersed VOx species.44,45 It is clear that the incorporation of zirconium affects the reduction behavior of vanadium species. Especially, the reducibility of vanadium becomes more important in the VTiCeZr solid than that of VTi and VTiZr materials since TPR reduction peaks shifted toward lower temperature. These observations suggest that the presence of zirconium species enhance the reduction ability of catalysts. Thus, the VTiCeZr material with better reducibility could indicate better oxygen absorbing capacity and hence could lead to a better catalytic performances.After ceria addition, a new peak centered at 548 °C appeared in the TPR profile of the V2O5/TiO2–CeO2 which can be attributed to the reduction of surface Ce4+ to Ce3+.46
For ZrO2 containing materials, peaks revealed at 584 °C and 578° for VTiZr and VTiCeZr respectively, could be attributed to the reduction of ZrO2.47
The TPR profile of VTiCeZr catalyst exhibits two peaks around 638 °C and 692 °C which are attributed to the reduction of bulk CeO2.48,49 The reduction temperatures are lower than that of CeO2 (above 700 °C49,50). This was associated with the ZrO2 ability to modify sublattice oxygen into CeO2–ZrO2 mixed oxides, generating defective structures and highly mobile oxygen atoms.49,51
Combined with the XPS results, the good reducibility owing to the increase of the amount and the kinds of reactive oxygen species can provide a facile redox process that could contribute to enhancing the catalytic activity.
3.7 Catalytic test
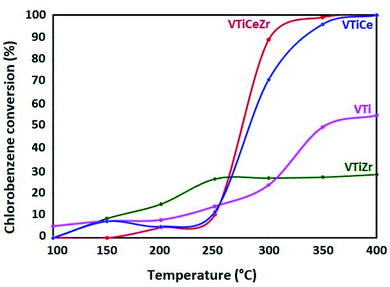
The catalytic investigation was performed in the total oxidation of chlorobenzene in order to probe the ability of the prepared catalysts to convert chlorobenzene without deactivation. Fig. 8 presents the chlorobenzene light-off curves of the impregnated catalysts supported on TiO2, TiO2–CeO2, TiO2–ZrO2 and TiO2–CeO2–ZrO2 in the range 100–400 °C by steps of 50 °C. The reaction was run from 100 °C to 400 °C by steps of 50 °C. At each temperature investigated, the catalyst was stabilized for 150 min in order to reach the steady state. CO2 is the main product. The carbon balance is completed with carbon monoxide, which is also produced especially at a relatively high temperature (from a few % up to ca. 30%). No other partial oxidation products (chlorinated or not) are observed. These observations hold for all the catalysts.The VTi reference catalyst is almost inactive up to 250 °C. However, it exhibits moderate activity above 300 °C and merely reaches 55% at 400 °C. The incorporation of zirconia into this catalyst brings a slight improvement in catalytic activity in the range (100–250 °C). This improvement could be attributed to (i) the better acidic properties, as shown by NH3-TPD results, which help the adsorption of the pollutant and/or (ii) the stabilization of the V2O5 active phase in a higher oxidation state, as demonstrated by XPS results. Moreover, the superior activity of the V2O5/TiO2 catalyst in the range (300–400 °C) could be related to the higher V surface concentration in VTi sample than that shown by VTiZr as demonstrated by XPS results.
On the other hand, the V2O5–TiO2–CeO2 and V2O5–TiO2–CeO2–ZrO2 catalysts hardly convert chlorobenzene below 250 °C and their activities increase with temperature to reach 100% conversion at 400 °C. However, their behavior with the increase of temperature is quite different. Especially, at 300 °C VTiCeZr catalyst converts 89% while VTiCe converts 71%. This observation pointed up the beneficial effect of the introduction of zirconium groups into the binary oxide TiO2–CeO2 aerogel support. In particular, according to XPS results, it seems that zirconia succeeds to stabilize vanadium at a higher oxidation state (V5+). In fact, in the case of VTiCeZr catalyst, ceria mainly exists in the form of Ce3+. The enrichment of Ce3+ could create a charge imbalance, and more oxygen vacancies are formed. This could facilitate the activation and transportation of active oxygen species. Indeed, CeO2 is a powerful oxidant for the regeneration of the V2O5 reduced sites. This higher oxidation strength of CeO2 assisted by ZrO2 induces a speeding up of the Mars and van Krevelen mechanism.52 This speeding up corresponds to the observed increase of the chlorobenzene conversion. This result correlates well with that obtained by H2-TPR. Particularly, VTiCeZr catalyst with better reducibility is the most active catalyst.
4. Conclusion
Our results revealed that Zr-doped V2O5 based catalyst is beneficial for the improvement of catalytic properties in chlorobenzene total oxidation. In particular, in the absence of cerium groups, this beneficial effect is in the range (100–250 °C) and it is essentially correlated with the better acidic properties or/and the stabilization of the V2O5 active phase in a higher oxidation state. However, in the case of cerium rich catalyst, this positive effect is much stronger. In fact, ZrO2 increases the oxygen mobility in the lattice, which, in turn, enhances the redox properties of V2O5/TiO2–CeO2–ZrO2 and induces an increase in the chlorobenzene conversion, especially from 300 °C.Conflicts of interest
There are no conflicts to declare.References
- C. Gannoun, R. Delaigle, P. Eloy, D. P. Debecker, A. Ghorbel and E. M. Gaigneaux, Catal. Commun., 2011, 15, 1–5, DOI:10.1016/j.catcom.2011.08.001.
- Y. Yang, H. Li, S. Zhang, X. Yu, S. Liu, R. Qu and C. Zheng, Catal. Today, 2020, 355, 349–357, DOI:10.1016/j.cattod.2019.11.009.
- R. Delaigle, D. P. Debecker, F. Bertinchamp and E. M. Gaigneaux, Top. Catal., 2009, 52(5), 501–516, DOI:10.1007/s11244-009-9181-9.
- D. P. Debecker, R. Delaigle, K. Bouchmella, P. Eloy, E. M. Gaigneaux and P. H. Mutin, Catal. Today, 2010, 157(1–4), 125–130, DOI:10.1016/j.cattod.2010.02.010.
- C. Du, S. Lu, Q. Wang, A. G. Buekensa, M. Nia and D. P. Debecker, Chem. Eng. J., 2018, 334, 519–544, DOI:10.1016/j.cej.2017.09.018.
- S. H. Taylor, C. S. Heneghan, G. J. Hutchings and I. D. Hudson, Catal. Today, 2000, 59, 249–259, DOI:10.1016/S0920-5861(99)00162-5.
- V. De Jong, M. K. Cieplik, W. A. Reints, F. Fernandez-Reino and R. Louw, J. Catal., 2002, 211, 355–365, DOI:10.1016/S0021-9517(02)93762-0.
- C. Gannoun, R. Delaigle, D. P. Debecker, P. Eloy, A. Ghorbel and E. M. Gaigneaux, Appl. Catal. A: Chem., 2012, 447–448, 1–6, DOI:10.1016/j.apcata.2012.08.034.
- B. Murugan and A. V. Ramaswamy, J. Am. Chem. Soc., J. Am. Chem. Soc., 2007, 129, 3062–3063, DOI:10.1016/j.apcata.2012.08.034.
- C. T. Campbell and C. H. F. Peden, Science, 2005, 309, 713–714, DOI:10.1126/science.1113955.
- B. M Reddy, A. Khan, Y. Yamada, T. Kobayashi, S. Loridant and J. C. Volta, J. Phys. Chem. B, 2003, 107, 5162–5167, DOI:10.1021/jp0344601.
- Y. Nagai, T. Yamamoto, T. Tanaka, S. Yoshida, T. Nonaka, T. Okamoto, A. Suda and M. Sugiura, Catal. Today, 2002, 74, 225–234, DOI:10.1016/S0920-5861(02)00025-1.
- J. Kaspar and P. Fornasiero, Catal. Sci. Ser., 2002, 2, 217–241 CAS , http://hdl.handle.net/11368/1687483.
- Y. Zhang, L. Wang, J. Li, H. Zhang, H. Xu, R. Xiao and l. Yang, Chinese J. Catal., 2016, 37, 1918–1930, DOI:10.1016/S1872-2067(16)62510-X.
- E. H-Ramírez, J. A. Wang, L. F. Chen, M. A. Valenzuela and A. K. Dalai, Appl. Surf. Sci., 2017, 399, 77–85, DOI:10.1016/j.apsusc.2016.12.068.
- J.-M. Giraudon, T. B. Nguyen, G. Leclercq, S. Siffert, J.-F. Lamonier, A. Aboukaıs, A. Vantomme and B.-L. Su, Catal. Today, 2008, 137, 379–384, DOI:10.1016/j.cattod.2008.02.019.
- H. L. Tidahy, S. Siffert, J.-F. Lamonier, E. A. Zhilinskaya, A. Aboukaıs, Z.-Y. Yuan, A. Vantomme, B.-L. Su, X. Canet, G. De Weireld, T. B. N'Guyen, J.-M. Giraudon and G. Leclercq, Appl. Catal. A: Gen., 2006, 310, 61–69, DOI:10.1016/j.apcata.2006.05.020.
- C. Liu, Y. Bi and J. Li, Appl. Surf. Sci., 2020, 528, 146695, DOI:10.1016/j.apsusc.2020.146695.
- Y. Zhang, X. Yue, T. Huang, K. Shen and B. Lu, Materials, 2018, 11, 1307, DOI:10.3390/ma11081307.
- S. Palma Del Valle, O. Marie and H. P. Nguen, Appl. Catal., B, 2018, 223, 116–124, DOI:10.1016/j.apcatb.2017.02.053.
- B. M Reddy and A. Khan, Rev. Sci. Eng., 2005, 47, 257–296, DOI:10.1081/CR-200057488.
- Degussa Technical Bulletin Pigment Report, 1990, vol. 56, p. 13 Search PubMed.
- B. M. Reddy, P. Lakshmanan and A. Khan, J. Phys. Chem. B, 2005, 109, 1781–1787, DOI:10.1021/jp045723+.
- IUPAC, Pure and Appl. Chem., 1985, 57, 603–619, DOI:10.1351/pac198557040603.
- H. Imagawa, T. Tanaka, N. Takahashi, S. Matsunaga, A. Suda and H. Shinjoh, J. Catal., 2007, 251, 315–320, DOI:10.1016/j.jcat.2007.08.002.
- H. Imagawa and H. Imagawa, R&D Rev. Toyota CRDL, 2011, 42, 63–70 Search PubMed , https://www.tylabs.co.jp.review.
- C. Gannoun, A. Turki, H. Kochkar, R. Delaigle, P. Eloy, A. Ghorbel and E. M. Gaigneaux, Appl. Catal., B, 2014, 147, 58–64, DOI:10.1016/j.apcatb.2013.08.009.
- B. Yang, Y. Shen, S. Shen and S. Zhu, J. Rare Earths, 2013, 31, 130–136, DOI:10.1016/S1002-0721(12)60246-4.
- M. Li, S. Zhang, L. Lv, M. Wang, W. Zhang and B. Pan, Chem. Eng. J., 2013, 229, 118–125, DOI:10.1016/j.cej.2013.05.106.
- K. N. Rao and B. M. Reddy, Appl. Catal., B, 2010, 100, 472–480, DOI:10.1016/j.apcatb.2010.08.024.
- C. Gannoun, R. Delaigle, A. Ghorbel and E. M. Gaigneaux, Catal. Sci. Technol., 2019, 9, 2344–2350, 10.1039/c9cy00099b.
- J. Wang, Y. Yu, S. Li, L. Guo, E. Wang and Y. Cao, J. Phys. Chem. C, 2013, 117, 27120–27126, DOI:10.1021/jp407662d.
- Z. Li, J. Li, S. Liu, X. Ren, J. Ma, W. Su and Y. Peng, Catal. Today, 2015, 258, 11–16, DOI:10.1016/j.cattod.2015.07.002.
- M. A. Larrubia, G. Ramis and G. Busca, Appl. Catal., B, 2000, 27, L145–L151, DOI:10.1016/S0926-3373(00)00150-8.
- G. Silversmit, D. Depla, H. Poelman, G. B. Marin and R. De Gryse, J. Electron Spectrosc. Relat. Phenom., 2004, 135, 167–175, DOI:10.1016/j.elspec.2004.03.004.
- S. Chin, S.-E. Park, M. Kim, G. N. Bae and J. Jurng, Powder Technol., 2012, 217, 388–393, DOI:10.1016/j.powtec.2011.10.055.
- B. M. Reddy, K. N. Rao, G. K. Reddy, A. Khan and S.-E. Park, J. Phys. Chem. C, 2007, 111, 18751–18758, DOI:10.1021/jp076617l.
- B. M. Reddy, P. Bharali, P. Saikia, A. Khan, S. Loridant, M. Muhler and W. Grunert, J. Phys. Chem. C, 2007, 111, 10478–10483, DOI:10.1021/jp071485h.
- W. Shan, Y. Geng, Y. Zhang, Z. Lian and H. He, Catalyst, 2018, 8(12), 1–12, DOI:10.3390/catal8120592.
- L. Chmielarz, P. Kustrowski, M. Zbroja, W. Lasocha and R. Dziembaj, Catal. Today, 2004, 90, 43–49, DOI:10.1016/j.cattod.2004.04.007.
- S. S. R. Putluru, L. Schill, A. Godiksen, R. Poreddy, S. Mossin, A. D. Jensen and R. Fehrmann, Appl. Catal., A, 2016, 183, 282–290, DOI:10.1016/j.apcatb.2015.10.044.
- J. Arfaoui, L. Khalfallah Boudali, A. Ghorbel and G. Delahay, Catal. Today, 2009, 142, 234–239, DOI:10.1016/j.cattod.2008.07.032.
- R. Delaigle, D. P. Debecker, F. Bertinchamps and E. M. Gaigneaux, Top. Catal., 2009, 52, 501–516, DOI:10.1007/s11244-009-9181-9.
- H. Poelman, B. F. Sels, M. Olea, K. Eufinger, J. S. Paul, B. Moens, I. Sack, V. Balcaen, F. Bertinchamps, E. M. Gaigneau, P. A. Jacobs, G. B. Marin, D. Poelman and R. De Gryse, J. Catal., 2007, 245, 156–172, DOI:10.1016/j.jcat.2006.09.022.
- G. Y. Popova, T. V. Andrushkevich, E. V. Semionova, Y. A. Chesalov, L. S. Dovlitova, V. A. Rogov and V. N. Parmon, J. Mol. Catal. A: Chem., 2008, 283, 146–152, DOI:10.1016/j.molcata.2007.12.019.
- Z. Lian, F. Liu and H. He, Ind. Eng. Chem. Res., 2014, 53, 19506–19511, DOI:10.1021/ie504188s.
- D. Pakhare, H. Wu, S. Narendra, V. Abdelsayed, D. Haynes, D. Shekhawat, D. Berry and J. Spivey, Appl. Petrochem. Res., 2013, 3, 117–129, DOI:10.1007/s13203-013-0042-x.
- A. Trovarelli, F. Zamar, J. Llorca, C. Leitenburg, G. Dolcetti and J. T. Kiss, J. Catal., 1997, 169, 490–502, DOI:10.1006/jcat.1997.1705.
- M. A. Ebiad, D. R. Abd El-Hafiz, R. A. Elsalamony and L. S. Mohamed, RSC Adv., 2012, 2, 8145–8156, 10.1039/c2ra20258a.
- R. O. da Fonseca, A. A. A. da Silva, M. R. M. Signorelli, R. C. Rabelo-Neto, F. B. Noronha, R. C. C. Simões and L. V. Mattos, J. Braz. Chem. Soc., 2014, 25, 2356–2363, DOI:10.5935/0103-5053.20140245.
- L. Meng, L. Liu, X. Zi, H. Dai, Z. Zhao, X. Wang and H. He, Front. Environ. Sci. Eng. China, 2010, 4, 164–171, DOI:10.1007/s11783-010-0019-2.
- P. Mars and D. W. Van Krevelen, Chem. Eng. Sci., 1954, 3, 41–59, DOI:10.1016/S0009-2509(54)80005-4.
| This journal is © The Royal Society of Chemistry 2022 |

