
 Open Access Article
 This Open Access Article is licensed under a Creative Commons Attribution-Non Commercial 3.0 Unported Licence
Spongy titanosilicate promotes the catalytic performance and reusability of WO3 in oxidative cleavage of methyl oleate†
Shihao Xin,
Xinxin Peng *,
Yao Zhang,
Aiguo Zheng,
Changjiu Xia,
Min Lin,
Bin Zhu,
Zuoxin Huang and
Xingtian Shu
*,
Yao Zhang,
Aiguo Zheng,
Changjiu Xia,
Min Lin,
Bin Zhu,
Zuoxin Huang and
Xingtian Shu
State Key Laboratory of Catalytic Materials and Reaction Engineering, Research Institute of Petroleum Processing, SINOPEC, 100083, Beijing, PR China. E-mail: pengxx.ripp@sinopec.com
First published on 10th February 2022
Abstract
A tungsten containing catalyst catalyzed oxidative cleavage of methyl oleate (MO) by employing H2O2 as an oxidant and is known as an efficient approach for preparing high value-added chemicals, however, the tungsten leaching problem remains unresolved. In this work, a binary catalyst consisting of tungsten oxide (WO3) and spongy titanosilicate (STS) zeolite is proposed for MO oxidative cleavage. The function of STS in this catalyst is investigated. On the one hand, STS converts MO to 9,10-epoxystearate (MES), which further forms nonyl aldehyde (NA) and methyl azelaaldehydate (MAA) with the catalysis of WO3. In this way, MO oxidation and hydrolysis that generates unwanted diol product 9,10-dihydroxystearate (MDS) decreases obviously. On the other hand, STS decomposes peroxide and promotes the conversion of soluble peroxotungstate to insoluble polytungstate. Meanwhile, these tungsten species are allowed to precipitate on its surface instead of remaining in the liquid phase owing to its relative large specific area. Therefore, tungsten leaching can be reduced from 37.0% to 1.2%. Due to the cooperation of WO3 and STS, 94.4% MO conversion and oxidative cleavage product selectivity of 63.1% are achieved, and the WO3–STS binary catalyst maintains excellent catalytic performance for 8 recycling reactions.
1. Introduction
Unsaturated fatty acid esters (UFAE), such as Methyl Oleate (MO), methyl linoleate, linolenic acid methyl ester and so on, are renewable raw materials with high abundance in nature. Conversion of UFAE into aldehydes, acids or esters through oxidative cleavage of its double bond has been considered as an economic and sustainable solution to obtain high value-added chemicals, and the research has attracted considerable academic and industrial interest.1–5Common oxidants such as potassium permanganate and ozone can be used for oxidative cleavage reaction of UFAE.6–9 However, the toxicity and potential harm to humans limit their application. Some researchers turned to use hydrogen peroxide (H2O2) as an oxidant for this reaction10–12 as H2O2 is environmentally benign and produces water as the only by-product. Some transition metal containing catalysts,13–16 such as H2WO4@Al-MCM-41,12 BaFeO3−δ,17,18 Ru(OH)x/γ-Al2O3![[thin space (1/6-em)]](https://www.rsc.org/images/entities/char_2009.gif) 19 and VO@TiO220 have been proved efficient in catalyzing this reaction with H2O2 as oxidant. Among them, tungsten containing catalysts such as tungsten oxide (WO3), WO3 nanoparticles,24 tungstic acid,25 tungstates and supported WO326–30 have shown the best catalytic performance.4,21–23
19 and VO@TiO220 have been proved efficient in catalyzing this reaction with H2O2 as oxidant. Among them, tungsten containing catalysts such as tungsten oxide (WO3), WO3 nanoparticles,24 tungstic acid,25 tungstates and supported WO326–30 have shown the best catalytic performance.4,21–23
Although effective in catalytic oxidative cleavage of UFAE, tungsten containing catalyst suffers from active center leaching problem, and thus limits its large scale application. Take catalytic oxidative cleavage of MO by WO3 and H2O2 for example, the reason for tungsten leaching has already been illuminated.31–33 WO3 firstly reacts with H2O2 to form the active peroxotungstate species, which are soluble in the reaction system. Then, peroxotungstate converts MO into oxidation products and itself turns into insoluble polytungstate species. This compound could be regenerated into active peroxotungstate through reacting with H2O2, so the reaction cycle can be continued. After finishing the reaction, residual H2O2 would still react with polytungstate, and part of soluble tungsten species would remain in the reaction solution which leads to the loss of tungsten and lower the reusability of the catalyst. Therefore, in order to improve the performance and reusability of WO3 catalyst, it is important to reduce the residual soluble tungsten species within the reaction system.
In this work, we report a robust binary catalyst consisting of WO3 and spongy titanosilicate (STS) zeolite for this reaction. It is found that the addition of STS would enhance the epoxidation of MO, accelerating the consumption of H2O2 which promoted the precipitation of tungsten species. Additionally, the relatively large specific surface area of STS facilitates the capture of precipitated tungsten species and thus improves the reusability of the catalyst. Compared with WO3 catalyst, WO3–STS binary catalyst demonstrated improved catalytic performance (94.4% MO conversion and >63% oxidative cleavage products selectivity) and excellent reusability (8 cycles without significant loss in catalytic performance).
2. Experimental
2.1 Materials
Methyl oleate (MO, 96 wt%) and WO3 (diameter < 200 nm, > 99 wt%) were purchased from Alfa Aesar. Tert-butyl alcohol (t-BuOH, >99 wt%) was purchased from Tokyo Chemical Industry Co., Ltd. Tetraethyl orthosilicate (TEOS) and tetrabutyl titanate (TBOT, >98 wt%) were obtained from Changling Catalyst Co. Ltd. N-Phenyl-3-aminopropyltrimethoxysilane (PHATMS), tetrapropylammonium hydroxide (TPAOH, 25 wt%) were obtained from Tokyo Chemical Industry Co. Ltd., methyl palmitate is (MP, 99wt%), 9,10-epoxystearate (MES, 99 wt%) and 9,10-dihydroxystearate (MDS, 99 wt%) were supplied by Sigma-Aldrich. H2O2 (30 wt%) was purchased from Sinopharm Co. Ltd. All materials were used without further purification. Commercial TS-1 zeolite (MFI type) was supplied by Changling Catalyst Co. Ltd. Spongy silicalite-1 (SS) zeolite (MFI type) and MnO2/Al2O3(10 wt% MnO2) was supplied by Research Institute of Petroleum Processing, SINOPEC.2.2 Preparation of the spongy titanosilicate (STS)
STS was synthesized under hydrothermal conditions with PHATMS as the zeolite pore extending reagent according to the ref. 34. The starting materials SiO2:TiO2:TPAOH:H2O:PHATMS with a molar ratio of 1:0.04:0.4:40:0.05 were heated to 170 °C for 3 days under autogenous pressure. The precipitate was collected, washed by distilled water and dried at 110 °C. After calcination at 550 °C for 6 h, the STS zeolite was obtained.
2.3 Characterization
Powder X-ray diffraction (XRD) patterns were obtained on a Philips X'pert-Pro diffractometer using nickel-filtered Cu Kα radiation. Ti/Si molar ratio was quantitatively measured by X-ray fluorescence (XRF) on a Rigaku 3721E spectrometer running at 40 kV. Scanning electron microscopy (SEM) images were taken from a Hitachi4800 microscope. Transition electron microscopy (TEM) images were recorded on an aberration-corrected microscope (JEMARM200F) working at an acceleration voltage of 200 kV. STEM EDS-mapping pictures were acquired from selected areas of the HAADF-STEM images with continuous drift correction. Nitrogen adsorption–desorption isotherms were collected at 77 K on a Quantachrome Auotosorb-iQ2 apparatus. Texture properties were derived from the isotherms using Brunauer–Emmett–Teller (BET) method and t-plot method. Cold-spray ionization (CSI) mass spectra were recorded on a JEOL JMS-T100CS spectrometer. Pore size distribution curves were calculated from the adsorption branch according to Brunauer–Emmett–Teller (BJH) method. Tungsten leaching was detected by Inductively Coupled Plasma Optical Emission Spectrometer (ICP-OES).2.4 Catalytic reaction
The reactions were carried out in a 25 mL round-bottom flask under constant temperature and pressure. The reactor was equipped with a condenser, a magnetic stirrer, and an oil bath. A typical procedure for the catalytic oxidative cleavage of MO is as follows: MO (0.5 mmol), H2O2 (2.5 mmol), WO3 (0.085 mmol), STS (10 wt% with respect to MO) and t-BuOH (20 mmol) were fed to the flask. Then, the flask was placed into the oil bath under 80 °C and reacted for 4–8 h. For the catalyst recycling reactions, the catalyst was recovered by using a centrifuge at 6000 rpm. The catalyst was directly reused in the next reaction cycle without further treatment. The products were sampled and analyzed, and the concentration of tungsten in the solution was determined by ICP-OES.2.5 Product analysis
The consumption of H2O2 was determined by indirect iodine titration method. Products were determined on Agilent 9790/5875C GC-MS equipped with HP-5MS(30 m × 0.25 mm × 0.25 m) column. The conversion of MO and product distribution were analyzed on Agilent 9790 GC equipped with a flame ionization detector and SE-54 (30 m × 0.25 mm × 0.25 m) column with methyl palmitate as internal standard. The conversion and selectivity were calculated according to the following equations.
where, n0 is the mole of compound, i refers to generated products, e.g. MES, nonyl aldehyde (NA), pelargonic acid (PA), methyl azelaaldehydate (MAA), methyl hydrogen azelate (MHA) and MDS.

3. Results and discussion
3.1 Characterization of fresh catalyst
To begin with, commercial TS-1 zeolite was used for comparison with STS zeolite and the XRD and XRF results are shown in Fig. 1. Both TS-1 and STS zeolites show typical MFI topological features in the region of 22°–25°. Different from TS-1, STS shows no peak at 2θ = 25.40°, which is assigned to anatase species. The relative crystallinity of STS is lower than that of TS-1 (Table 1). It is inferred that the pore extending reagent PHATMS slowed down the MFI crystals formation and expanded the pore size in STS.34 The Ti/Si molar ratio measured by XRF is very close for STS and TS-1 (Table 1). | ||
| Fig. 1 XRD patterns of various catalysts. | ||
| Samples | Relative crystallinity (%) | Ti/Si | SBET (m2 g−1) | Sext (m2 g−1) | Smicro (m2 g−1) | Vmeso (cm3 g−1) |
|---|---|---|---|---|---|---|
| TS-1 | 100 | 0.0355 | 440 | 48 | 392 | 0.104 |
| STS | 78 | 0.0350 | 528 | 129 | 206 | 0.143 |
Nitrogen adsorption–desorption isotherm as well as BET and BJH methods were employed to investigate the texture properties of TS-1 and STS (Table 1 and Fig. 2a). Both two samples show type-IV isotherms with H4 type hysteresis loops (Fig. 2a), suggesting the formation of mesopores and multi-layer adsorption of N2. The relatively large hysteresis loop of STS which is mainly located at medium pressure zone (0.45 < p/p0 < 0.9) indicates a uniform distribution of mesoporous structure. Texture properties of TS-1 and STS (Table 1) confirms the existence of mesopores. Moreover, STS shows a narrow pore size distribution at around 4 nm, which is absent from TS-1 (Fig. 2b). It could be due to the effective pore-making effect of PHATMS reagent.
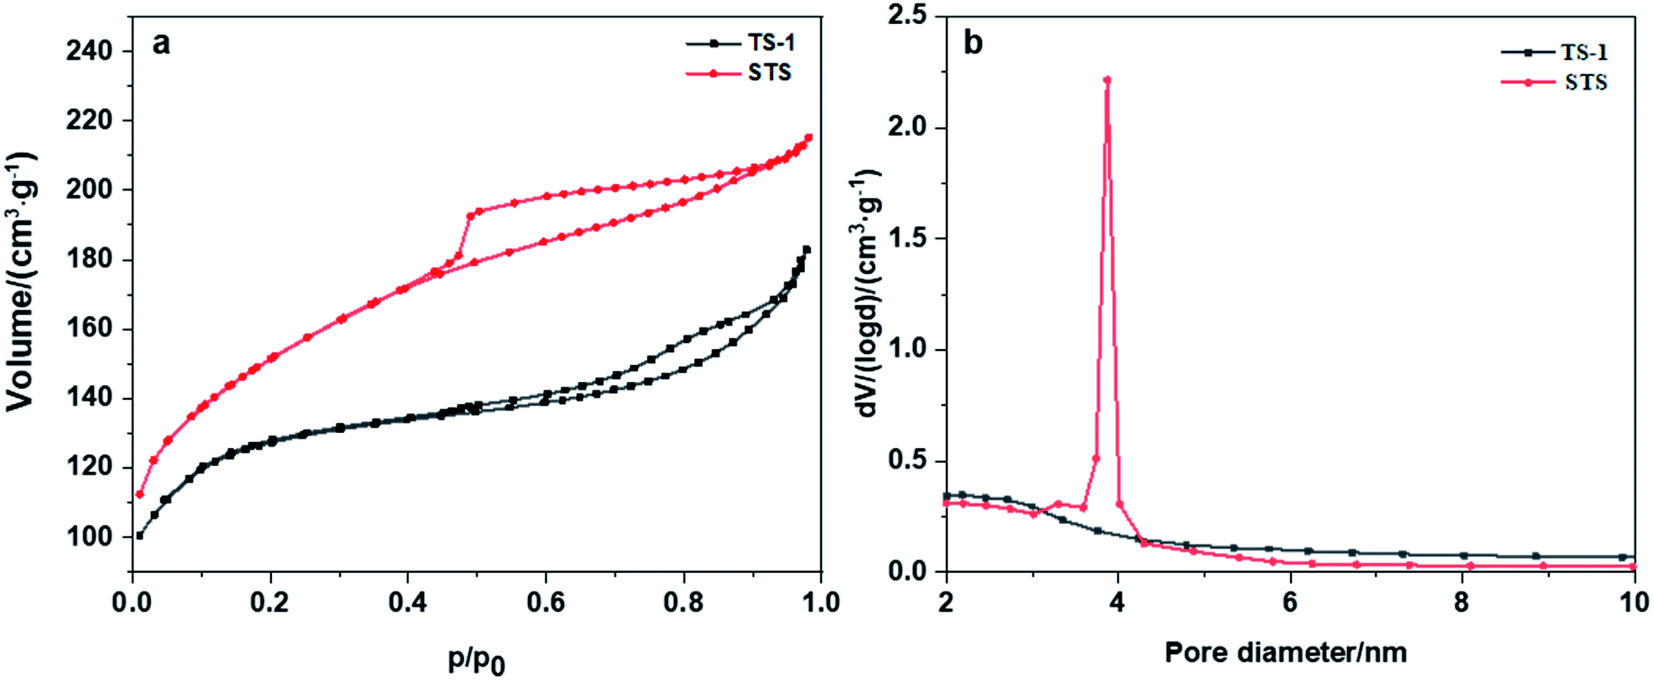 | ||
| Fig. 2 (a) Nitrogen adsorption–desorption isotherms of TS-1 and STS, (b) pore size distribution of TS-1 and STS. | ||
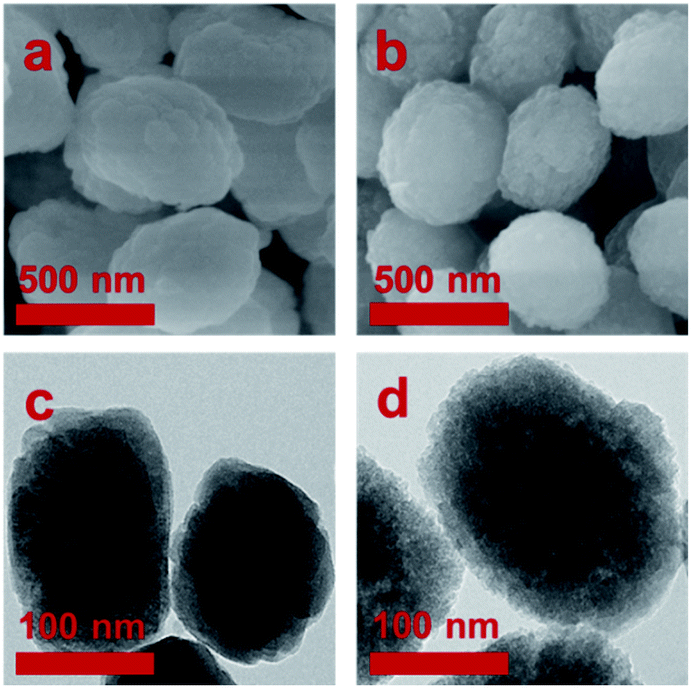
SEM and TEM images of TS-1 and STS zeolites are shown in Fig. 3. Both TS-1 and STS present “raspberry-like” spherical morphology with relative smooth surface. The average particle size is about 300 to 400 nm. TEM image shows solid structure of TS-1, while STS is spongy-like morphology with intracrystalline mesoporosity owing to the aggregation of small particles. It is also found that due to the small particles of STS, the intensity of XRD is lowered down and its relative crystallinity is much lower than that of TS-1.
 | ||
| Fig. 3 SEM images of (a) TS-1 and (b) STS, TEM images of (c) TS-1 and (d) STS. | ||
The XRD pattern of WO3 displayed in Fig. 1 clearly shows monoclinic crystal phase (JCPDS no. 43-1035). Then we prepared WO3-STS sample by mechanical mixing WO3 and STS in a mortar with mass ratio of 15:100 and characterized it by XRD. The result in Fig. 1 shows that the peak intensity of both WO3 and STS are decreased. Compared with WO3, the characteristic peaks of STS is more difficult to be recognized.
3.2 Catalytic performance
SS, TS-1, STS, WO3, WO3–TS-1, WO3–SS and WO3–STS were employed as catalyst for MO oxidative cleavage reaction, respectively, and the results are listed in Table 2. As can be seen from Table 2, there is no reaction occurred without catalyst or using SS as catalyst. When TS-1 is used, 9.8% conversion of MO is obtained and the only product is MES. This is because framework Ti species of TS-1 is effective in catalyze double bond forming epoxy bond, but its pore size is too small for the diffusion of this bulk substrate. In contrast, STS shows higher catalytic activity than TS-1 due to the better accessibility of active site, the conversion of MO reached to 30.8%, and the MES selectivity is 69.5%. It is noticed that apart from MES, some other deep oxidation products of MES like NA, PA, MAA and MHA are also observed as well as MDS, which is originated from hydrolysis of MES. WO3 is much effective for MO oxidative cleavage reaction, as MO conversion reaches to 91.8%. However, half of MES converted into MDS. Obvious WO3 leaching is observed as 37.0% of WO3 is dissolved and lost with the liquid after reaction.| Entry | Catalyst | Conversion (%) | Selectivity (%) | Tungsten leaching (%) | |||||
|---|---|---|---|---|---|---|---|---|---|
| NA | PA | MAA | MHA | MES | MDS | ||||
| a n(MO):n(H2O2):n(t-BuOH) = 1:2.5:20, m(catalyst):m(MO) = 1:10, temperature 80 °C, reaction time 4 h. |
|||||||||
| 1 | — | 0 | 0 | 0 | 0 | 0 | 0 | 0 | — |
| 2 | SS | 0 | 0 | 0 | 0 | 0 | 0 | 0 | — |
| 3 | TS-1 | 9.8 | 0 | 0 | 0 | 0 | 100.0 | — | |
| 4 | STS | 30.8 | 5.3 | 2.5 | 5.5 | 2.0 | 69.5 | 15.2 | — |
| 5 | WO3 | 91.8 | 14.2 | 1.1 | 13.1 | 0.9 | 20.2 | 50.5 | 37.0 |
| 6 | WO3–TS-1 | 76.5 | 19.6 | 0 | 20.9 | 0 | 12.3 | 47.2 | 25.0 |
| 7 | WO3–SS | 90.1 | 13.2 | 0.7 | 12.6 | 0.5 | 21.7 | 51.3 | 42.0 |
| 8 | WO3–STS | 91.9 | 28.5 | 2.6 | 29.7 | 2.3 | 6.3 | 30.6 | 1.2 |
When we use mechanical mixture of WO3 and TS-1 as catalyst, MO conversion is much higher than Ts-1 but lower than WO3. Compared with products distribution of WO3, the selectivity of MES decreased to 12.3%, both NA and MAA selectivity increased and the MDS selectivity also decreased slightly. It suggests that the products distribution could be mediated by combining WO3 and TS-1. However, the WO3 leaching is still up to 25.0% and is unacceptable for a sustainable process. The performance of WO3–SS is basically the same with WO3 (Table 2, entry 5 and 7) as well as the tungsten leaching rate, suggesting that SS is ineffective for the MO oxidative cleavage reaction. Further, we used the binary WO3–STS as catalyst for MO oxidative cleavage reaction. The results showed MO conversion is higher than WO3 (91.9%). In contrast with WO3 and WO3-TS-1, the selectivity of NA and MAA is much higher and both MES and MDS decreases obviously. Among all catalysts, the highest MO conversion and total selectivity of oxidative cleavage products (NA, PA, MAA and MHA, 63.1%) are achieved by WO3–STS. More importantly, tungsten leaching of WO3–STS is reduced from 37.0% to 1.2%. The increased catalytic activity, enhanced oxidative cleavage products selectivity and suppressed tungsten leaching suggest synergistic effect from the combination of WO3 and STS. The dependence of catalyst amount on the MO oxidative cleavage reaction is investigate and provided in ESI Table S1.† The results also confirms both W and Ti are essential for this reaction.
3.3 Reusability of WO3-STS
In order to investigate the reusability of WO3-STS, the catalyst was recovered by centrifugal separation, and reused in a subsequent reaction without drying, washing or calcination after each reaction cycle. WO3 was employed as control and tungsten concentration in liquid phase was measured. The results are shown in Fig. 4. Obviously, when using WO3 as catalysis, MO conversion decreases rapidly after three cycles. Each reaction cycle is accompanied with a serious WO3 leaching, and thus leading to the worse reuse effect.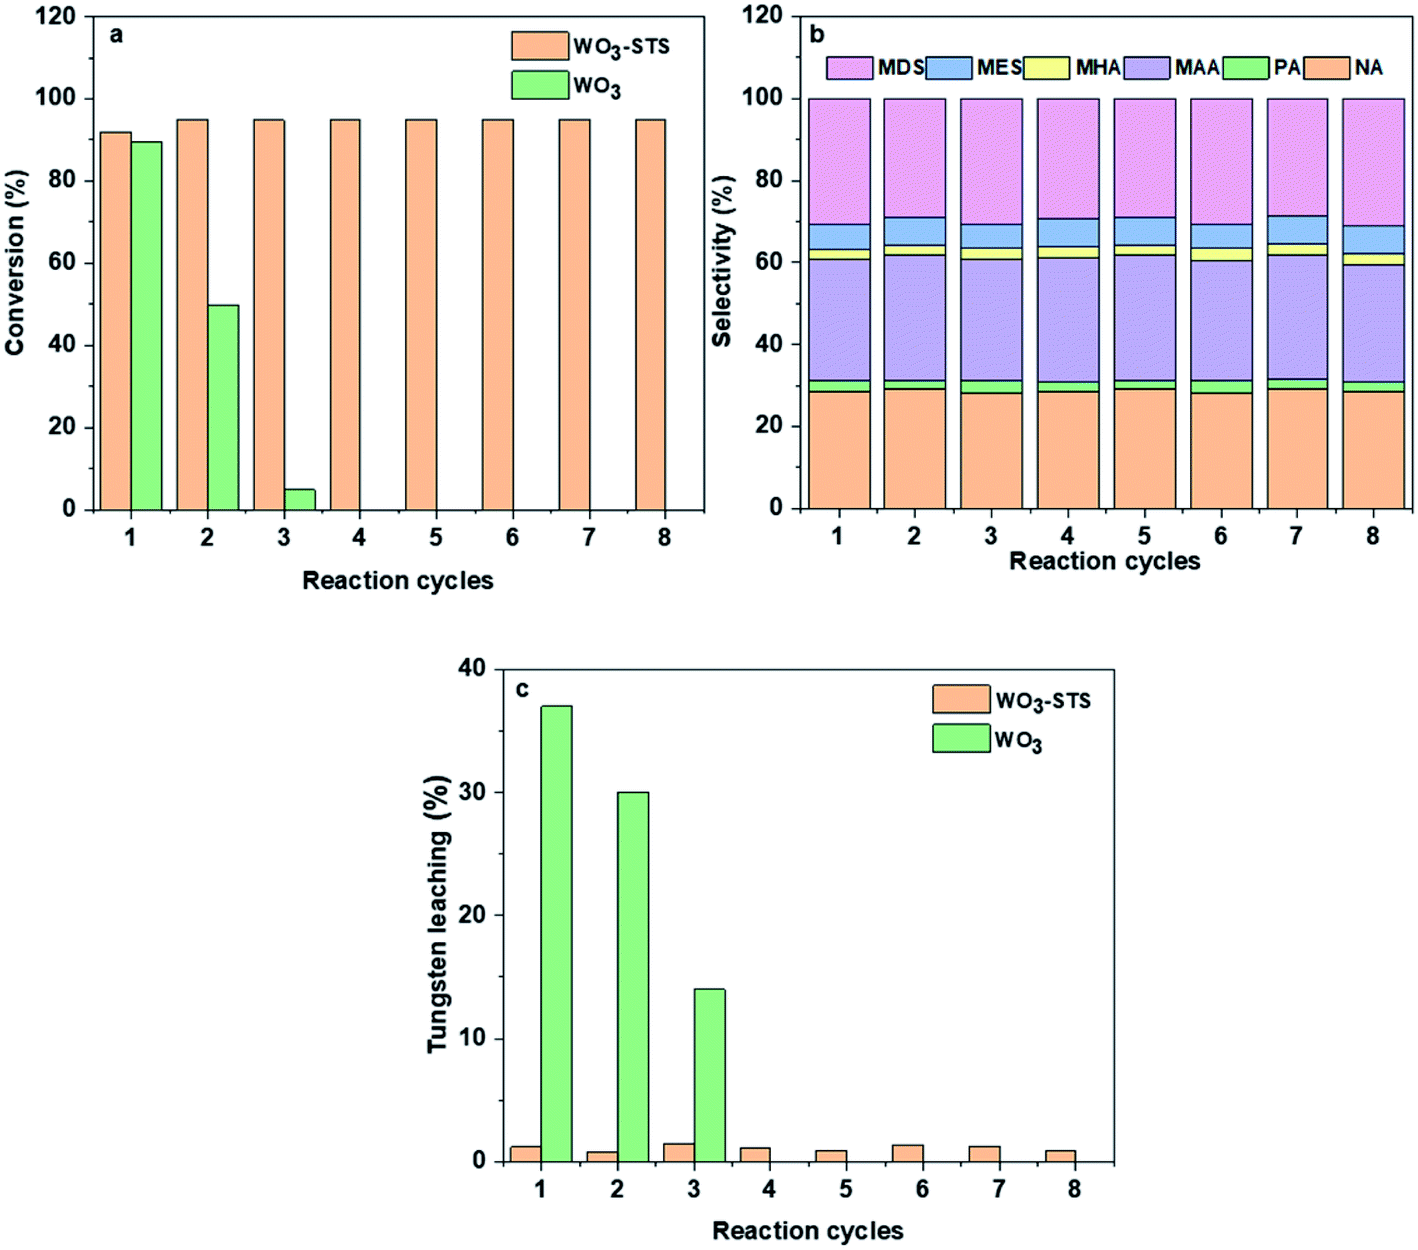 | ||
| Fig. 4 Reusability of WO3 and WO3–STS catalysts: (a) conversion, (b)selectivity and (c)tungsten leaching. n(MO):n(H2O2):n(t-BuOH) = 1:2.5:20, m(catalyst):m(MO) = 1:10, temperature 80 °C, reaction time 4 h. | ||
While for WO3–STS, the story is totally different. After eight reaction cycles, the catalyst shows almost no loss of catalytic activity and oxidative cleavage products selectivity, the MO conversion even increases to 94.4% with oxidative cleavage products selectivity maintaining above 63.1%, suggesting excellent reusability of the WO3–STS catalyst. In addition, the tungsten leaching of the WO3–STS catalyst is controlled below 2% for each reaction cycle (Fig. 4c), and it exhibits excellent mass stability. Due to the ignorable loss of WO3, the WO3–STS binary catalyst can maintain excellent performance during recycling reactions.
Further, in order to study the stability of WO3–STS catalyst, we analyzed the phase structure, morphology and micro region composition of the binary catalyst after it was recovered from the eighth reaction cycle by using XRD, STEM and EDS. The sample is denoted as WO3–STS-8. After the eighth recycle, the recovered catalyst remained most of its original diffraction peaks as fresh WO3–STS (Fig. 1). But the peak intensity decreases significantly especially for the peaks with diffraction angle lower than 10° which might be caused by decrease of crystal size. Nonetheless, the characteristic diffraction peaks at 2θ = 23.07°, 23.54°, 24.35°, 33.18° and 34.19° which are attributed to monoclinic WO3 crystal are discernible. Although it's hard to distinguish STS from WO3 since the characteristic peaks of STS overlap with WO3, it is safe to conclude that WO3 still exists as crystal. The nitrogen adsorption–desorption isotherms and pore size distribution were obtained for fresh WO3–STS and the one used for 8 cycles are provided in the ESI Fig. S1.† As can be seen from the results, the isotherms and pore size distribution remain nearly unchanged. The texture properties (Table S2†) reveals that after 8 recycles, specific area of micropores and pore volume decreased slightly.
Two different morphologies are observed in the TEM image, and three areas are marked according to the TEM image contrast (Fig. 5a). The elemental mapping results reveal that O, Si and Ti atoms distribute in area 1, 2 and 3, but W mainly appears in area 1 (Table 3). The elemental distribution was further analyzed by EDS (Fig. 5b–e). It confirms that W mainly located at area 1, and Si and Ti mainly located at area 3. For area 2, all Si, Ti and W atoms are discovered since two kinds of particles is mixed. The above analysis suggests that the particles in area 1 are mainly WO3, while the particles in area 3 are mainly STS zeolite. The intracrystalline mesopores in area 3 also proves its zeolite nature. Then, we employ HADDF characterization method to analyze the STS zeolite. It is surprise to find out that many sub-nano WO3 particles dispersed on the STS surface with diameter of 1–3 nm (Fig. 5f–h). These particles might be generated during the MO oxidative reaction. Since the morphology of WO3 in area 1 remains well, it is inferred that only part of WO3 involved the reaction and finally deposited on the surface of STS. This result also explains why W is discovered in area 3.
 | ||
| Fig. 5 Microscopic images of WO3–STS-8: (a) TEM, (b–e) EDS elemental mapping and (f–h) HADDF. | ||
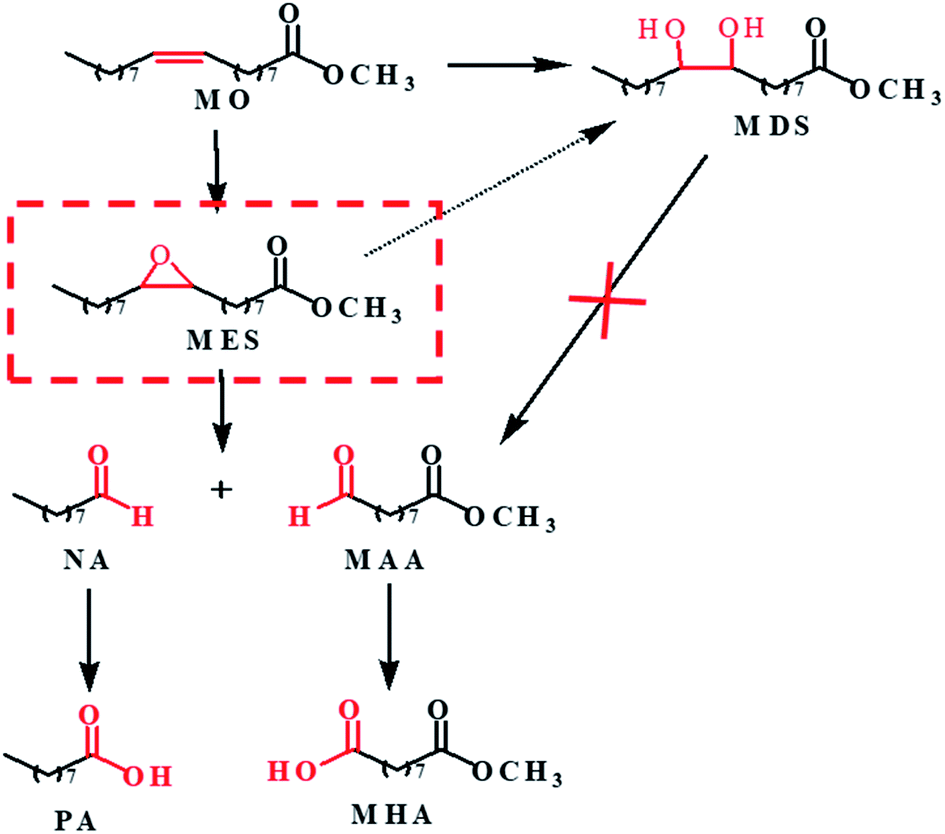
3.4 Reaction pathway
As mentioned in Table 2, WO3 is very effective in catalyzing MO oxidative cleavage reaction, therefore, its products distribution at different reaction time was investigated and the results are displayed in Fig. 6. The MO conversion increases rapidly before 4 h and finally reaches to above 94%. The product distribution changes a lot during the reaction. At the initial stage, the main products are MES and MDS, together with a small amount of oxidative cleavage products, NA and MAA. As the reactions went on, NA and MAA increased along with the decrease of MES, and MDS also increased slightly. A small amount of PA and MHA also can be observed in the later period. The total selectivity of oxidative cleavage products is about 40% at reaction time of 8 h.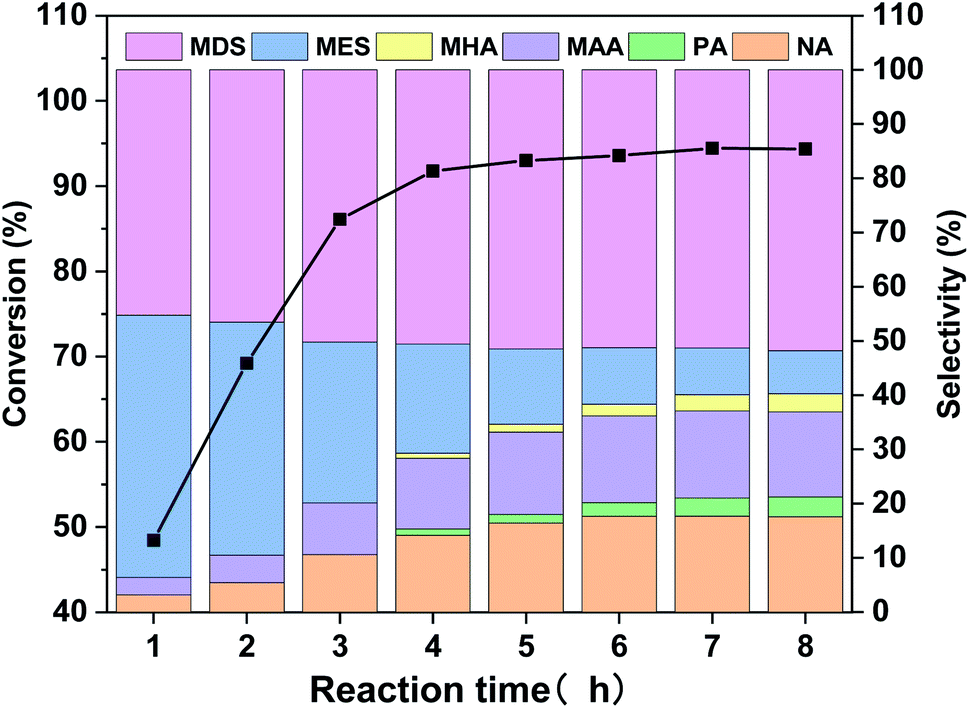 | ||
| Fig. 6 MO conversion and products distribution along with reaction time for the WO3-catalyzed MO oxidative cleavage reaction. | ||
In order to figure out how the reaction occurred, we further carried out the WO3 catalyzed experiments with epoxide MES and diol MDS as starting materials, and the results are displayed in Table 4. It can be seen that MES is quite active in this reaction, 90% of it converts into NA, MAA and MDS with selectivity 36.0%, 35.5% and 28.5%, respectively. That is to say, oxidative cleavage and hydrolysis are both possible reactions for MES but the latter is more preferred. If all MDS is generated from MES in MO oxidative cleavage reaction, then MDS selectivity doesn't match the selectivity of NA and MAA in Fig. 6. Because according to Table 4, the selectivity of MDS in Fig. 6 should lower than that of NA or MAA if it is generated from MES. Therefore, most of MDS might be generated directly from MO. As for catalytic reaction of MDS, the result shows that is too stable to occur further reaction under the oxidative reaction condition.
| Starting material | Conversion (%) | Selectivity (%) | |||||
|---|---|---|---|---|---|---|---|
| NA | PA | MAA | MHA | MES | MDS | ||
| a n(starting material):n(H2O2):n(t-BuOH) = 1:2.5:20, m(WO3):m(starting material) = 0.15:10, temperature 80 °C, reaction time 4 h. |
|||||||
| MO | 91.7 | 14.2 | 1.1 | 13.1 | 0.9 | 20.2 | 50.5 |
| MES | 90.0 | 36.0 | 0 | 35.5 | 0 | 0 | 28.5 |
| MDS | 0 | 0 | 0 | 0 | 0 | 0 | 0 |
Based on the above results and analysis of WO3 catalyzed reactions, we speculated the possible reaction pathway of MO oxidation cleavage as depicted in Scheme 1. MO is firstly converted into epoxide (MES) and diol (MDS) products. MDS is relatively inert and cannot go further conversion under the reaction conditions. While MES is reactive and further undergoes hydrolysis to form MDS or oxidative cleavage to form NA and MAA. The aldehydes can be further oxidized to carboxylic acid. As the oxidative cleavage is stoichiometric reaction, the molar ratio of NA to MAA is close to 1:1. As mentioned above, STS is capable of catalyze the oxidation of MO to generate MES, so there would be more MES that could be converted to NA and MAA by WO3. And that's why the selectivity of NA and MAA is improved and to the opposite, the MDS selectivity is decreased (Table 2, entry 6).
 | ||
| Scheme 1 Reaction pathway for WO3 catalyzed MO oxidative cleavage reaction. | ||
The catalytic nature of STS doesn't explain for the improvement of reusability for WO3–STS in the recycling reaction. The deposition of WO3 on STS might matters. As previously discussed, the catalysis of WO3 on oxidative cleavage of MO is ensured, but how does this happen?. Through the interaction of WO3 with H2O2, peroxotungstate which is the key active species is generated. So MO could be epoxidated and further cleaved into targeted products through the interaction with it. And the peroxotungstate species would turn into polytungstate. Though insoluble in water, it could still react with H2O2 and forming the reactive peroxotungstate species and proceeding the MO oxidative cleavage reaction. If H2O2 is not depleted completely after the reaction, polytungstate would kept dissolving and generating peroxotungstate species which would lead to the loss of tungsten after separation of catalyst from liquid and thus lower down the reusability of the catalyst.
If H2O2 is decomposed and consumed, whether it can stop the formation of peroxotungstate species and retain tungsten in solid phase or not?. To verify this, we chose three types of tungsten containing compounds and reacted with H2O2 under the reaction condition except MO is absent from it. After the reaction, MnO2/Al2O3(10 w% MnO2) which was applied for peroxide compounds decomposition in the reaction mixture was added in and we waited until bubbles is not generating obviously. The tungsten concentration in the solution is measured by ICP-OES before and after adding MnO2/Al2O3 and the results are shown in Table 5. It clearly shows that though different in solubility due to the different tungsten containing compound, the concentration of homogeneous tungsten species decreases to lower than 1 mg kg−1. And that is to say, control the content of peroxide compounds in the liquid phase is the key to reduce the loss of tungsten.
| Tungsten containing compounds | Tungsten concentration (mg kg−1) | |
|---|---|---|
| Before adding MnO2/Al2O3 | After adding MnO2/Al2O3 | |
| a n(Tungsten containing compound):n(H2O2):n(t-BuOH) = 1:2.5:20, temperature 80 °C. |
||
| WO3 | 138 | <1 |
| H28N6O41W12 | 384 | <1 |
| (NH4)10W12O41∼xH2O | 172 | <1 |
The H2O2 conversion along with reaction time during the MO oxidative cleavage reaction under different catalyst condition was analyzed by titration method and the results are depicted in Fig. 7. When no catalyst is employed, the H2O2 conversion is lower than 5%. The H2O2 conversion increases linearly with reaction time, and reaches to 43% after reaction for 4 h. Compared with WO3, STS is far more effective for catalyzing H2O2 conversion. Since MO conversion is restively low as catalyzed by STS (Table 2, entry 3), part of H2O2 in this experiment might be decomposed inefficiently. And this result confirms the peroxide decomposing effect for STS. As WO3–STS is used, an improved H2O2 conversion compared with STS is obtained. As can be seen from the above results, STS functions as epoxidation catalyst as well as peroxide decomposing catalyst.
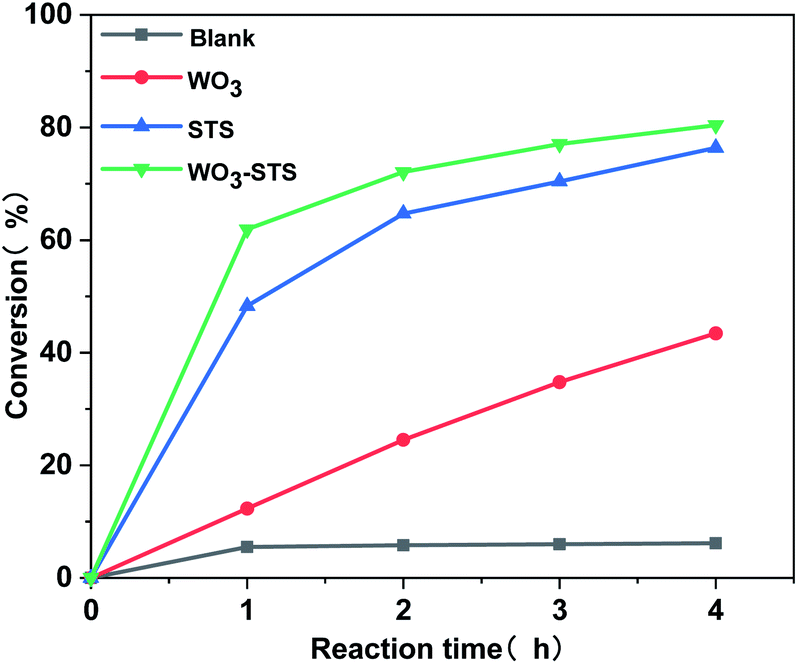 | ||
| Fig. 7 H2O2 conversion along with reaction time catalyzed by different catalyst. n(MO):n(H2O2):n(t-BuOH) = 1:2.5:20, m(WO3–STS):m(MO) = 1:10, temperature 80 °C. | ||
3.5 Reaction mechanism
The oxidatIve cleavage of MO catalyzed by WO3 and H2O2 is generally considered as homogeneous reaction according to previous studies.31 We prepared homogeneous active tungsten species generated by the reaction of WO3 and H2O2, and applied it to MO oxidative cleavage reaction with or without STS, as shown in Fig. 8. Firstly, the reaction between WO3 and H2O2 is conducted under 80 °C for 1 h (Fig. 8a). The transparent filtrate is then obtained while it was still hot (Fig. 8b). Part of this filtrate was added with MO and reacted under 80 °C for 6 h. Product analysis shows that MO conversion rate reaches to 91.2%, NA and MAA selectivity is 14.0% and 14.2%, respectively. On the other hand, STS was added to the other part of filtrate reacting for 15 min and the intermediate was obtained (Fig. 8d). Then, MO was added for oxidative cleavage reaction. Product analysis shows that MO conversion rate reaches to 90.5%, NA and MAA selectivity is 28.4% and 29.7%, respectively. As can be seen, the selectivity of NA and MAA has doubled when STS was added in while MO conversion did not decrease obviously. This result again strongly infers that STS was involved in the reaction.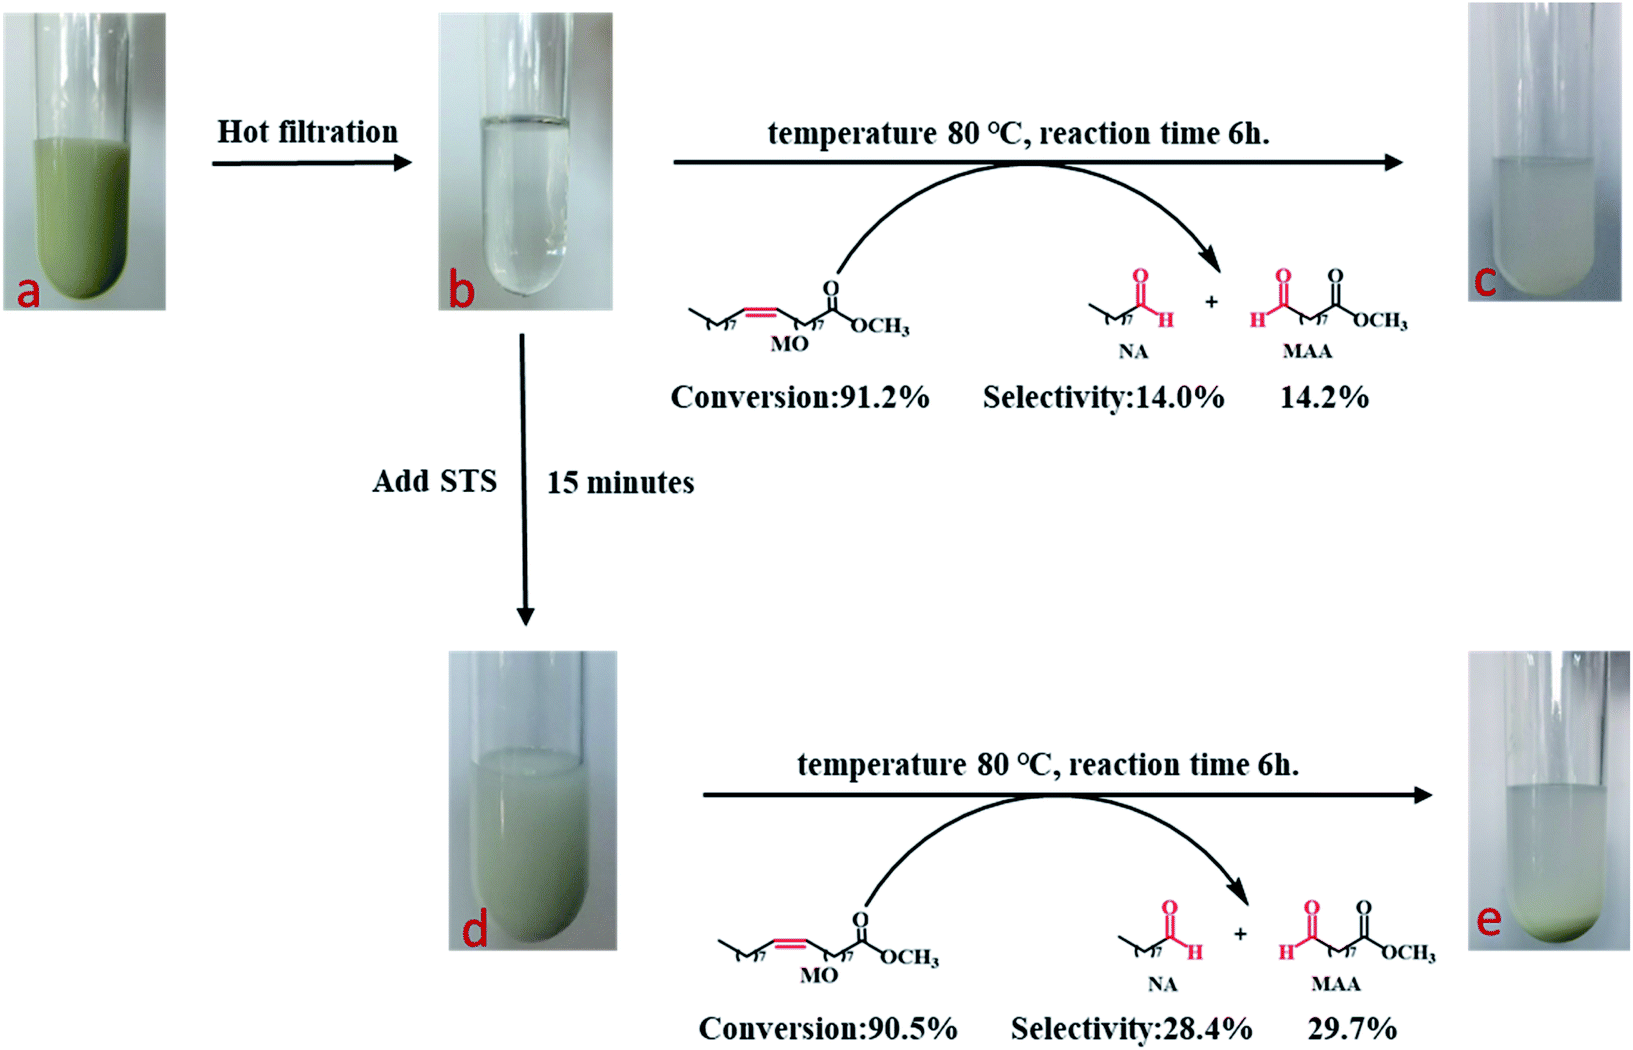 | ||
| Fig. 8 Hot peroxotungstate-containing filtrate catalyzed MO oxidative cleavage. | ||
Cold-spray ionization(CSI) mass spectrometer (MS) was further used to analyze the distribution of peroxotungstate species. Four liquid samples of filtrate obtained from the product of Fig. 8b–e were analyzed by CSI-MS. Only two samples from Fig. 8b and d showed peroxotungstate signals as shown in Fig. 9. The signals were attributed to various homogeneous tungsten species, such us [HWO4]−(m/z = 249.08), [HWO3(O2)]− (m/z = 264.88), [H19WO10(O2)3]− (m/z = 458.89), [H20WO11(O2)3]−(m/z = 476.72), H17W2O10(O2)5]− (m/z = 705.43), H13W3O9(O2)6]− (m/z = 933.20). When STS was added to the filtrate (Fig. 8d), it was found that the tungsten species with high mass charge ratio disappeared (Fig. 8c). This results indicate that these tungsten species is not stable with the existence of STS, and that explain how the STS promoted the depletion of peroxides.
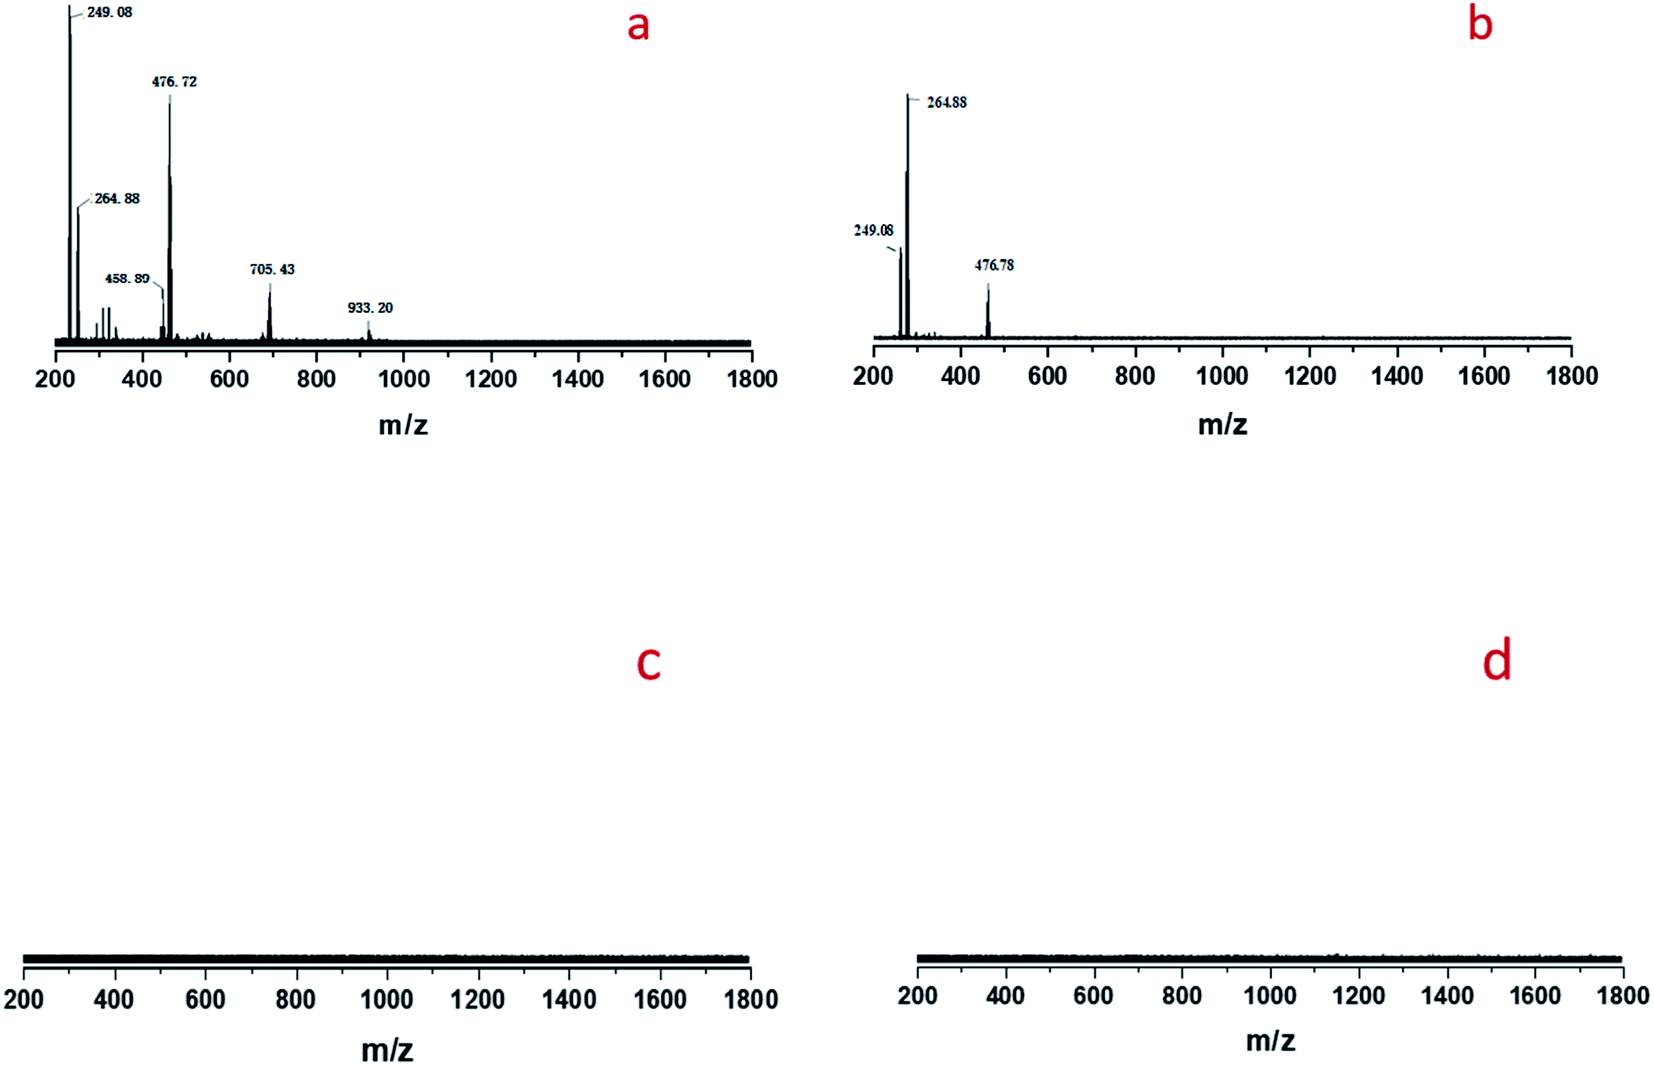 | ||
| Fig. 9 CSI-MS (negative-ion mode) analysis results of the filtrate: (a) sample obtained from Fig. 8b, (b) sample obtained from Fig. 8d, (c) sample obtained from Fig. 8c, (d) sample obtained from Fig. 8e. | ||
The reaction mechanism of WO3-STS catalyzed MO oxidative cleavage is proposed and depicted in Scheme 2. The oxidative cleavage reaction of MO is a two-step process and the epoxide MES is the key intermediate for the whole conversion. To increase the yield of oxidative cleavage products (NA and MAA), it is necessary to enhance the conversion of MO to MES. Both STS and WO3 are capable of active H2O2 and catalyze the expoxidation of MO. In this regard, adding STS into the reaction system would be a good choice due to their excellent catalytic activity for epoxidation.34,35 The epoxidation reaction catalyzed by both STS and WO3 supplies sufficient MES for the oxidative reaction. And the selectivity of unwanted diol product MDS which mainly formed directly from MO decreased obviously (Table 2, entry 4 and 6). Furthermore, WO3 is effective in converting MES into NA and MAA and it is the main catalyst to catalyze the MES oxidative cleavage reaction. Thus the binary WO3–STS catalyst shows high catalytic performance.
 | ||
| Scheme 2 Proposed reaction mechanism of WO3–STS catalyzed MO oxidative cleavage reaction. | ||
Due to the excessive H2O2, insoluble WO3 kept dissolving and forming soluble peroxotungstate and thus leading to the tungsten leaching. STS is capable of decomposing peroxide, therefore, the WO3 dissolving process is limited and insoluble tungsten species start to precipitate. When H2O2 was completely consumed, the tungstate decomposes into WO3 particles, which has poorer solubility, and these particles started to aggregate and precipitate. Because of the relatively large specific surface area of STS, it easy to efficiently capture these sub-nano WO3 particles and recover it. These WO3 particles are soluble to H2O2 and owing to the small size of it, it is easier to be peroxidized than bulk WO3 particles and the MO conversion is thus improved in the recycling reactions. Owing to the cooperation of STS and WO3, both good catalytic performance and reusability are achieved.
4. Conclusion
In this study, we investigated MO oxidative cleavage reaction catalyzed by WO3–STS binary catalyst. Both WO3 and STS component are capable of catalyze MO epoxidation and generating MES intermediate, while WO3 is much more efficient in converting MES into targeted products NA and MAA. However, WO3 is likely to dissolve in H2O2 and form soluble peroxotungstate species which results tungsten leaching. STS zeolite is just able to decompose peroxide and promote precipitation of peroxotungstate species on the surface of STS, so almost all tungsten species can be recovered. Owing to the cooperate catalysis of WO3 and STS zeolite, the WO3–STS catalyst shows enhanced catalytic performance with 94.4% MO conversion and oxidative cleavage products selectivity above 63%, and much improved reusability compared with single component of this binary system. These results shed light on designing of highly efficient catalysts for oxidative cleavage of unsaturated fatty acid esters and exhibit great potential for green process developing.Author contribution
Shihao Xin: investigation, data curation, writing – original draft. Xinxin Peng: conceptualization, methodology, formal analysis, writing – review & editing. Yao Zhang: conceptualization. Aiguo Zheng: tem characterization and investigation. Changjiu Xia: formal analysis. Min Lin: validation. Bin Zhu: validation. Zuoxin Huang: formal analysis, supervision. Xingtian Shu: supervision, project administration.Conflicts of interest
The authors declare of no conflicts of interest.Acknowledgements
This work was supported by the National Key Research and Development Program of China (2017YFB0306800), and China Petrochemical Corporation (SINOPEC Group 114054).References
- M. Wang, J. Ma, H. Liu, N. Luo, Z. Zhao and F. Wang, ACS Catal., 2018, 8, 2129–2165 CrossRef CAS.
- T. Seidensticker, A. J. Vorholt and A. Behr, Eur. J. Lipid Sci. Technol., 2016, 118, 3–25 CrossRef CAS.
- A. Enferadi Kerenkan, F. Béland and T. Do, Catal. Sci. Technol., 2016, 6, 971–987 RSC.
- E. Brenna, D. Colombo, G. Di Lecce, F. G. Gatti, M. C. Ghezzi, F. Tentori, D. Tessaro and M. Viola, Molecules, 2020, 25, 1882 CrossRef CAS PubMed.
- U. Biermann, U. T. Bornscheuer, I. Feussner, M. A. R. Meier and J. O. Metzger, Angew. Chem., 2021, 133, 20304–20326 CrossRef.
- M. H. Tavassoli-Kafrani, P. Foley, E. Kharraz and J. M. Curtis, J. Am. Chem. Soc., 2016, 93, 303–310 CAS.
- F. Nocito, I. Orlando, F. Digioia, M. Aresta and A. Dibenedetto, ACS Sustainable Chem. Eng., 2021, 9, 6459–6469 CrossRef CAS.
- C. Pfrang, F. Sebastiani, C. O. M. Lucas, M. D. King, I. D. Hoare, D. Chang and R. A. Campbell, Phys. Chem. Chem. Phys., 2014, 16, 13220–13228 RSC.
- A. Vassoi, T. Tabanelli, A. Sacchetti, F. Di Gioia, L. Capuzzi and F. Cavani, Chemsuschem, 2021, 14, 2375–2382 CrossRef CAS PubMed.
- Z. Masyithah and A. Ginting, Orient. J. Chem., 2018, 34, 1249–1256 CAS.
- A. Soutelo-Maria, J. Dubois, J. Couturier and G. Cravotto, Catalysts, 2018, 8, 464 CrossRef.
- L. Peng, Q. Xie, Y. Nie, X. Liu, M. Lu and J. Ji, RSC Adv., 2019, 9, 2237–2361 Search PubMed.
- B. Hajra, N. Sultana, C. Guria, A. K. Pathak and V. K. Saxena, J. Am. Chem. Soc., 2017, 94, 1463–1480 CAS.
- S. Koppireddi, J. Seo, E. Jeon, P. S. Chowdhury, H. Jang, J. Park and Y. Kwon, Adv. Synth. Catal., 2016, 358, 3084–3092 CrossRef CAS.
- A. Behr, N. Tenhumberg and A. Wintzer, RSC Adv., 2013, 3, 172–180 RSC.
- J. C. S. Soares, A. H. A. Gonçalves, F. M. Z. Zotin, L. R. R. de Araújo and A. B. Gaspar, Catal. Today, 2021, 381, 143–153 CrossRef CAS.
- S. Shibata, K. Kamata and M. Hara, Catal. Sci. Technol., 2021, 11, 2369–2373 RSC.
- A. Gandon, C. C. Nguyen, S. Kaliaguine and T. O. Do, Can. J. Chem. Eng., 2021, 99, 2003–2013 CrossRef CAS.
- B. Guicheret, E. Da Silva, R. Philippe, A. Favre-Reguillon, L. Vanoye, P. Blach, Y. Raoul, C. De Bellefon, E. Métay and M. Lemaire, ACS Sustainable Chem. Eng., 2020, 8, 13167–13175 CrossRef CAS.
- R. Upadhyay, R. Rana, A. Sood, V. Singh, R. Kumar, V. C. Srivastava and S. K. Maurya, Chem. Commun., 2021, 57, 5430–5433 RSC.
- M. Melchiorre, V. Benessere, M. E. Cucciolito, C. Melchiorre, F. Ruffo and R. Esposito, Chemistryselect, 2020, 5, 1396–1400 CrossRef CAS.
- X. K. Li, J. C. P. Syong and Y. Zhang, Green Chem., 2018, 20, 3619–3624 RSC.
- M. Lu, L. Peng, Q. Xie, Y. Nie, X. Liu, X. Lu and J. Ji, Eur. J. Lipid Sci. Technol., 2018, 120, 1700415 CrossRef.
- A. Enferadi-Kerenkan, A. S. Ello and T. Do, Ind. Eng. Chem. Res., 2017, 56, 10639–10647 CrossRef CAS.
- D. Pyszny, T. Piotrowski and B. Orlińska, Org. Process Res. Dev., 2019, 23, 309–319 CrossRef CAS.
- N. Maksimchuk, I. Ivanchikova, O. Zalomaeva, Y. Chesalov, A. Shmakov, V. Zaikovskii and O. Kholdeeva, Catalysts, 2018, 8, 95 CrossRef.
- A. E. Kerenkan, A. S. Ello, B. Echchahed and T. Do, Int. J. Chem. React. Eng., 2016, 14, 899–907 CrossRef CAS.
- D. Pyszny, T. Piotrowski and B. Orlińska, Org. Process Res. Dev., 2019, 23, 309–319 CrossRef CAS.
- D. Yun, E. Z. Ayla, D. T. Bregante and D. W. Flaherty, ACS Catal., 2021, 11, 3137–3152 CrossRef CAS.
- L. Peng, Q. Xie, Y. Nie, X. Liu, M. Lu and J. Ji, RSC Adv., 2019, 9, 23061–23070 RSC.
- Y. Yoshimura, Y. Ogasawara, K. Suzuki, K. Yamaguchi and N. Mizuno, Catal. Sci. Technol., 2017, 7, 1662–1670 RSC.
- T. Cousin, G. Chatel, B. Andrioletti and M. Draye, New J. Chem., 2021, 45, 235–242 RSC.
- M. Lu, L. Peng, Q. Xie, N. Yang, H. Jin, Z. Wu, Y. Nie, X. Liu, X. Lu and J. Ji, Green Chem., 2019, 21, 56–566 Search PubMed.
- Y. Zhang, C. J. Xia, M. Lin, Q. H. Duan, B. Zhu, X. X. Peng, B. R. Wang, S. Yuan, Y. L. Liu and X. T. Shu, Catal. Commun., 2017, 101, 1–4 CrossRef CAS.
- Y. Wei, G. Li, Q. Lv, C. Cheng and H. Guo, Ind. Eng. Chem. Res., 2018, 57, 16284–16294 CrossRef CAS.
Footnote |
| † Electronic supplementary information (ESI) available. See DOI: 10.1039/d1ra08501h |
| This journal is © The Royal Society of Chemistry 2022 |