 Open Access Article
Reactive synthesis and phase evolution of W2FeB2 alloy powders
Xin Zhou ab,
Jun Liab,
Junshan Wanab,
Kangwei Chenab,
Renquan Wangab and
Ying Liu*ab
aCollege of Materials Science and Engineering, Sichuan University, Chengdu 610065, P. R. China
bRare Earth and Vanadium Titanium Materials Research Center, Sichuan University, Chengdu 610065, P. R. China. E-mail: liuying5536@163.com
First published on 23rd February 2022
Abstract
Using industrial FeB, tungsten powder, and amorphous boron powder as raw materials, W2FeB2 alloy powder was successfully prepared by reaction synthesis. The reaction mechanism was analyzed by comparing the phase compositions of the alloy powder at different temperatures and holding times. The crystal structure of the W2FeB2 phase in the alloy powder was studied, and the content of each phase in the powder was analyzed by the density of the alloy powder. The results showed that the density of the powder obtained at 1150 °C for 3 h reached 14.32 g cm−3, and the alloy powder was composed of 93.42wt% W2FeB2 phase with orthogonal structure and 6.58wt% W2B phase. The reaction synthesis process involved the diffusion of B atoms and Fe atoms into the W matrix, firstly forming binary phases such as WB, W2B, Fe2B, WxFey, and then generating ternary phases WxFeyBz, and finally forming W2FeB2 phase. The powder morphology was optimized by plasma spheroidization, and the fluidity of the powders increased with the decrease of the powder feeding rate. The powder flow rate reached 19 s/50 g with a 3 g min−1 powder feeding rate. Metastable phases such as (Fe0.6W2.8)B4 and W3.5Fe2.5B4 appeared after plasma spheroidization, but the phases could be eliminated with 1150 °C – 3 h annealing process.
1 Introduction
Borides, especially transition-metal borides, have high hardness and wear resistance, high melting point, excellent thermal conductivity, and chemical stabilities.1 In the past few decades, traditional ternary transition metal borides such as Mo2FeB2, Mo2NiB2, and WCoB have been extensively studied and widely used in applications like injection molding machines parts, can molding tools, and extruding copper molds.2–10 Ternary Fe–W–B materials also inherit the fascinating characteristics of borides11 and show considerable application potential in these fields. However, the research on Fe–W–B system materials has been very limited so far.Recently, FeWB alloy powders have been successfully prepared by reactive synthesis,1 the synthesis behavior and phase evolution during the synthesis have been studied.10,11 Amorphous Fe–W–B alloy nano-powders have been prepared by chemical reduction,12 but Fe–W–B alloy nanopowders prepared by this method have lower crystallization temperatures, i.e. their thermal stability is not satisfactory. It is well known that the thermal stability of amorphous alloys affects the range of their use dramatically. W2FeB2, which also belongs to the Fe–W–B system, however, there is currently no report on the preparation of it. In order to conduct a systematic study of Fe–W–B system materials, it is necessary to study the W2FeB2 preparation method. Further, in additive manufacturing, the high fluid spherical powder is often used as raw materials to ensure the uniformity of the powder and the density of the finished parts. The preparation of spherical powders has received increasing attention due to the rapid development of additive manufacturing.13,14 In this study, the W2FeB2 alloy powder was successfully prepared by reaction synthesis, the phase evolution process of the reaction was studied, and the morphology of the powders was optimized by plasma spheroidization.
2 Experimental
The commercial ferro boron (FeB) powder (20.97 wt% B, 1–3.0 μm) was obtained by mechanical crushing from ferro-boron bulk, tungsten (W) powder (99.99 wt% W, 5–15.0 μm) and amorphous boron powder (99.99 wt% B, 1–3.0 μm) were used as the raw materials. The raw materials were mixed according to the atomic ratio of Fe![[thin space (1/6-em)]](https://www.rsc.org/images/entities/char_2009.gif) :
:![[thin space (1/6-em)]](https://www.rsc.org/images/entities/char_2009.gif) W
W![[thin space (1/6-em)]](https://www.rsc.org/images/entities/char_2009.gif) :
:![[thin space (1/6-em)]](https://www.rsc.org/images/entities/char_2009.gif) B = 1
B = 1![[thin space (1/6-em)]](https://www.rsc.org/images/entities/char_2009.gif) :
:![[thin space (1/6-em)]](https://www.rsc.org/images/entities/char_2009.gif) 2
2![[thin space (1/6-em)]](https://www.rsc.org/images/entities/char_2009.gif) :
:![[thin space (1/6-em)]](https://www.rsc.org/images/entities/char_2009.gif) 2. The ferro-boron, tungsten, and boron powders were mixed in a rotary ball-mill in ethanol together with cemented carbide balls for 24 h. The dried mixed powders were reactively synthesized in an SDZK furnace ranging from 900 °C to 1150 °C holding 0–3 h in a vacuum. And the powders were spheroidized using the Tek-15 plasma system produced by Tekna, Canada.
2. The ferro-boron, tungsten, and boron powders were mixed in a rotary ball-mill in ethanol together with cemented carbide balls for 24 h. The dried mixed powders were reactively synthesized in an SDZK furnace ranging from 900 °C to 1150 °C holding 0–3 h in a vacuum. And the powders were spheroidized using the Tek-15 plasma system produced by Tekna, Canada.
The phase transformation of the annealed powders was performed by X-ray diffraction (XRD) with Cu Kα irradiation (λ = 0.15406 nm) with the 2θ scan range of 20–90°. The saturation magnetization of the different alloys was tested by VSM (LakeShore 7410) to determine whether the synthesized powders contain magnetic impurity phases.
Microstructure of the powders was observed by SEM (JSM-7500F) and TEM (Talos F200S G2 S/TEM), selected area electron diffraction (SAED) measurement was used to analyze the crystal structure, and the micro-zone composition analysis was carried out using energy dispersive X-ray spectrometry (EDS) system equipped to the TEM.
The iron-containing phases in powders were analyzed by the Mössbauer spectrum. The true density of the powders was measured using a 3H-2000 TD1 true density analyzer based on Archimedes principle and gas expansion method. And the fluidity of the powders was measured by a Hall flow meter.
3 Results and discussion
3.1 Reactive synthesis of W2FeB2 powders
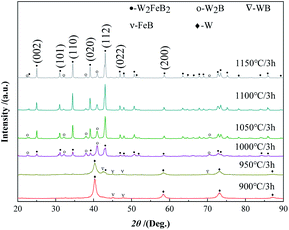
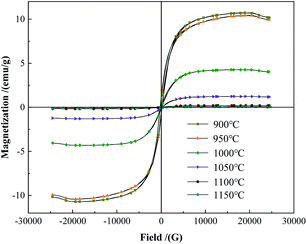
The hysteresis loops of the powder were tested and the saturation magnetization was obtained by VSM. As shown in Fig. 2, the saturation magnetization of the powder was 10.43 emu g−1 and 10.73 emu g−1 at 900 °C and 950 °C, respectively, which were similar to the raw material powder. The powder was mainly composed of W and FeB phases at this temperature (Fig. 1). At 1000 °C and 1050 °C, the saturation magnetization was 4.3 emu g−1 and 1.27 emu g−1 respectively, there still was a small amount of Fe-containing magnetic phase left in the powder. It might be the Fe2B phase that could not be detected in the XRD analysis. When the temperature increased to 1100 °C, the saturation magnetization of the powder greatly reduced to 0.19 emu g−1. The powder was almost non-magnetic, indicating that the magnetic Fe-containing phase had almost reacted completely at 1100 °C, which was consistent with the reduction of the W2B phase from 1050 °C to 1100 °C in Fig. 1. The content of the W2B phase decreased resulting from the reaction with the magnetic FeB or Fe2B phase. When the temperature further increased to 1150 °C, the saturation magnetization of the powder fell to 0.12 emu g−1.
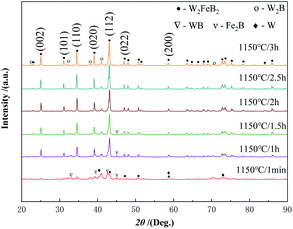
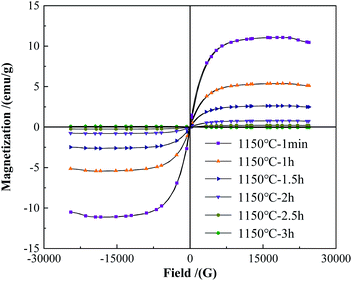
Fig. 4 shows the change of the saturation magnetization of the alloy powders under a different holding time. As the holding time increasing, the saturation magnetization of the alloy powders showed a significant decreasing trend. When the holding time was 1 min, the saturation magnetization was 12.04 emu g−1, at this time magnetic phase Fe2B phase existed in the powders as shown in Fig. 3. As the holding time increased to 1 h, the saturation magnetization of the powders decreased to 5.41 emu g−1. Further prolonged to 1.5 h, the saturation magnetization decreased to 2.49 emu g−1. When the holding time was 2 h, the saturation magnetization decreased to 0.85 emu g−1, which indicated the diffraction peak of the Fe2B phase disappeared. When the holding time continued to increase to 2.5 h, the saturation magnetization of the powder decreased to 0.19 emu g−1. At this time, the diffraction peak of the WB phase disappeared according to the XRD pattern. When the holding time continues to reach 3 h, the saturation magnetization was only 0.12 emu g−1.
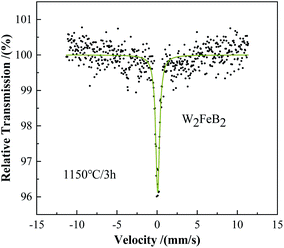
It could be concluded that when the holding time was 1 min, WB and Fe2B phases began to form in the powder first, and the content of W2FeB2 increased greatly after holding for 1 h. After holding for 2.5 h, the Fe2B phase almost reacted completely, and the powder had scarcely any magnetism. Combined with the phase composition changes of the alloy powder at different temperatures, it could be inferred that the diffusion of B atoms occurred firstly. The B atoms in FeB diffused into the W matrix to form the WB phase and Fe2B phase. In the subsequent reaction process, the WB phase transformed into the W2B phase. Finally, WB and W2B reacted with Fe2B and transformed into the W2FeB2 phase. Fig. 5 and Table 1 were the Mössbauer spectra and ultra-fine parameters of the alloy powders at 1150 °C holding for 3 h. There was only one line in the spectrum, which meant that the alloy powder contained only one iron-containing phase. It was W2FeB2 which percentage was 100%.
| Phase | Isomer shift δ (mm s−1) | Quadrupole splitting Qs (mm s−1) | Hyperfine magnetic fields Hhf (KOe) | Spectrum area ratio (%) |
|---|---|---|---|---|
| FeW2B2 | 0 | — | — | 100 |
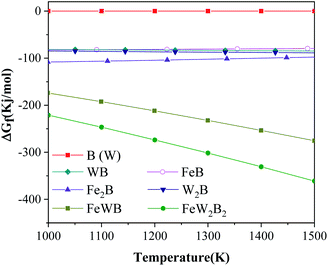
Fig. 6 shows the Gibbs free energy of the raw materials and the main phases in the Fe–W–B system during the synthesis reaction at different temperatures from 1000 K to 1500 K.15 The Gibbs free energy of W and B is 0 because they are elemental. The W2FeB2 phase has the lowest Gibbs free energy in the temperature range of 1000 K to 1500 K, which indicated that W2FeB2 is the most stable phase in this temperature range. In addition, the Gibbs free energy of W2B and Fe2B is lower than WB and FeB respectively, indicating that the transformation from WB and FeB to W2B and Fe2B meets the thermodynamic conditions.
3.2 Microstructure and true densities of alloy powder
Since the W2FeB2 phase might exist in forms of tetragonal or orthorhombic crystal structure,16 so the alloy powders (1150 °C for 3 h) had been investigated by TEM in order to confirm the real crystal structure. The results in Fig. 7a and b showed the microstructure and SAED result which indicated that the alloy powder was mono-crystalline particle with size of 500 nm. Fig. 7c showed the particle consisted of Fe, W and B elements and result of the SAED pattern in Fig. 7b showed the particle was determined to be orthogonal W2FeB2 phase (a = 3.146, b = 4.613, c = 7.121 < 90 × 90 × 90 >, Pmna 62).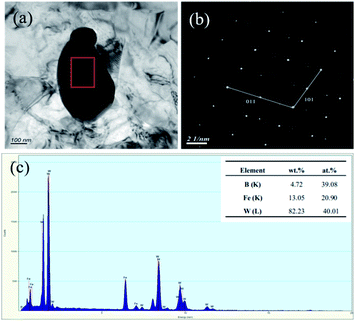 | ||
| Fig. 7 TEM results of the W2FeB2 particle: (a) bright-field TEM image of the particle; (b) selection electron diffraction analysis of (a); (c) EDX analysis result of the marked region. | ||
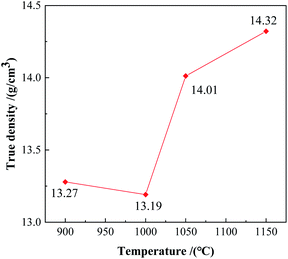
True densities of the alloy powders after being kept at different temperatures for 3 hours were shown in Fig. 8. The true density of the powder kept at 900 °C was 13.27 g cm−3, and the counterpart at 1000 °C decreased to 13.19 g cm−3. Some low-density intermediate phases formed at the beginning of the reaction. The true density rose to 14.01 g cm−3 at 1050 °C, combined with the XRD pattern in Fig. 1, there was a large amount of W2FeB2 phase in the powder at this time. At 1150 °C, the true density is further increased to 14.32 g cm−3.
It could be seen from Fig. 1 and 3 that when the temperature was kept at 1150 °C for 3 hours, there were only two phases W2FeB2 and W2B in the powder, and the content could be calculated by the following equation:11
| x + y = 1 | (1) |
| x/ρx + y/ρy = 1/ρ0 | (2) |
3.3 Reactive synthesis mechanism of W2FeB2
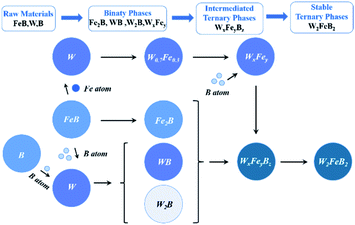
To understand the intermediate phases generated in the reaction process in detail, XRD was used to analyze the powders prepared at 1000 °C with a slow scan rate (Fig. 9). It was worthy to note that the powders contained W0.7Fe0.3 (W1−xFex type compounds, 0 ≤ x ≤ 1) phase, W1.25Fe1.75B2 (WyFe3-yB2 type compounds, 1 ≤ y ≤ 2), Fe2B, and other W–B compounds. The appearance of the W0.7Fe0.3 phase was due to the diffusion of Fe atoms into the W matrix, WB and W2B phases formed with the diffusion of B atoms into the W matrix. FeB became Fe2B after losing the B atom. Then, the interdiffusion between these binary compounds formed some metastable ternary intermediate phases WyFe3−yB2 (1 ≤ y ≤ 2, such as W1.75Fe1.25B2), under this circumstance, it could be inferred that W3−zFezB2 (1 ≤ z ≤ 2) type compounds were also formed during the reaction.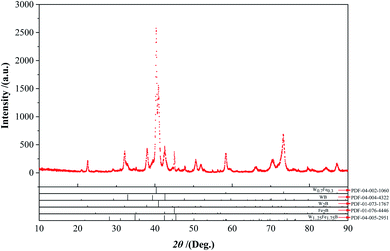 | ||
| Fig. 9 XRD analyses analysis with a slow scan rate (0.02 2θ° step size) of the powders calcined at 1000 °C. | ||
Based on the above analysis, it was clear that W2FeB2 powders were transformed from binary phase (such as Fe2B, W2B, and W0.7Fe0.3) to metastable ternary phase (WxFeyBz) and ultimately to the stable ternary phase (W2FeB2). The evolution of reactive synthesis could be briefly summarized as (Fig. 10):
| FeB + W + B → WB, W2B, Fe2B, WxFey → WxFeyBz → W2FeB2 | (3) |
3.4 Plasma spheroidization
The morphology of the powder was observed by SEM, as shown in Fig. 11a and b. The powders were irregular. The irregular shape led to poor fluidity of the synthesized powders.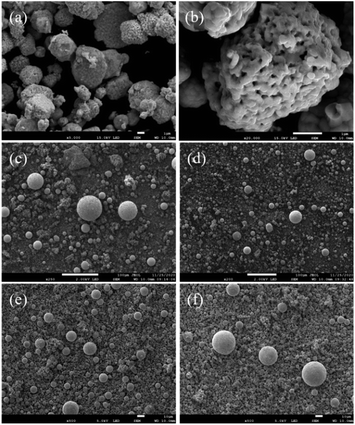 | ||
| Fig. 11 SEM images the powders before and after spheroidization: (a and b) before spheroidization; (c) 33g min−1; (d) 16g min−1; (e) 6g min−1; (f) 3g min−1. | ||
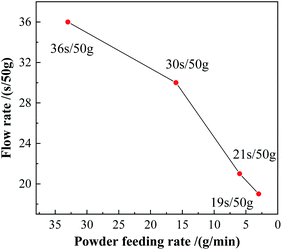
The plasma spheroidization method was used to optimize the morphology of the powders. As shown in Fig. 11c and d, when the powder feeding rate was 33 g min−1 and 16 g min−1, the proportion of powders being spheroidized was relatively low, the particle size of the powder was uneven, and presented powder aggregation. In Fig. 11e and f, the powder feeding rate reduced to 6 g min−1 and 3 g min−1, respectively. The proportion of the spheroidized powder increased obviously, the particle size was more uniform, and the number of agglomerates in the powders reduced. Reducing the powder feeding rate made the powders heated more uniformly in the high-temperature zone, which was beneficial to the liquefaction of the powder. Therefore, the spheroidization effect of the powder was better at a low powder feeding rate.13,17 The fluidity of the powders after spheroidization is shown in Fig. 12. When the powder feeding rate was 3g min−1, the flow rate of the powder reached 19 s/50 g.
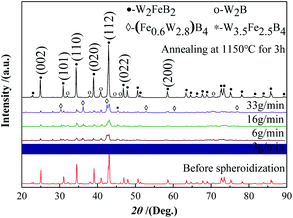
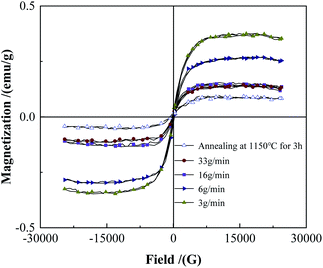
Fig. 13 and 14 show the XRD and saturation magnetization (Ms) of the powders after spheroidization, respectively. With the powder feeding rate dropped to 3 g min−1, two metastable phases appeared in the powders, which were (Fe0.6W2.8) B4 phase and W3.5Fe2.5B4 phase. In addition, the saturation magnetization of the powders also increased with the decrease of the powder feeding rate, indicating that the content of the magnetic phase in the powders increased. Because the powders were rapidly cooled after melting in the high-temperature zone of the plasma, the atoms in the droplets are too late to diffuse sufficiently, and the segregation of the metastable phases appeared consequently.
4 Conclusions
With raw materials FeB, W, and amorphous boron powder, W2FeB2 alloy powder could be synthesized successfully when heated at 1150 °C for 3 h. The content of the W2FeB2 phase and W2B phase in the synthesized powders were 93.42 wt% and 6.58 wt% respectively. The reaction synthesis proceeded by the diffusion of B atoms and Fe atoms into the W matrix. The phase transition process of the reaction was described as follows:| Fe + W → WB, W2B, Fe2B, WxFey → WxFeyBz → W2FeB2 | (4) |
Using the plasma spheroidization method to optimize the powder morphology made the fluidity of the powder improve significantly. And the fluidity of the powder increased with the reduction of the powder feeding rate. And the segregation of components that appeared during powder spheroidization could be eliminated by annealing at 1100 °C for 3 h.
Conflicts of interest
There are no conflicts to declare.Acknowledgements
This work is supported by the Joint Fund of the Ministry of Education [6141A020222], the Major Science and Technology Special Project of Sichuan Province [2019ZDZX001-4] and the Fundamental Research Funds for the Central Universities [YJ201910].References
- J. L. Li, J. Li and C. Li, et al. Reactive synthesis of FeWB powders and preparation of bulk materials[J], Int. J. Refract. Met. Hard Mater., 2014, 46, 80–83 CrossRef CAS.
- J. Zhang, Y. Zheng and W. Zhou, et al. Effects of Cr content on the microstructure and mechanical properties of Mo2FeB2-based cermets prepared via vacuum sintering[J], Vacuum, 2018, 155, 509–513 CrossRef CAS.
- Y. Haizhou, L. Wenjun and F. Ping, et al. Synthesis and microstructure evolution during vacuum sintering of Mo2FeB2 based cermets[J], Int. J. Refract. Met. Hard Mater., 2014, 45, 48–52 CrossRef.
- H. Yu, Y. Zheng and W. Liu, et al. Effect of Mn content on the microstructure and mechanical properties of Mo2FeB2 based cermets[J], Int. J. Refract. Met. Hard Mater., 2010, 28(2), 286–290 CrossRef CAS.
- K.-I. Takagi, W. Koike and A. Momozawa, et al. Effects of Cr on the properties of Mo2NiB2 ternary boride[J], Solid State Sci., 2012, 14(11–12), 1643–1647 CrossRef CAS.
- Y. Yamasaki, M. Nishi and K.-I. Takagi, Development of very high strength Mo2NiB2 complex boride base hard alloy[J], J. Solid State Chem., 2004, 177(2), 551–555 CrossRef CAS.
- J. Zhang, Y. Zheng and J. Chen, et al. Microstructures and mechanical properties of Mo2FeB2-based cermets prepared by two-step sintering technique[J], Int. J. Refract. Met. Hard Mater., 2018, 72, 56–62 CrossRef CAS.
- T. Zhang, H. Yin and C. Zhang, et al. First-principle calculations of mechanical properties and electronic structure of WCoB and Cr doped WCoB under high pressure[J], Mater. Res. Express, 2019, 6(11), 116320 CrossRef.
- T. Zhang, H. Yin and C. Zhang, et al. First-Principles Study on the Mechanical Properties and Electronic Structure of V Doped WCoB and W2CoB2 Ternary Borides[J], Materials, 2019, 12(6), 967–983 CrossRef CAS PubMed.
- C. Li, J. Li and J. Li, et al. Study on the synthesis behavior of Fe–W–B powders and the preparation of bulk[J], Adv. Powder Technol., 2015, 26(5), 1410–1416 CrossRef CAS.
- C. Li, J. Li and Y. Liu, Phase evolution of Fe–W–B powders and stability of FeWB ternary boride prepared by reactive synthesis[J], Mater. Res. Express, 2018, 5(1), 016517 CrossRef.
- G. Yi, Y. Guo and B. W. Zhang, Preparation and thermal properties of amorphous Fe–W–B alloy nano-powders[J], J. Mater. Process. Technol., 1998, 74, 10–13 CrossRef.
- Z. H. Hao, Z. H. Fu and J. T. Liu, et al. Spheroidization of a granulated molybdenum powder by radio frequency inductively coupled plasma[J], Int. J. Refract. Met. Hard Mater., 2019, 82, 15–22 CrossRef CAS.
- H. F. Gu, H. J. Gong, J. J. S. Dilip, et al. Effects of powder variation on the microstructure and tensile strength of ti6al4v parts fabricated by selective laser melting[J], 2014 International Solid Freeform Fabrication Symposium, University of Texas at Austin, 2014, pp. 470-483 Search PubMed.
- X. Ouyang, F. Yin and J. Hu, et al. Experimental investigation and thermodynamic calculation of the B–Fe–W ternary system[J], Calphad, 2018, 63, 212–219 CrossRef CAS.
- G. Q. Yang, H. Q. Yin and Z. F. Xu, et al. A first-principles-calculation exploration of ternary borides as potential alternatives to WC–Co[J], J. Alloys Compd., 2019, 719, 761–772 CrossRef.
- J. He, L. Bai and H. Jin, et al. Optimization of tungsten particles spheroidization with different size in thermal plasma reactor based on numerical simulation[J], Powder Technol., 2016, 302, 288–297 CrossRef CAS.
| This journal is © The Royal Society of Chemistry 2022 |

