 Open Access Article
A novel electrochemical sensor for glyphosate detection based on Ti3C2Tx/Cu-BTC nanocomposite
Shan Wanga,
Yanqing Yaoa,
Jia Zhaoa,
Xuhui Hana,
Chunpeng Chai *a and
Pei Dai*b
aSchool of Materials Science and Engineering, Beijing Institute of Technology, Beijing 100081, China. E-mail: chaicp@bit.edu.cn
bBeijing Key Laboratory of Radiation Advanced Materials, Beijing Research Center for Radiation Application Co.,Ltd., Beijing 100015, China. E-mail: daipei008@126.com
First published on 10th February 2022
Abstract
The copper benzene-1,3,5-tricarboxylate (Cu-BTC) with outstanding chemical and physical properties, is a novel and promising material in the field of electrochemical sensing. However, it has significant limitations for direct application in electrochemical sensing due to the relatively weak conductivity of Cu-BTC. Here, the conductivity of Cu-BTC was improved by loading Cu-BTC onto two-dimensional Ti3C2Tx nanosheets with high conductivity. Thanks to the synergistic effect produced by the high conductivity of Ti3C2Tx and the unique catalytic activity of Cu-BTC, the Ti3C2Tx/Cu-BTC nanocomposite exhibits excellent sensing performance for glyphosate, with a low limit of detection (LOD) of 2.6 × 10⁻¹⁴ M and wider linear sensing range of 1.0 × 10⁻¹³ to 1.0 × 10⁻⁶ M. Moreover, the electrochemical sensor based on Ti3C2Tx/Cu-BTC also shows excellent selectivity, good reproducibility and stability.
1. Introduction
Glyphosate (N-(phosphonomethyl)glycine) is a broad-spectrum, non-selective organophosphorus herbicide, which is widely used in the field of weed and vegetation control in agriculture, industry and household use.1–5 With the advancement of productivity, industry and agriculture have generally achieved automation, the use of glyphosate and other pesticides has also increased day by day, and the potential harm of glyphosate has also attracted more and more attention.6,7 Although there are still controversies about whether glyphosate is carcinogenic, the long-term and large-scale use of glyphosate has caused harm to humans, animals, plants, and the environment. Therefore, it is necessary to develop a simple, efficient, and highly selective method for detecting glyphosate.Compared with liquid chromatography, gas chromatography and other analytical sensing methods for glyphosate, electrochemical sensing has the advantages of low cost, simple operation, easy to carry, high sensitivity, and less sample consumption.8–10 Although glyphosate is a non-electroactive compound and cannot be measured at an accessible potential, there have been reports of electrochemical sensing of glyphosate by modifying the electrode and processing the sample.11–13 Prasad et al.14 constructed an electrochemical sensor based on a graphite electrode modified by a dual-template imprinted polymer nanomembrane and used it to detect glyphosate in soil. The linear response range and the limit of detection of the sensor to glyphosate are 3.98–176.23 ng ml−1 and 0.35 ng ml−1, respectively. Khenifi et al.15 developed an electrochemical sensing platform based on NiAl-LDH layered double hydroxide (LDH) by co-depositing NiAl-LDH on the surface of the Pt electrode and applied it to glyphosate sensing. The detection mechanism is the electrocatalytic oxidation of Ni3+ in NiAl-LDH to the amine group in glyphosate. The LOD and linear response ranges of the sensor to glyphosate are 1 × 10⁻⁶ M and 1 × 10⁻⁵ to 9 × 10⁻⁴ M, respectively. Although these methods provide new ideas for the electrochemical detection of glyphosate, there are still some problems such as complex preparation processes, high limit of detection, wide detection range and poor anti-interference and stability. Therefore, it is of great value to develop an electrochemical sensor for glyphosate detection with excellent comprehensive performance such as simple process, high detection efficiency, excellent anti-interference.
Metal–organic frameworks (MOFs) materials have a wide range of applications. Due to their large specific surface area, high porosity, controllable structure and abundant active metal sites,16–18 MOFs materials are widely used in the fields of adsorption–separation, gas storage and catalysis.19–21 And it is worth noting that in recent years, MOFs have been used more as electrochemical sensing platforms to detect certain substances, such as hydrogen peroxide,22,23 dopamine,24,25 hydrazine26,27 and ascorbic acid.28,29 Cu-BTC is a kind of MOFs material formed by self-assembly of metal Cu2+ and organic ligand trimesic acid.30–32 Ji et al.33 first applied it to the electrochemical sensing of sunset yellow and lemon yellow. Cao et al.34 creatively applied Cu-BTC to the electrochemical sensing of glyphosate. The sensing mechanism is based on the fact that the phosphate groups, amine groups and carboxyl groups in glyphosate easily combine with Cu2+ in Cu-BTC to form a glyphosate–Cu2+ complex, thereby inhibiting the current response. However, due to the poor conductivity of Cu-BTC, its direct application in electrochemical sensing still has a lot of limitations. Therefore, combining Cu-BTC with other conductive materials to amplify the sensing signal and improve the electrochemical sensing performance is a promising method.35,36 As a new type of two-dimensional nanomaterial, MXenes not only has the characteristics of large specific surface area, outstanding hydrophilicity and abundant surface functional groups, but more importantly, it has ultra-high conductivity.37–41 Its combination with Cu-BTC compounding can give full play to the synergistic effect of the two, which is of great significance in the electrochemical sensing of glyphosate.
In this article, two-dimensional material Ti3C2Tx was first prepared by chemical etching, then Cu-BTC was grown by in situ growth method using Ti3C2Tx nanosheets as a template, and finally, the prepared Ti3C2Tx/Cu-BTC nanocomposite was passed through the adsorption method to be modified on a glassy carbon electrode (GCE), constructing an electrochemical sensor for glyphosate detection to achieve high-efficiency sensing of glyphosate.
2. Experimental section
2.1. Materials
Ti3AlC2 powder (400 mesh) was obtained from 11 Technology Co., Ltd (JiLin, China). Co(NO3)2·6H2O, 2-methylimidazole, glyphosate, NaOH, KCl and NaCl were purchased from Beijing Chemical Works (China). Lithium fluoride (LiF, 98.5%), hydrochloric acid (HCl, 37%) were bought from Sigma Aldrich. All chemicals were of analytical grade and used as received without further purification.2.2. Preparation of Ti3C2Tx
Add 1 g of lithium fluoride to a polypropylene plastic bottle containing 20 ml of 9 M hydrochloric acid, and continue stirring for 0.5 h to ensure that the lithium fluoride is completely dissolved. Slowly add 1 g Ti3AlC2 to the hydrochloric acid solution in which lithium fluoride is dissolved, and then stir the reaction at 35 °C for 48 h, and wash the etching product with deionized water until the supernatant pH ≥ 6 to obtain multilayer Ti3C2Tx. Under the conditions of ice-water bath and argon protection, the multilayer Ti3C2Tx solution was sonicated for 1 h, and then centrifuged at a speed of 3500 rpm to obtain a monolayer/small-layer Ti3C2Tx dispersion. The obtained single-layer/small-layer Ti3C2Tx dispersion was freeze-dried for 48 h to obtain Ti3C2Tx nanosheets.2.3. Preparation of Cu-BTC
The synthesis of pure Cu-BTC followed that described in the literature.31 1,3,5-Trimesic acid (0.875 g) and copper nitrate trihydrate (1.82 g) were respectively dissolved in 50 ml methanol solvent to prepare mixed solutions A and B, and stir for 0.5 h respectively. Then add mixed solution B to mixed solution A, stir vigorously for 5 min, and then stand at room temperature for 24 h. Finally, the product obtained after standing was centrifuged and washed with methanol, and the Cu-BTC was obtained by freeze-drying for 24 h.2.4. Preparation of Ti3C2Tx/Cu-BTC composite
Solutions A and B were prepared in “2.3. Preparation of Cu-BTC”. Measure 10 ml Ti3C2Tx aqueous solution (5 mg ml−1), and slowly add it to the mixed solution B, and continue to stir for 0.5 h. After the stirring, add mixed solution A, stir vigorously for 5 min, and then stand at room temperature for 24 h. Finally, the product obtained after standing was centrifuged and washed with methanol, and the Ti3C2Tx/Cu-BTC composite was obtained by freeze-drying for 24 h.2.5. Preparation of Ti3C2Tx/Cu-BTC/GCE
Grind and polish the glassy carbon electrode (GCE) to a mirror-like surface with 0.05 μm and 0.3 μm alumina powder, respectively. Weigh 10 mg of Ti3C2Tx/Cu-BTC composite and ultrasonically disperse it in 5 ml of ethanol, then use a pipette to pipette 10 μL of the dispersion onto the surface of GCE, and dry it in a vacuum oven for 10 min (room temperature) to get Ti3C2Tx/Cu-BTC/GCE.2.6. Instrumentation and measurements
The morphologies of the samples were observed by scanning electron microscopy (SEM, SU8020). X-ray powder diffraction (XRD) spectra analyses the crystal structure of samples were carried out by the Bruker D8 with a Cu Kα radiation at a scan speed of 5° min−1 and a step size of 0.02°. X-ray photoelectron spectroscopy (XPS) analyses of the Ti3C2Tx/Cu-BTC nanocomposite were carried out by the Thermo ESCLAB 250 Xi (ThermoFisher Scientific, USA). The automatic specific surface and porosity analyzer model (ASAP 2020) was used to characterize the specific surface area of samples. All electrochemical properties were recorded by the IviumStat Electrochemical Workstation with a three electrodes system. In this system, the glassy carbon electrode (GCE) was used as the working electrode, and Ag/AgCl and platinum flat were employed as the reference and counter electrode, respectively.3. Results and discussion
3.1. Formation of Ti3C2Tx/Cu-BTC nanocomposite
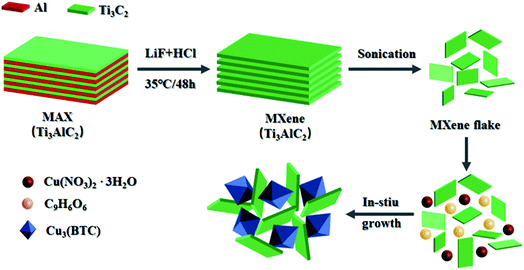
The preparation process of Ti3C2Tx/Cu-BTC composite is shown in Fig. 1 clearly. Ti3C2Tx–MXene nanosheets are obtained by etching and stripping the MAX phase Ti3AlC2 in the beginning. Then using Ti3C2Tx nanosheets as a template to grow Cu-BTC in situ to obtain Ti3C2Tx/Cu–BTC complex. During the in situ growth of Cu-BTC, Cu2+ is adsorbed on the surface by the electrostatic effect. In the end, the O atoms of trimesic acid and Cu2+ rapidly nucleate through coordination reaction on the surface of Ti3C2Tx nanosheets, and grow into Cu-BTC to obtain Ti3C2Tx/Cu-BTC composites.3.2. Morphology of Ti3C2Tx/Cu-BTC nanocomposite
Fig. 2(a) is SEM image of the precursor MAX phase Ti3AlC2. It exhibited that Ti3AlC2 has a tightly stacked three-dimensional layered structure. When the Al layer in Ti3AlC2 is etched and eliminated, a multilayer Ti3C2Tx with an accordion-like structure formed by weak van der Waals forces or hydrogen bonds is obtained, as shown in Fig. 2(b). Fig. 2(c) is the TEM image of the single-layer/small-layer Ti3C2Tx nanosheets obtained after ultrasonic peeling of multilayer Ti3C2Tx. It can be seen that the multilayer Ti3C2Tx is ultrasonically peeled to obtain a thin to transparent single layer or stack of single layers. Fig. 2(d) is the SEM image of the Cu-BTC sample. It can be seen that the Cu-BTC cubic crystal is a typical octahedral geometry, and its size is about 2 μm. Fig. 2(e) and (f) are the SEM images of T3C2Tx/Cu-BTC composites under different magnifications. It can be seen that Ti3C2Tx does not affect the growth of Cu-BTC crystals, but it is different from Ti3C2Tx/ZIF-8 and Ti3C2Tx/ZIF-67. The difference is because the size of Cu-BTC is equal to or larger than Ti3C2Tx nanosheets, the Ti3C2Tx/Cu-BTC nanocomposite is finally presented in the form of Ti3C2Tx nanosheets interspersed between Cu-BTC.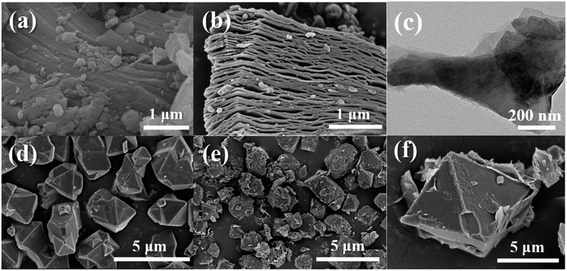 | ||
| Fig. 2 SEM images of (a) Ti3AlC2, (b) multilayer Ti3C2Tx, (d) Cu-BTC, (e) and (f) Ti3C2Tx/Cu-BTC; (c) TEM images of monolayer/small-layer Ti3C2Tx nanosheets. | ||
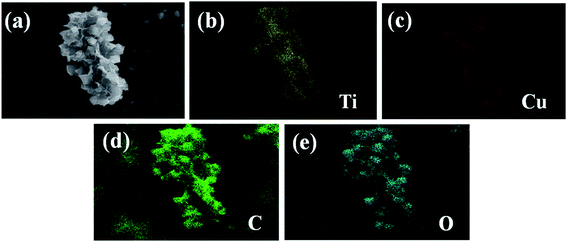
EDS element mapping analysis on the Ti3C2Tx/Cu-BTC nanocomposite was carried out to explore its element composition and distribution. Fig. 3(a) is the SEM image of Ti3C2Tx/Cu-BTC composite material. To perform EDS element mapping analysis in this area, and the EDS element mapping spectrum containing the elements Ti, Cu, C and O was obtained. Fig. 3(c–f) are EDS element maps of independent elements (Ti, Cu, C and O). Ti element belongs to Ti3C2Tx, Cu element is the characteristic element of Cu-BTC, and C and O elements are at the same time existing in Ti3C2Tx and Cu-BTC, which further indicates the successful preparation of Ti3C2Tx/Cu-BTC composites.
3.3. Crystal structure of Ti3C2Tx/Cu-BTC nanocomposite
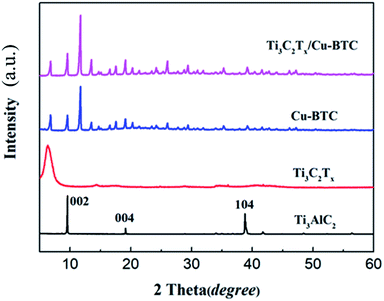
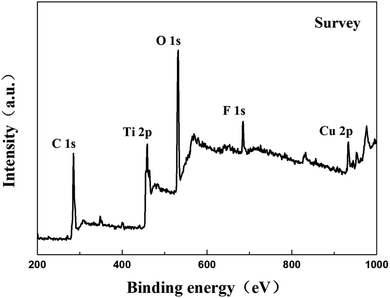
Fig. 4 shows the X-ray diffraction spectrum of Ti3AlC2, Ti3C2Tx, Cu-BTC and Ti3C2Tx/Cu-BTC nanocomposites. The X-ray diffraction spectrum of MAX phase Ti3AlC2 shows all the characteristic peaks, among which the diffraction peaks at 9.58°, 19.2° and 39.04° correspond to the (002), (004) and (104) characteristic peaks of crystal Ti3AlC2, respectively. The X-ray diffraction pattern of Ti3C2Tx showed that the characteristic peaks (004 and 104) of Ti3AlC2 disappeared, and the diffraction peak (002) shifted to a smaller angle, proving that Ti3AlC2 was successfully etched into Ti3C2Tx. The characteristic peaks of X-ray diffraction of Cu-BTC and the characteristic peaks of Cu-BTC reported can match well, which proves the successful preparation of Cu-BTC. The X-ray diffraction pattern of Ti3C2Tx/Cu-BTC can well identify the diffraction characteristic peaks of Cu-BTC and Ti3C2Tx, which indicates that the presence of Ti3C2Tx will not affect the growth of Cu-BTC crystals, which further indicates successful preparation of Ti3C2Tx/Cu-BTC composite material.The surface properties of the Ti3C2Tx/Cu-BTC composite were further studied by XPS. Fig. 5 shows the XPS full spectrum of the Ti3C2Tx/Cu-BTC composite. It can be seen from the figure that the six peaks of Ti3C2Tx/Cu-BTC at 298 eV, 475 eV, 545 eV, 685 eV and 965 eV correspond to the elements C 1s, Ti 2p, O 1s, F 1s and Cu 2p, respectively. Cu 2p is a characteristic element of Cu-BTC and Ti 2p was derived from Ti3C2Tx, which was similar with the XPS spectra of Ti3C2Tx (ref. 41–43) and Cu-BTC.30,44,45 The characterization result further indicated the successful preparation of Ti3C2Tx/Cu-BTC composites.
3.4. Surface area and porosity of Ti3C2Tx/Cu-BTC nanocomposite
In order to further analyze the pore structure of Cu-BTC and Ti3C2Tx/Cu-BTC composites, the surface area and pore size distribution of Cu-BTC and Ti3C2Tx/Cu-BTC were tested. The results are shown in Table 1 and Fig. 6. Fig. 6(a) and (c) are the N2 adsorption–desorption isotherms of Cu-BTC and Ti3C2Tx/Cu-BTC, respectively. It can be seen that both Cu-BTC and Ti3C2Tx/Cu-BTC are typical I-type adsorption isotherms. The curve shows that Cu-BTC and Ti3C2Tx/Cu-BTC are both microporous structures. At the same time, Fig. 6(b) and (d) are the pore size distribution curves of Cu-BTC and Ti3C2Tx/Cu-BTC, respectively. It can be seen that the pore size distribution is mainly concentrated around 1.5 nm, which is consistent with the corresponding adsorption–desorption isotherms.| Sample name | Surface area (m2 g−1) | Average pore size (nm) |
|---|---|---|
| Cu-BTC | 1511 | 1.525 |
| Ti3C2Tx/Cu-BTC | 874 | 1.593 |
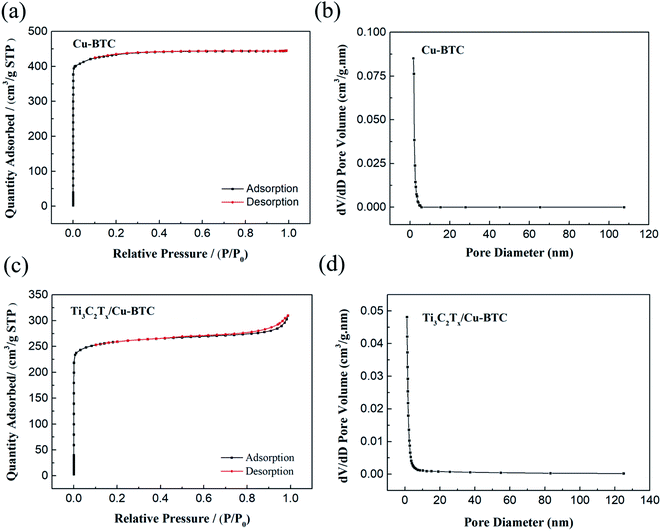 | ||
| Fig. 6 (a) Cu-BTC and (c) Ti3C2Tx/Cu-BTC N2 adsorption–desorption isotherms; (b) Cu-BTC and (d) Ti3C2Tx/Cu-BTC pore size distribution curves. | ||
It can be seen from Table 1 that the average pore diameter of Cu-BTC and Ti3C2Tx/Cu-BTC composite materials are both about 1.5 nm, which shows that the addition of Ti3C2Tx nanosheets does not affect the formation of Cu-BTC crystals. In addition, the specific surface areas of Cu-BTC and Ti3C2Tx/Cu-BTC are 1511 m2 g−1 and 874 m2 g−1, respectively. The specific surface area of Ti3C2Tx/Cu-BTC is smaller than that of Cu-BTC because Ti3C2Tx nanosheets with a dense film structure do not contribute much to the specific surface area during the specific surface area test, and the decrease in the proportion of Cu-BTC in the unit mass results in that specific surface area of Ti3C2Tx/Cu-BTC is lower than pure Cu-BTC.
3.5. Electrochemical impedance analysis of Ti3C2Tx/Cu-BTC/GCE
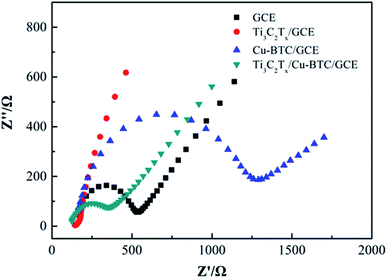
As shown in Fig. 7, the conductivity of GCE modified with different materials was analyzed by electrochemical impedance spectroscopy (EIS). It can be seen from the figure that bare GCE shows a large semicircular area at high frequency, and Cu-BTC/GCE shows a larger semicircular area, and its semicircular diameter further increases, which proves the inherent insulation properties of Cu-BTC. Compared with GCE and Cu-BTC/GCE, the EIS spectrum of Ti3C2Tx/GCE has no obvious semicircular area, even close to linearity, which further shows that Ti3C2Tx has ultra-high electrical conductivity. For Ti3C2Tx/Cu-BTC/GCE, the semicircle diameter is between that of Ti3C2Tx/GCE and GCE, which shows that Ti3C2Tx can effectively improve the low conductivity characteristics of Cu-BTC. The combination of Ti3C2Tx and Cu-BTC exhibited excellent synergy. On one hand, Cu-BTC as the matrix could fix and disperse the Ti3C2Tx to prohibit Ti3C2Tx aggregation. On the other hand, Ti3C2Tx loading on the Cu-BTC is helpful to enhance the conductivity and electrocatalytic activity. So a fast electronic channel in Ti3C2Tx/Cu-BTC is formed between the electrode and the electrolyte, which is expected to become a good platform for sensing applications.3.6. Electrochemical behaviors of Ti3C2Tx/Cu-BTC/GCE
The electrochemical behaviors of Ti3C2Tx/Cu-BTC nanocomposite between different modified electrodes and glyphosate in 0.1 M phosphate-buffered saline (PBS) were measured by cyclic voltammetry to analyze the applicability for electrochemical sensing of glyphosate. Fig. 8 shows the cyclic voltammetry curves of GCE, Cu-BTC/GCE and Ti3C2Tx/Cu-BTC/GCE with and without glyphosate added to 0.1 M PBS electrolyte. It can be seen from the figure that the graph of bare GCE is a smooth curve without obvious redox peaks. Compared with bare GCE, the graph of Cu-BTC/GCE has a pair of obvious redox peaks, which are formed by the mutual conversion of Cu(II) and Cu(I). In addition, compared with Cu-BTC/GCE, the graph of Ti3C2Tx/Cu-BTC/GCE also has similar redox peaks, and its response peak current is much larger than Cu-BTC/GCE, which can be attributed to the high conductivity of Ti3C2Tx nanosheets greatly improving the inherent weak conductivity of Cu-BTC, and therefore Ti3C2Tx/Cu-BTC/GCE has a higher electron transfer rate.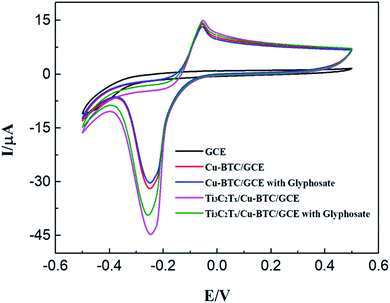 | ||
| Fig. 8 (a) The cyclic voltammetry graph of bare/GCE, Cu-BTC/GCE, Ti3C2Tx/Cu-BTC/GCE in 0.1 M phosphate-buffered saline (PBS) with and without glyphosate. | ||
When glyphosate is added to the PBS electrolyte, the oxidation peak currents of Cu-BTC/GCE and Ti3C2Tx/Cu-BTC/GCE are reduced. This is due to the coordination of Cu-BTC and glyphosate, which inhibits the mutual conversion of Cu(II) and Cu(I) in Cu-BTC, leading to a decrease in response current. It is worth noting that, compared with Cu-BTC/GCE, the peak response current of Ti3C2Tx/Cu-BTC/GCE is significantly reduced. Because the glyphosate electrochemical sensor realizes the electrochemical detection of glyphosate through the difference in response current shown by the blank sample and the sample with glyphosate added. Therefore, compared with Cu-BTC, Ti3C2Tx/Cu-BTC/GCE has a larger response peak current and a more obvious response current difference, which has advantages in the electrochemical sensing of glyphosate.
3.7. Quantitative sensing of glyphosate by Ti3C2Tx/Cu-BTC/GCE
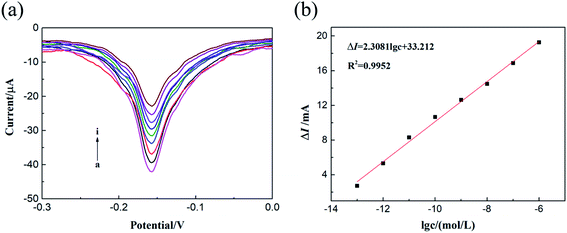
Differential pulse voltammetry (DPV) is of great significance in the sensory analysis of ultra-low concentration analytes. Ti3C2Tx/Cu-BTC/GCE showed excellent sensing performance in the cyclic voltammetry test of glyphosate. The analyte glyphosate was further analyzed quantitatively by DPV method, and the results are shown in Fig. 9. When the concentration of glyphosate is 0, it shows a higher response peak current. As the concentration of glyphosate increases from 0 to 1 × 10⁻¹³ M, the response peak current gradually decreases. This is because as the concentration of glyphosate increases, the more glyphosate–Cu2+ complex will be formed. Fig. 9(b) shows the relationship between the current peak value change (ΔI) and the glyphosate concentration. It can be seen that the current peak change value (ΔI) is linearly related to the glyphosate concentration, and the linear range is 1.0 × 10⁻¹ to 1.0 × 10⁻⁶ M, the linear regression equation is ΔI = 2.3081![[thin space (1/6-em)]](https://www.rsc.org/images/entities/char_2009.gif) lg
lg![[thin space (1/6-em)]](https://www.rsc.org/images/entities/char_2009.gif) c + 33.212. In addition, the limit of detection based on Ti3C2Tx/Cu-BTC/GCE calculated by the glyphosate sensor is 2.6 × 10⁻¹⁴ M. This indicates that the glyphosate electrochemical sensor based on Ti3C2Tx/Cu-BTC composite material has a wide linear response range and a low detection limit. The excellent detection performance of the sensor is attributed to the excellent conductivity of Ti3C2Tx and the unique interaction between Cu-BTC and glyphosate.
c + 33.212. In addition, the limit of detection based on Ti3C2Tx/Cu-BTC/GCE calculated by the glyphosate sensor is 2.6 × 10⁻¹⁴ M. This indicates that the glyphosate electrochemical sensor based on Ti3C2Tx/Cu-BTC composite material has a wide linear response range and a low detection limit. The excellent detection performance of the sensor is attributed to the excellent conductivity of Ti3C2Tx and the unique interaction between Cu-BTC and glyphosate.
Fig. 10 shows the comparison of the detection range and detection limit of Ti3C2Tx/Cu-BTC and other glyphosate testing equipment.46–49 It can be seen that Ti3C2Tx/Cu-BTC has the lowest LOD (2.6 × 10⁻¹⁴ M) while ensuring a wide detection range (1.0 × 10⁻¹³ to 1.0 × 10⁻⁶ M). It is worth noting that the limit of detection based on Ti3C2Tx/Cu-BTC is even lower than that of the C3N4/Cu-BTC sensor (1.3 × 10⁻¹³ M)49 with the same modification of Cu-BTC. The good detection performance of Ti3C2Tx/Cu-BTC is contributed by the high conductivity of Ti3C2Tx and the strong interaction of Cu-BTC and glyphosate. All the above shows that Ti3C2Tx/Cu-BTC has obvious advantages as a sensor for detecting glyphosate. It means that Ti3C2Tx/Cu-BTC is an effective electrode material and has great potential in glyphosate detection.
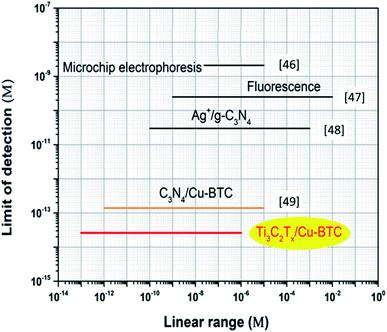 | ||
| Fig. 10 Comparison of detection range and detection limit of Ti3C2Tx/Cu-BTC and other glyphosate sensors.46–49 | ||
3.8. Sensing mechanism of glyphosate by Ti3C2Tx/Cu-BTC/GCE
As shown in Fig. 11, Ti3C2Tx/Cu-BTC/GCE showed excellent electrochemical sensing performance for glyphosate. The Ti3C2Tx/Cu-BTC nanocomposite material was modified on the surface of the glass carbon electrode (GCE) by the drop-casting method to obtain Ti3C2Tx/Cu-BTC/GCE. In the electrochemical sensing process of glyphosate, the synergistic effect of the Ti3C2Tx/Cu-BTC nanocomposite material greatly promotes the electrochemical sensing effect of glyphosate. In this process, the oxidation–reduction reaction of Cu-BTC (the mutual conversion of Cu(II) and Cu(I)) generates a response current. When glyphosate is added or the concentration of glyphosate increases, the phosphate groups, secondary amino groups and carboxyl groups in glyphosate have a strong affinity for Cu2+ in Cu-BTC, and glyphosate is easily adsorbed on the metal structure center of Cu-BTC to form a glyphosate–Cu2+ complex, which hinders the transfer of electrons and reduces the response current. The response current reduction value is proportional to the glyphosate concentration, and the glyphosate concentration is evaluated based on the change in the response current before and after the reaction.It is worth mentioning that due to the inherent insulation of Cu-BTC, the electrochemical detection of glyphosate using Cu-BTC alone has problems such as low response current and small current change. Introduction of 2D nanosheet into basic material could supply good sensitivity since 2D nanomaterials are used as the channel material to fabricate sensor.50 Therefore by combining Ti3C2Tx with high conductivity and Cu-BTC, the conductivity of Cu-BTC can be greatly improved, the response current and current change value can be increased, and the sensing signal can be significantly amplified.
3.9. Anti-interference, reproducibility and stability of Ti3C2Tx/Cu-BTC/GCE
Anti-interference is an important performance of electrochemical sensors in practical applications. The differential pulse voltammetry (DPV) was employed to investigate the interference substances that may exist in practical applications of glyphosate electrochemical sensors based on Ti3C2Tx/Cu-BTC. Evaluation of anti-jamming performance. To research the selectivity of Ti3C2Tx/Cu-BTC to glyphosate, five common pesticides including parathion, metron, Dipterex, deltamethrin and acetochlor were selected as interference substances. In the anti-interference performance test, except that glyphosate was replaced with the same concentration of interfering substances, the other test conditions remained relatively consistent. Fig. 12 shows the relationship of current peak change value (ΔI) and corresponding sensor concentration (logarithm) of Ti3C2Tx/Cu-BTC to glyphosate, parathion, metron, Dipterex, deltamethrin and acetochlor. It can be seen from Fig. 12 that as the concentration of the detection substance increases, only the ΔI corresponding to glyphosate increases and shows a relatively linear relationship, while the ΔI of other detection substances is very small and almost remains unchanged. Therefore, the prepared Ti3C2Tx/Cu-BTC/GCE sensor has excellent anti-interference ability in the electrochemical detection of glyphosate.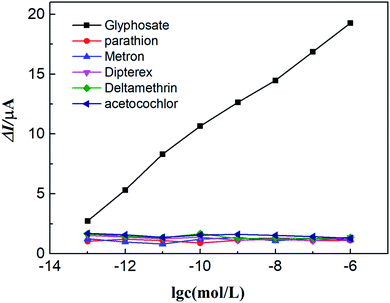 | ||
| Fig. 12 The relationship between the ΔI of Ti3C2Tx/Cu-BTC/GCE for different detection substances and the logarithm of concentration. | ||
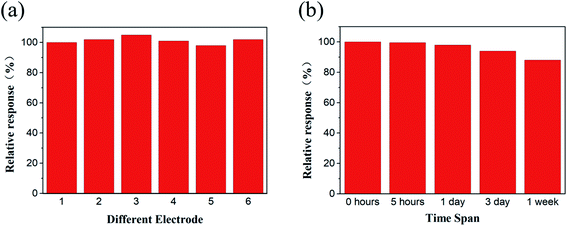
The reproducibility of the sensor was explored by continuously testing 6 Ti3C2Tx/Cu-BTC/GCE of the same batch under the same conditions. As shown in Fig. 13(a), the relative standard deviation of the obtained response current is 2.3%, which indicates that the sensor has good reproducibility. In order to further study the stability of the prepared sensor, the prepared Ti3C2Tx/Cu-BTC/GCE was stored in the same storage environment for 5 hours, 1 day, 3 days and 1 week, according to the activity change of the sensor after different storage time to evaluate the stability of the sensor. As shown in Fig. 13(b), the sensor still retains 88.6% of its activity after 1 week of storage, indicating that the sensor has excellent stability.
4. Conclusions
In conclusion, this paper reported the preparation of an electrochemical sensor based on Ti3C2Tx/Cu-BTC for the electrochemical sensing of glyphosate using a facile method for the first time. The electrochemical sensor based on Ti3C2Tx/Cu-BTC combines the advantages of high electric conductivity and unique electrocatalytic activity, thus having high sensing performance for glyphosate, including a low limit of detection (2.6 × 10⁻¹⁴ M) and wide linear response range (1.0 × 10⁻¹³ to 1.0 × 10⁻⁶ M). In addition, experimental results show that it also has good stability and anti-interference. This work demonstrates that the combination of the electrocatalytic activity of MOF and 2D Ti3C2Tx with ultra-high conductivity is a promising method for the development of high-performance electrochemical sensors.Conflicts of interest
There are no conflicts to declare.Acknowledgements
This study was funded by National Natural Science Foundation of China (11805016) and Beijing Nova Program (Z201100006820113).References
- A. H. C. Van Bruggen, M. M. He, K. Shin, V. Mai, K. C. Jeong, M. R. Finckh and J. G. Morris, Sci. Total Environ., 2018, 616–617, 255–268 CrossRef CAS PubMed
.
- D. la Cecilia and F. Maggi, Environ. Pollut., 2018, 233, 201–207 CrossRef CAS PubMed
.
- N. Corrales, M. Meerhoff and D. Antoniades, Environ. Pollut., 2021, 284, 117354 CrossRef CAS PubMed
.
- K. Gandhi, S. Khan, M. Patrikar, A. Markad, N. Kumar, A. Choudhari, P. Sagar and S. Indurkar, Environ. Challenges, 2021, 4, 100149 CrossRef
.
- V. N. Dhamu and S. Prasad, Biosens. Bioelectron., 2020, 170, 112609 CrossRef CAS PubMed
.
- A. Connolly, M. A. Coggins and H. M. Koch, Toxics, 2020, 8, 1–18 CrossRef PubMed
.
- C. Zhang, X. Liang, Y. Lu, H. Li and X. Xu, Sensors, 2020, 20, 4146 CrossRef CAS PubMed
.
- Y. Yao, X. Han, X. Yang, J. Zhao and C. Chai, Chin. J. Chem., 2021, 39, 330–336 CrossRef CAS
.
- L. Wang, Q. Teng, X. Sun, Y. Chen, Y. Wang, H. Wang and Y. Zhang, J. Colloid Interface Sci., 2018, 512, 127–133 CrossRef CAS PubMed
.
- W. Meng, Y. Wen, L. Dai, Z. He and L. Wang, Sens. Actuators, B, 2018, 260, 852–860 CrossRef CAS
.
- M. Zarejousheghani, A. Jaafar, H. Wollmerstaedt, P. Rahimi, H. Borsdorf, S. Zimmermann and Y. Joseph, Sensors, 2021, 21, 1–18 Search PubMed
.
- J. C. Ulrich and P. L. Ferguson, Anal. Bioanal. Chem., 2021, 413, 3763–3774 CrossRef CAS PubMed
.
- A. L. Valle, F. C. C. Mello, R. P. Alves-Balvedi, L. P. Rodrigues and L. R. Goulart, Environ. Chem. Lett., 2019, 17, 291–317 CrossRef CAS
.
- B. B. Prasad, D. Jauhari and M. P. Tiwari, Biosens. Bioelectron., 2014, 59, 81–88 CrossRef CAS PubMed
.
- A. Khenifi, Z. Derriche, C. Forano, V. Prevot, C. Mousty, E. Scavetta, B. Ballarin, L. Guadagnini and D. Tonelli, Anal. Chim. Acta, 2009, 654, 97–102 CrossRef CAS PubMed
.
- T. Rijnaarts, R. Mejia-Ariza, R. J. M. Egberink, W. van Roosmalen and J. Huskens, Chem.–Eur. J., 2015, 21, 10296–10301 CrossRef CAS PubMed
.
- Q. L. Zhu and Q. Xu, Chem. Soc. Rev., 2014, 43, 5468–5512 RSC
.
- R. R. Salunkhe, Y. V. Kaneti, J. Kim, J. H. Kim and Y. Yamauchi, Acc. Chem. Res., 2016, 49, 2796–2806 CrossRef CAS PubMed
.
- Y. Zhao, M. Seredych, J. Jagiello, Q. Zhong and T. J. Bandosz, Chem. Eng. J., 2014, 239, 399–407 CrossRef CAS
.
- X. Zhang, X. Wang, W. Fan and D. Sun, Chin. J. Chem., 2020, 38, 509–524 CrossRef CAS
.
- Y. Z. Chen, R. Zhang, L. Jiao and H. L. Jiang, Coord. Chem. Rev., 2018, 362, 1–23 CrossRef CAS
.
- D. Cheng, X. Xiao, X. Li, C. Wang, Y. Liang, Z. Yu, C. Jin, N. Zhou, M. Chen, Y. Dong, Y. Lin, Z. Xie and C. Zhang, J. Electrochem. Soc., 2018, 165, B885–B892 CrossRef CAS
.
- S. Rani, B. Sharma, R. Malhotra, S. Kumar, R. S. Varma and N. Dilbaghi, Environ. Res., 2020, 191, 110005 CrossRef CAS PubMed
.
- G. Yu, J. Xia, F. Zhang and Z. J. Wang, Electroanal. Chem., 2017, 801, 496–502 CrossRef CAS
.
- Y. Yuan, J. Xia, F. Zhang, Z. Wang and Q. J. Liu, Electroanal. Chem., 2018, 824, 147–152 CrossRef CAS
.
- M. Sohail, M. Altaf, N. Baig, R. Jamil, M. Sher and A. Fazal, New J. Chem., 2018, 42, 12486–12491 RSC
.
- M. Annalakshmi, P. Balasubramanian, S. M. Chen and T. W. Chen, Sens. Actuators, B, 2019, 296, 126620 CrossRef CAS
.
- Y. Song, C. Gong, D. Su, Y. Shen, Y. Song and L. Wang, Anal. Methods, 2016, 8, 2290–2296 RSC
.
- S. Wu, Z. Song, M. Zhu, Y. Zhang, W. Yao, M. Kosinova, V. P. Fedin, J. Chen and E. Gao, Appl. Organomet. Chem., 2021, 35, 1–11 Search PubMed
.
- C. Li and K. Wu, Anal. Chim. Acta, 2021, 1162, 338473 CrossRef CAS PubMed
.
- S. S. Y. Chui, S. M. F. Lo, J. P. Charmant, A. G. Orpen and I. D. Williams, Science, 1999, 283, 1148–1150 CrossRef CAS PubMed
.
- X. Zhang, J. Luo, P. Tang, J. R. Morante, J. Arbiol, C. Xu, Q. Li and J. Fransaer, Sens. Actuators, B, 2018, 254, 272–281 CrossRef CAS
.
- L. Ji, Q. Cheng, K. Wu and X. Yang, Sens. Actuators, B, 2016, 231, 12–17 CrossRef CAS
.
- Y. Cao, L. Wang, C. Shen, C. Wang, X. Hu and G. Wang, Sens. Actuators, B, 2019, 283, 487–494 CrossRef CAS
.
- Y. Wang, C. Hou, Y. Zhang, F. He, M. Liu and X. Li, J. Mater. Chem. B, 2016, 4, 3695–3702 RSC
.
- E. Zhou, Y. Zhang, Y. Li and X. He, Electroanalysis, 2014, 26, 2526–2533 CrossRef CAS
.
- H. Liu, C. Duan, C. Yang, W. Shen, F. Wang and Z. Zhu, Sens. Actuators, B, 2015, 218, 60–66 CrossRef CAS
.
- Z. Xue, L. Jia, R. R. Zhu, L. Du and Q. H. J. Zhao, Electroanal. Chem., 2020, 858, 113783 CrossRef CAS
.
- R. B. Rakhi, P. Nayuk, C. Xia and H. N. Alshareef, Sci. Rep., 2016, 6, 1–10 CrossRef PubMed
.
- R. A. Soomro, S. Jawaid, Q. Zhu, Z. Abbas and B. Xu, Chin. Chem. Lett., 2020, 31, 922–930 CrossRef CAS
.
- M. Naguib, M. Kurtoglu, V. Presser, J. Lu, J. Niu, M. Heon, L. Hultman, Y. Gogotsi and M. W. Barsoum, Adv. Mater., 2011, 23, 4248–4253 CrossRef CAS PubMed
.
- X. Zhou, Y. Guo, D. Wang and Q. Xu, Nano friction and adhesion properties on Ti3C2 and Nb2C MXene studied by AFM, Tribol. Int., 2021, 53, 106646 CrossRef
.
- Y. J. Mai, Y. G. Li, S. L. Li, L. Y. Zhang, C. S. Liu and X. H. Jie, J. Alloys Compd., 2019, 770, 1–5 CrossRef CAS
.
- H. Shu, Y. Liu and Y. Jia, Synthesis of Cu-BTC by room temperature hydrothermal and its low temperature SCR denitration, J. Mol. Struct., 2022, 1251, 132046 CrossRef
.
- N. Torres, J. Galicia, Y. Plasencia, A. Cano, F. Echevarría, L. F. Desdin-Garcia and E. Reguera, Implications of structural differences between Cu-BTC and Fe-BTC on their hydrogen storage capacity, Colloids Surf., A, 2018, 549, 138–146 CrossRef CAS
.
- X. Wei, X. Gao, L. Zhao, X. Peng, L. Zhou, J. Wang and Q. Pu, J. Chromatogr. A, 2013, 1281, 148–154 CrossRef CAS PubMed
.
- Y. Zhang, Y. Zhang, Q. Qu, G. Wang and C. Wang, Anal. Methods, 2013, 5, 6465–6472 RSC
.
- Y. Li, S. Zhang, Q. Zhang, G. Xu, H. Dai and Y. Lin, Sens. Actuators, B, 2016, 224, 798–804 CrossRef CAS
.
- Y. Cao, L. Wang, C. Wang, X. Hu, Y. Liu and G. Wang, Electrochim. Acta, 2019, 317, 341–347 CrossRef CAS
.
- J. Zha, Z. Yuan, Z. Zhou, Y. Li, J. Zhao, Z. Zeng, L. Zhen, H. Tai, C. Tan and H. Zhang, Small Struct., 2021, 2100067 CrossRef
.
| This journal is © The Royal Society of Chemistry 2022 |

