DOI:
10.1039/D1RA08004K
(Paper)
RSC Adv., 2022,
12, 1265-1277
Robust direct Z-scheme exciton transfer dynamics by architecting 3D BiOI MF-supported non-stoichiometric Cu0.75In0.25S NC nanocomposite for co-catalyst-free photocatalytic hydrogen evolution†
Received
1st November 2021
, Accepted 16th December 2021
First published on 5th January 2022
Abstract
Designing promising photocatalytic systems with wide photon absorption and better exciton separation ability is a cutting-edge technology for enhanced solar-light-driven hydrogen production. In this context, non-stoichiometric Cu0.75In0.25S nanocrystals (CIS NCs) coupled with three-dimensional (3D) BiOI micro-flowers (BOI MFs) were synthesized through an ultra-sonication strategy forming a CIS–BOI heterojunction, which was well supported by XRD, photocurrent, XPS and Mott–Schottky analyses. Further, the co-catalyst-free CIS–BOI binary hybrid shows improved hydrogen evolution, i.e., 588.72 μmol h−1, which is 3.2 times greater than the pristine CIS NC (183.97 μmol h−1). Additionally, the binary composite confers an apparent conversion efficiency (ACE) of 9.44% (8.90 × 10¹⁶ number of H2 molecule per sec), which is extensively attributed to the robust charge carrier separation and transfer efficiency via the direct Z-scheme mechanism (proved through superoxide and H2 evolution activity). Moreover, the broad photon absorption range and productive exciton separation over the CIS–BOI composite are substantially justified by UV-Vis DRS, PL, EIS and photocurrent measurements.
1. Introduction
Recently, semiconductor photo-catalysis has come forward as a promising, cost-effective and imperishable technology to endow resolution towards global issues such as the energy crisis and environmental pollution. From this perspective, green fuel hydrogen production via solar-light illuminated water-splitting is considered an imperative area of research because of its potential applications in renewable energy generation and environmental clean-up.1,2 As hydrogen has good specific enthalpy and a benign combustion product, i.e. water, it is proposed as a promising energy source for dropping the vulnerability of fossil fuels and the consequent release of greenhouse gases.3 The inception of semiconductor-based photocatalytic systems towards H2 evolution has gathered tremendous attention as a green technology to address the growing need for clean energy. In this context, numerous photocatalytic systems have been designed and experimented with for sustainable H2 evolution reactions, but the wide optical bandgap, fast exciton recombination rate, slow charge diffusion from the bulk to the surface, photo-corrosion, etc. lower the overall efficiency and resist the process of industrialization. Further, it is hard to find a single material with wide photon absorption ability, good charge-carrier separation efficiency, large active surface area and exceptional photostability. Hence, to overcome these associated limitations, widespread research works are being conducted for the development of efficient photocatalytic systems with a type-II heterostructural band alignment at the interfacial region. However, the double charge transfer route (photogenerated excitons travel in a cyclic path) is not quite effective for many photocatalytic reactions as photoinduced charge carriers exist at lower reduction and oxidation potential reaction sites.4–6 Hence, the direct Z-scheme heterostructure introduced by Yu et al. in 2013 accomplished efficient photocatalytic activity with superior solar-light absorption and better electron–hole (e−–h+) separation in the absence of an electron mediator.7 Unequivocally, in the Z-scheme system, the band structure alignment is analogous to the type-II system but in a different charge transfer route. In this mechanism, the energies of the donor and acceptor bands are closer to each other, where the photo-excited e− moves from the e−-enriched CB (conduction band) of one semiconductor to the h+-enriched VB (valence band) of the other semiconductor resulting in electrostatic attraction between the combing units.8 Additionally, the Z-scheme photocatalyst displays robust photoredox capability due to the following features: (i) availability of useful photoinduced charge carriers with high redox potential; (ii) reductive and oxidative centers are separated; (iii) two semiconductors are used without any mediator; and (iv) increased photon absorption range.9,10 Additionally, our group has made tremendous advancements and has reported several Z-scheme oriented systems like BiVO4/CdS/MgAl-LDH, {040/110}-BiVO4@Ag@CoAl-LDH, BiOI–CeO2, MoS2/NiFe-LDH, NiFe-LDH/N-rGO/g-C3N4, Cu–MoO3/g-C3N4, BN/BCN, HPW@UiO-66, WO3−x/Ag/ZnCr-LDH and TiO2/BCN towards energy production and pollutant detoxification.5,6,10–14
In the past decades, bismuth oxyhalides classified as V–VI–VII group ternary oxides with tetragonal matlockite geometry have gathered huge attention as semiconductor photocatalysts due to their non-toxic nature, favorable economy, easy fabrication, excellent conductivity and broad light absorption properties. Structurally, BiOX (X = F, Cl, Br, I) compounds contain a fluorite type metal oxide layer placed in-between two halogen layers forming the X–O–Bi–O–X layered framework, which facilitates effective separation of photogenerated charge carriers.7,15–18
Moreover, it has been observed that extremely anisotropic optical, mechanical and electrical properties of bismuth oxyhalides are due to the presence of weak interlayer van der Waal's force and strong intralayer linkage that makes them a strong candidate for photocatalytic applications. Among all, BiOI (BOI) a p-type material was given special interest due to its fine band gap energy (1.8–1.9 eV), directed towards well-organized visible-light-driven photocatalysis.5,19,20 Recently, 3D BOI micro-flower (MF) photocatalysts have generated a lot of interest in research due to the flower-like morphology, which provides more surface area and results in more active sites, which enhance the overall photocatalytic activity.21,22 Further, surface oxygen vacancy (SOV) of 3D BOI MF contributes a number of surface active sites as well as the interfacial electron transfer; thereby decreasing the recombination of charge carriers, which plays a significant role in the photocatalytic process. Nevertheless, its photocatalytic ability is still unsatisfactory because of some tailbacks such as faster e−–h+ recombination, instability under a highly reducing environment, and photocorrosion. This insufficiency has been solved to a great extent by forming a heterostructure with other semiconductors (TiO2, Bi2O3, ZnO, SiO2, PbTiO3, ZnTiO3, BiOCl, CdS QD etc.).23–29 Among those promising materials, copper indium sulphide (CIS) is a non-toxic ternary material belonging to I–III–VII and has a suitable band gap energy (Eg) to absorb visible-light has generated more efforts for forming a heterojunction with BOI MF.30 The non-stoichiometric CIS provides a reduction of the lattice mismatch and defect states at interfaces. This is related to the associated h+ traps with a structural disorder that minimizes the charge recombination process that is ultimately beneficial to improving the H2 production rate.31
Here, in this work, we have synthesized pristine BOI MF using a simple precipitation method, pristine CIS NC by a reflux method and CIS–BOI composite material by ex situ mixing of two pristine materials via ultra-sonication strategy. Furthermore, the role of capping agent (TGA) has a great influence in the synthesis of non-stoichiometric ternary CIS NC as surface ligands enhancing the chemical stability of the ternary NC by preventing agglomeration during the formation of binary NCs.32 Crystallography, morphological, optical and electrical properties of the prepared, neat and binary composites are well characterized. Further, the catalytic performance of the designed photocatalysts was tested toward the water reduction reaction under ambient conditions. Hence, the fabricated CIS–BOI heterojunction provides more surface-active sites, superior interfacial electron transfer, lower e−–h+ recombination, excellent stability, etc. that ultimately leads to significant improvements in the hydrogen production rate.
2. Ex situ preparation of CIS–BOI composite
To prepare the CIS–BOI heterojunction, equal amounts of previously-prepared BOI MF and CIS NC (mentioned in the ESI†), were dispersed independently into two beakers with a 1![[thin space (1/6-em)]](https://www.rsc.org/images/entities/char_2009.gif) :
:![[thin space (1/6-em)]](https://www.rsc.org/images/entities/char_2009.gif) 1 ethanol–water solution. Then, the solutions were treated under ultra-sonication for a period of 30 min. After a while, both solutions were mixed and sonicated again for 4 h. Then, the solution was heated to 70 °C with a constant stirring of 12 h to evaporate ethanol. Additionally, it was dried under vacuum to obtain the CIS–BOI composite material. The overall synthetic method is represented schematically in Scheme 1.
1 ethanol–water solution. Then, the solutions were treated under ultra-sonication for a period of 30 min. After a while, both solutions were mixed and sonicated again for 4 h. Then, the solution was heated to 70 °C with a constant stirring of 12 h to evaporate ethanol. Additionally, it was dried under vacuum to obtain the CIS–BOI composite material. The overall synthetic method is represented schematically in Scheme 1.
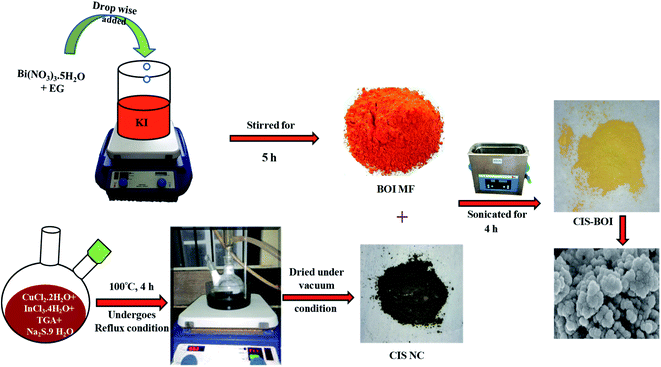 |
| | Scheme 1 Overall synthesis procedure of BOI MF, CIS NC and the CIS–BOI composite. | |
3. Results and discussion
3.1 Structural characterization
3.1.1 XRD. Powder X-ray diffraction (PXRD) analysis was performed to gather information related to crystal geometry, phase purity and crystallinity of the as-prepared samples, i.e., BiOI MF, Cu0.75In0.25S NCs and Cu0.75In0.25S-BiOI composite, as shown in Fig. 1. The obtained XRD pattern of the pristine BOI indicates that the material is in the tetragonal phase where the prominent peaks are observed at 2θ = 29.6°, 31.6°, 37.0°, 39.3°, 45.3°, 51.6°, and 55.1° corresponding to (1 0 2), (1 1 0), (1 0 3), (0 0 4), (2 0 0), (1 1 4), and (2 1 2) hkl planes, respectively, (ICDD card no. 00-010-0445), and without any additional impurity peaks, suggesting its good phase purity. Further, the observed intense and sharp XRD peaks for BOI implied better crystallinity of the material. Additionally, neat CIS NC showed well-distinguished XRD diffractogram at Bragg angles: 28.1°, 29.4°, 32.6°, 48.3°, 55.2° and 59.9° indexed to (3 1 1), (1 1 2), (2 0 0), (4 4 0), (3 1 2) and (4 4 4) crystal planes, respectively, and in agreement with both cubic (ICDD card no. 24-0361) and tetragonal (ICDD card no. 15-0681) mixed phases. Moreover, diffraction patterns of the CIS–BOI composite contain both the combining entity (BOI MF and CIS NC) characteristic peaks, however, all BOI peaks are clearly visible but only a few of the CIS peaks are only observed (as shown * mark and dotted frame), which is because many of the low intense CIS peaks get merged with high intense BOI due to nearly equal 2θ values. Interestingly, XRD peaks of BOI in the composite do not undergo any change in position, which suggests that there is no disturbance of the BOI crystal phase and crystallinity during the loading of Cu0.75In0.25S NC. Furthermore, high crystallinity facilitates faster diffusion of charge carriers from the bulk to surface for better activity. The above observation strongly supports the formation of a binary composite between CIS and BOI.
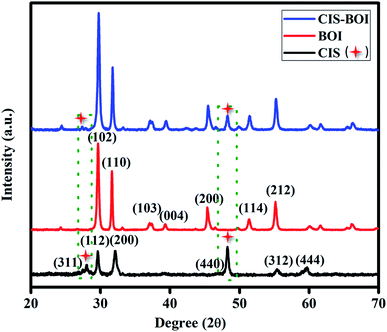 |
| | Fig. 1 XRD patterns of pristine CIS MF, BOI NC and the CIS–BOI composite. | |
3.1.2 XPS. The chemical composition, electronic environment and surface oxidation of CIS–BOI NCs were further examined using high-resolution X-ray photoelectron spectroscopy (XPS), as shown from the data in Fig. 2. The obtained XPS data were plotted and then deconvoluted using the CASA XPS software to gather knowledge about the chemical bonding between atoms in the composite. Further, survey spectra of the composite (CIS–BOI) are shown in ESI (Fig. S1),† confirming the presence of all constituting elements (Cd, In, Bi, O, I and S) without any impurities, which is also supported by EDX analysis. In Fig. 2(a), two peaks are visualized at binding energy (BE) values of 159.0 and 164.4 eV corresponding to Bi 4f5/2 and Bi 4f7/2 spin states, respectively, and indicate the trivalent chemical state of Bi3+ in the composite.28 Additionally, Fig. 2(b) represents the deconvoluted O 1s spectra, wherein three bands were observed at 529.8, 531.3 and 532.7 eV contributing towards lattice oxygen (OL), vacancy oxygen (OV), and absorbed oxygen (OA) respectively.33,34 The high-resolution XPS spectra of I 3d, indicate two characteristic peaks at 618.8 eV (I 3d5/2) and 630.3 eV (I 3d3/2) shown in Fig. 2(c), suggesting the existence of iodide (I−) state in the binary hybrid.35 Furthermore, the BE for Cu 2p3/2 and Cu 2p1/2 spin levels are located at 931.9 and 951.8 eV, respectively, confirming the presence of Cu+ in the CIS unit of the composite and no additional peak for Cu2+ was observed in the Cu 2p spectrum (Fig. 2(d)).36 In addition, Fig. 2(e) shows XPS peaks for In 3d located at 444.9 and 452.5 eV, attributed to 3d5/2 and 3d3/2 states, respectively.37 Similarly, sulphur element shows a doublet XPS peak representing S 2p1/2 and S 2p3/2 at binding energies of 157.9 and 163.2 eV, respectively, due to the spin–orbit coupling, which confirmed the coordination of S to In and Cu in CIS NCs as shown in Fig. 2(f).30 In addition, the compositional variation of Cu and In can be confirmed by XPS analysis and the atomic weight ratio of Cu![[thin space (1/6-em)]](https://www.rsc.org/images/entities/char_2009.gif) :
:![[thin space (1/6-em)]](https://www.rsc.org/images/entities/char_2009.gif) In was found to be 0.74
In was found to be 0.74![[thin space (1/6-em)]](https://www.rsc.org/images/entities/char_2009.gif) :
:![[thin space (1/6-em)]](https://www.rsc.org/images/entities/char_2009.gif) 0.26, which is reliable with the molar ratio of precursors taken at the time of the synthesis of CIS NC. Hence, it is obvious from the data that the reactivity of Cu and In was finely proscribed at the time of synthesis and non-stoichiometric CIS resulted as estimated.
0.26, which is reliable with the molar ratio of precursors taken at the time of the synthesis of CIS NC. Hence, it is obvious from the data that the reactivity of Cu and In was finely proscribed at the time of synthesis and non-stoichiometric CIS resulted as estimated.
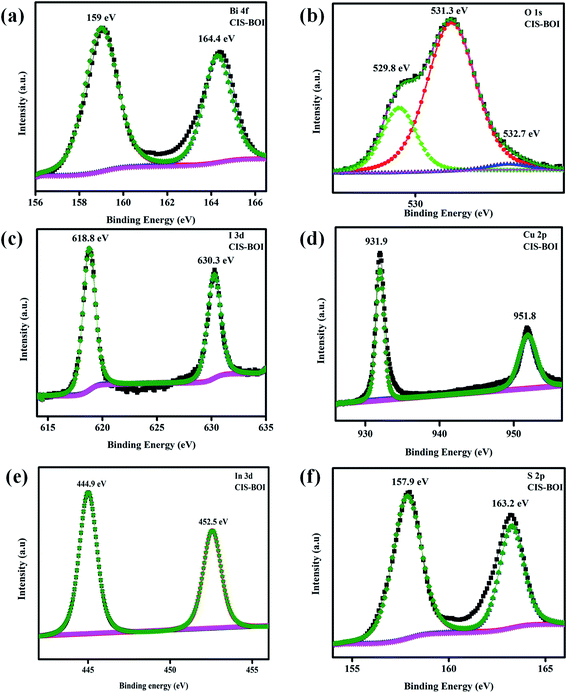 |
| | Fig. 2 XPS spectra of the elements present in the CIS–BOI composite: (a) Bi 4f, (b) O 1s, (c) I 3d, (d) Cu 2p, (e) In 3d, and (f) S 2p. | |
3.1.3 FESEM (Field Emission Scanning Electron Microscopy). FESEM analysis was conducted to study the morphology of the synthesized material as shown in Fig. 3. It can be noticed from Fig. 3(a) that, pristine BOI exhibits a beautiful flower-like geometry while pristine CIS shows a particle-like morphology (Fig. 3(b)). It is clear from the FESEM image that the BOI micro-flower (MF) structure is formed by the settlement of a number of nanosheet-like petals in an arbitrary order making more surface-active sites for the photocatalytic reaction. Similarly, Fig. 3(c) represents the arrangement of BOI MF and CIS NCs in a random manner in the CIS–BOI composite. The FESEM image of the binary composite material from a different angle is shown in ESI (Fig. S2).† Moreover, Fig. 3(d) and (e) represent the energy dispersive X-ray (EDX) patterns of the pristine BOI MF and CIS–BOI composite, respectively, confirming the presence of elements Bi, O and I in BiOI and Bi, O, I, Cu, In and S in the composite with no other impurities, indicating the successful formation of binary hybrid CIS–BOI (good correlation with XPS data).
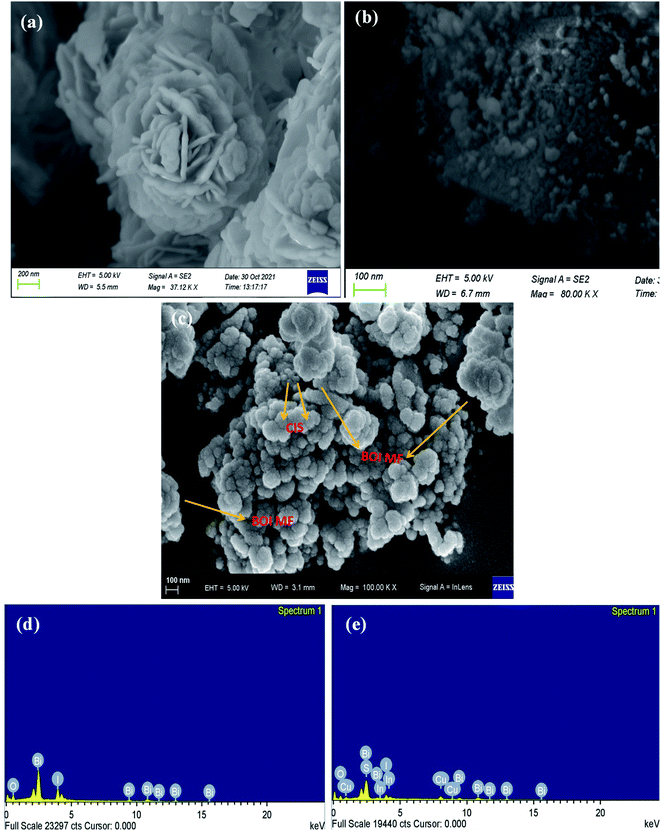 |
| | Fig. 3 FESEM images of (a) pristine BOI MF, (b) pristine CIS NC, and (c) the CIS–BOI composite. EDX spectra of (d) pristine BOI and (e) the CIS–BOI composite. | |
3.2 Optical properties
3.2.1 UV-visible spectroscopy. UV-visible diffuse reflectance spectra (UV-DRS) of the pristine BiOI MFs and CIS NCs along with BiOI-CIS composite showing the absorbance in visible to near IR regions are shown in Fig. 4(a). In the figure, BiOI MF shows a broad photon absorption range extending up to 680 nm due to the presence of oxygen vacancy, which intrinsically enhances the optical behavior of the material.29 However, with the addition of CIS to BiOI, its absorption window further broadens and is extended up to the IR region, as shown in the figure, which indicates that the composite exhibits a red shift and covers most of the area of the spectra as compared to the pristine BiOI MF. This anomalous behavior is due to the wide photon capturing ability of the CIS unit. It is seen that the composite can utilize the complete visible region along with a small fraction of the IR spectrum resulting in improved optical properties of the composite material and hence showing a higher catalytic activity. Furthermore, the bandgap energy of the as-prepared samples was evaluated by the interpretation of the Tauc plot of the materials from the Kubelka–Munk equation (eqn (1)):where h = Planck's constant = 6.626 × 10⁻³⁴ J s, a = absorption coefficient, v = frequency of the light, Eg = bandgap energy of the material and A = proportionality constant. Further, the value of n decides the type of electronic transition, i.e., n = 2 means direct and n = 1/2 implies indirect transition.38
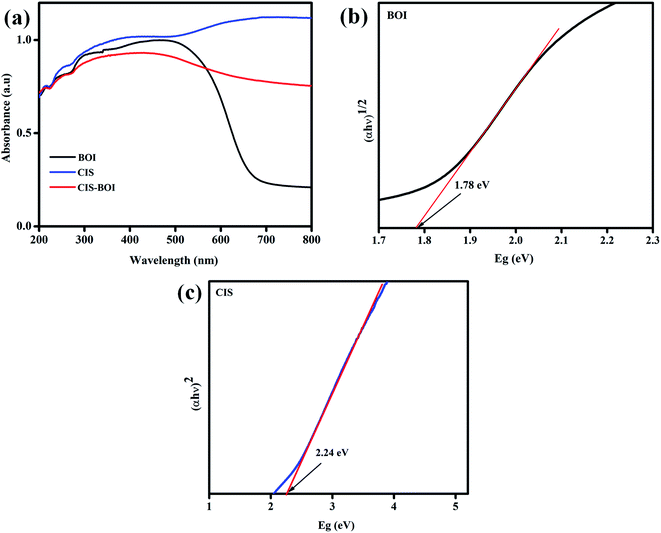 |
| | Fig. 4 (a) Absorbance spectra of CIS MF, BOI NC and the CIS–BOI composite, and the Tauc plots of (b) BOI and (c) CIS. | |
Moreover, the Eg values of BiOI MF and CIS NC were found to be 1.78 and 2.24 eV and suffer indirect and direct transition, respectively (Fig. 4(b) and (c)).29,39 Furthermore, it would be better to have a greater Eg value for the composite material as compared to the neat materials as that will be beneficial for the effective photocatalytic reaction by enhancing the redox potential toward H2 generation.40
3.2.2 Photoluminescence (PL) spectroscopy. Photoluminescence properties were measured using a PL spectrofluorometer providing handy information about the recombination pace of photo-generated charge carriers, optical emission and interfacial carrier transfer efficiency of semiconductor materials. Further, the intensity of the PL peak is directly related to the rate of electron–hole recombination, i.e., intense peak means faster recombination and broad or low intense peaks indicate a better charge separation. In this work, we have observed PL spectra of pristine materials as well as the binary composite at an excitation wavelength of 390 nm as represented in Fig. 5. It is seen that the PL emission spectra of the pristine BOI MF and CIS NCs show higher PL emission intensity than that of the composite CIS–BOI material. Based on the observed PL peak intensity, the sequential ordering of the charge carrier recombination rate follows the order BOI > CIS > CIS–BOI. Moreover, the lowest emission intensity of the CIS–BOI composite material indicates an effective transfer and separation of the photoexcited electron–hole pairs via the Z-scheme charge migration dynamic, which corresponds to the significant upliftment of the photocatalytic activity of the composite photocatalyst and confirms a proper alignment of BOI and CIS NC energy bands in the composite.
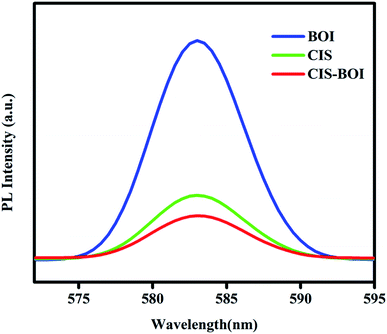 |
| | Fig. 5 PL spectra of BOI MF, CIS NC and the CIS–BOI composite. | |
3.3 Photoelectrochemical (PEC) study
3.3.1 Mott–Schottky (MS) analysis. The MS analysis was performed using 0.1 M Na2SO4 solutions containing the materials at different frequencies (500, 1000 and 1500 Hz) with a constant AC potential under dark conditions. MS measurements are generally carried out to know the nature of semiconducting material (p(−ve slope) or n-type(+ve slope)) and charge carrier density. From Fig. 6(a) and (b), it was observed that CIS shows a positive slope confirming the n-type character of the material, whereas BOI showed a negative slope, authenticating its p-type nature. Following our previously reported literature and from the obtained MS plot, flat band potential (Efb) of BOI MF and CIS NC were found to be 2.03 V and −1.10 V vs. Ag/AgCl as shown in Fig. 6(a) and (b) respectively. Further, using the normal hydrogen electrode, the flat band potentials can be calculated by using eqn (2),| | |
ENHE = EAg/AgCl(at pH = 6.8) − 0.059(7 − pH of the electrolyte) + E°Ag/AgCl
| (2) |
where the pH value of the used Na2SO4 electrolyte was 6.8 and the standard electrode potential value of Ag/AgCl (E0Ag/AgCl) was 0.198 at 25 °C. Hence, the Efb of BOI and CIS was found to be 2.21 eV and −0.913 eV in the NHE scale, respectively. Further, it is noted from the reported literature that, Efb vs. NHE is approximately 0.1–0.3 eV above the valence band maxima and below the conduction band minima for the p-type and n-type semiconductors, respectively.41,42 Therefore, by varying 0.1 eV, the conduction band (CB) of CIS and valence band (VB) of BOI were found to be −1.01 eV and 2.31 eV, respectively, vs. NHE. Afterward, CB of BOI and VB of CIS vs. NHE were calculated to be 0.53 eV and 1.23 eV, respectively, by using eqn (3):| | |
Eg (optical bandgap) = VB − CB
| (3) |
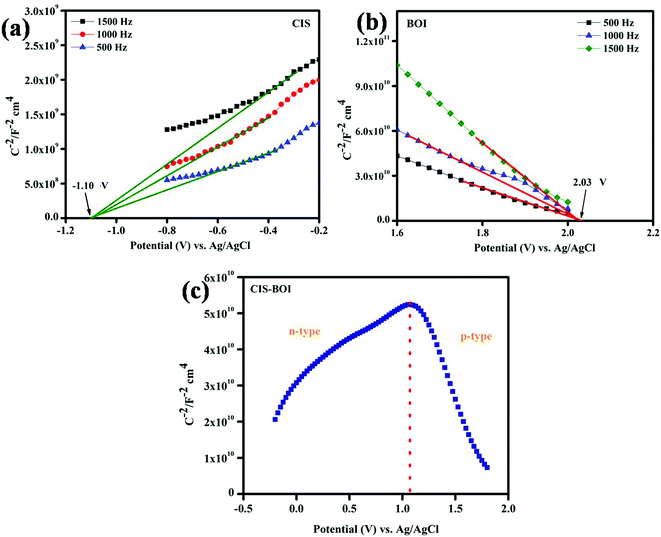 |
| | Fig. 6 MS plot of (a) CIS NC, (b) BOI MF, and (c) the CIS–BOI composite. | |
Furthermore, from the literature, it is notable that the standard reduction potential of H2O is −0.41 eV (E0H2O/H2 = −0.41 eV) at pH 7.43 The MS plot of the composite material with a V-shaped curve clearly revealed the formation of the p–n heterojunction structure by mixing p-BOI and n-CIS pristine materials as represented in Fig. 6(c). Additionally, the more negative CB value (−1.01 eV) of CIS makes it a suitable catalyst for the photocatalytic hydrogen reaction. However, BOI is not capable of reducing H2O as CB is positioned at the positive potential. Moreover, the composite showed H2 production, which confirmed that the reduction process occurred over the CIS unit of the CIS–BOI hybrid. Further, the enhanced hydrogen evolution activity is because of the successful charge separation promoted by the incorporated electric field generated at the p-BOI and n-CIS region.
3.3.2 Electrochemical Impedance Spectroscopy (EIS). EIS is a helpful tool to find the charge transfer-resistance, separation and transportation ability, i.e., resistance, and the conductance of the semiconductor material about the electrode–electrolyte interface.44 The fitted EIS data of the prepared samples are depicted in Fig. 7(a), and the equivalent circuit of the fitted Nyquist plot is given in the inset, where Rs, Rct, C and Ws represent electrolyte resistance, contact resistance, electron transfer resistance and double-layer capacitance, respectively.29 Moreover, the higher frequency region with a semicircle geometry describes Rct and C parameters, whereas the lower frequency straight loop region tending at a definite angle contributes towards Ws r.45 Greater the semicircle radius more will be its interface resistance leading to a decrease in conductance and vice versa. Furthermore, the smaller semicircle radius indicates a higher charge separation efficiency directing towards enhanced photocatalytic efficiency. Further, EIS plots of the as-prepared samples are shown in Fig. 7(a), which show that the composite material has the lowest semicircle arc followed by the pristine CIS and BOI catalyst. The above observation indicates a better charge carrier separation in the binary hybrid compared to the neat material and is well supported by PL analysis. This clearly indicates a higher charge transfer ability of the composite system by reducing the ion diffusion pathway. As the radius of the semicircle of the Nyquist plot is inversely proportional to the charge transfer rate in the photocatalytic hydrogen generation reaction, the CIS–BOI composite shows the highest photocatalytic activity compared to the pristine BOI MF and CIS NC. Further, the image in Fig. 7(b) displays the zoomed picture within the low scanning window.
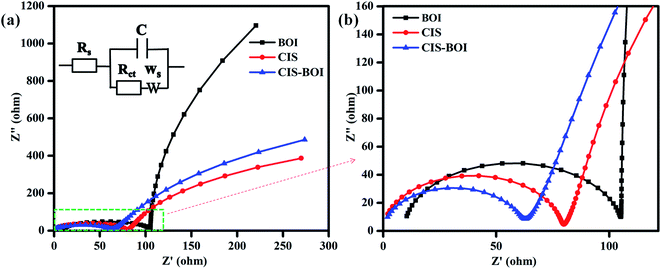 |
| | Fig. 7 Nyquist plots of (a) BOI MF, CIS NC and the CIS–BOI composite, and (b) a zoom-in image of the EIS plot. | |
3.3.3 Linear Sweep Voltammetry (LSV). The photocatalytic activity of materials can be further appraised by linear swift voltammetry (LSV), which shows the nature of the current or concentration of photogenerated electrons present in the material. It is notorious that, photocurrent response is directly proportional to the activity towards photocatalytic hydrogen evolution, i.e., the higher the photocurrent, the more will be its photocatalytic activity. The photocurrent analysis of the as-prepared samples under light conditions is shown in Fig. 8. Moreover, it can be seen from the I vs. V plot that, pure BOI gives a cathodic current of −0.64 mA cm−2 validating its p-type nature and pure CIS generates an anodic current of 0.24 mA cm−2, confirming its n-type nature as shown in the Fig. 8(a) and (b), respectively. Again, it was observed that the CIS–BOI composite shows both p- and n-type behavior within the scanning window with a cathodic photocurrent of −2.39 mA cm−2 and anodic photocurrent of 2.41 mA cm−2, which are much greater than both the pristine BOI and CIS materials under light illumination as represented in Fig. 8(c). Therefore, the photocatalytic activity of the composite CIS–BOI is much greater than the pure BOI and CIS samples, resulting in a higher H2 evolution rate.
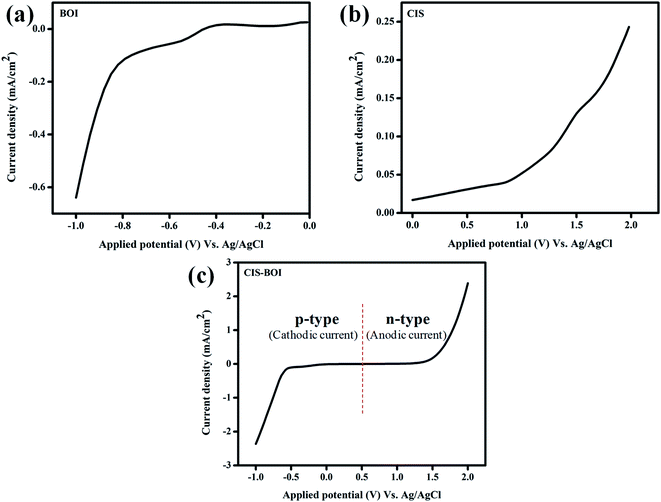 |
| | Fig. 8 Potential–current density curves of (a) BOI MF, (b) CIS NC, and (c) the CIS–BOI composite. | |
3.4 Chronoamperometry Analysis (CA)
The CA study was carried out on the as-prepared materials to know their photostability under constant light irradiation. From the obtained data, it is clear that all the synthesized materials are stable under light for a period of 900 s as illustrated in Fig. 9. Interestingly, the composite material manifests the highest current density of 188.4 μA cm−2 (Fig. 9(c)), which is much higher than that of neat BOI (0.289 μA cm−2), as shown in (Fig. 9(a)) and CIS (18.925 μA cm−2) (Fig. 9(b)) at a constant supplied voltage of 0.2 V. Apart from this, it was observed that in the case of pure CIS and BOI, the current density gradually decreases with an increase in time, however, for the CIS–BOI composite, the current density increases for a few seconds and then comes to a constant value with increase in time, which gives a solid probe of its photostability.
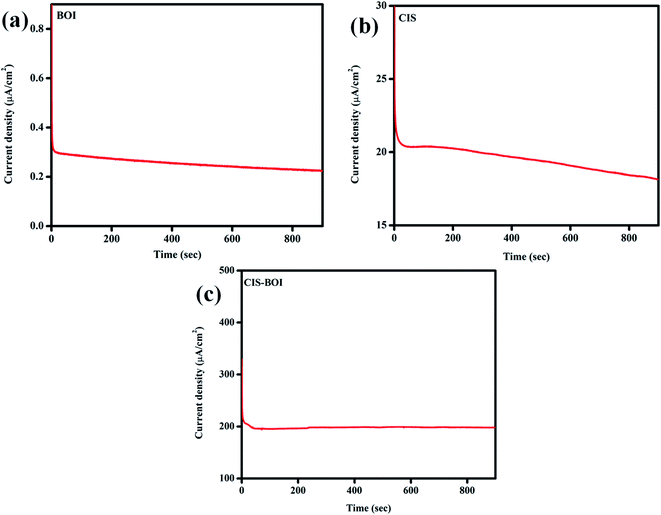 |
| | Fig. 9 CA curves of (a) BOI MF, (b) CIS NC and (c) the CIS–BOI composite. | |
3.5 Photocatalytic hydrogen evolution
The photocatalytic hydrogen generation ability of the prepared catalysts (pristine BOI, CIS and CIS–BOI composite) was carried out under a 125 W artificial visible light source in an aqueous methanol solution, where methanol was used as a hole scavenger. In a blank experiment, i.e., in the absence of the catalyst and light no hydrogen gas was produced, which pointed towards a photocatalytic approach. It should be noted that no hydrogen generation was observed for pure BOI when visible light was used for illumination, as the conduction band potential (0.53 eV vs. NHE) is not suitable for the photocatalytic water reduction reaction. However, the neat CIS catalyst shows a hydrogen production rate of 183.97 μmol h−1 (ACE = 2.95%) lower than that of the CIS–BOI composite, which is attributed to faster charge recombination, lower carrier diffusion and transfer efficiency, as confirmed from PL, photocurrent and EIS analysis. In contrast, the hydrogen evolution rate for the CIS–BOI composite is 588.72 μmol h−1 (ACE = 9.44%), which is 3.2 times greater than the pristine CIS photocatalyst as shown in Fig. 10(a). The number of hydrogen molecules produced for CIS–BOI (8.90 × 10¹⁶ per sec) is much greater than that for the pristine CIS NC (2.82 × 10¹⁶ per sec), calculated theoretically under standard conditions and the details of the calculation are given in the ESI.† In addition to that, flower-like BOI provides a greater surface area for the uniform distribution of CIS moieties, which increases the number of catalytic active sites and hence promotes the rate of photocatalytic reaction. Further, to check the durability of the hybrid towards H2 generation, a reusability test was performed under the same reaction conditions and it was found that there was no remarkable change in the activity even after three consecutive reaction cycles, signifying the stability of the CIS–BOI photocatalyst (Fig. 10(b)). Furthermore, the XRD pattern of CIS–BOI composite after the photocatalytic reaction was exactly the same as before the reaction, except for the change in intensity of peaks as shown in ESI (Fig. S3).† Hence, it is clear that the CIS–BOI photocatalyst is a stable material and the interaction of atoms and molecules remains unchanged after the use of the material. In addition, a comparison study was made as shown in Table 1, which proves that the CIS–BOI composite is a better photocatalyst among other BOI-based materials towards photocatalytic hydrogen generation.
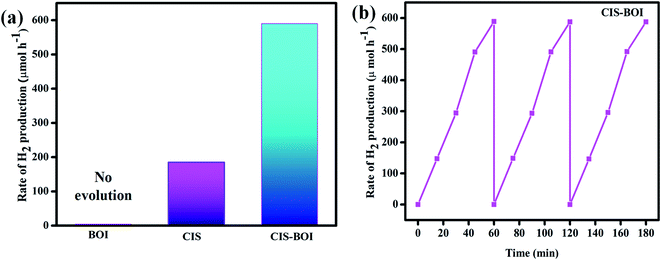 |
| | Fig. 10 (a) Rate of hydrogen production of BOI MF, CIS NC, and the CIS–BOI composite, and (b) the reusability test of the CIS–BOI composite for H2 production. | |
Table 1 Comparison study of different bismuth oxyiodide-based photocatalytic systems towards the H2 evolution reaction
| Sl. No |
BiOI-based photocatalysts |
Light source/scavenger |
Hydrogen evolution (μmol g−1 h−1) |
Reference |
| 1 |
CdS QDs/BiOI |
125 W Hg-lamp (λ > 420 nm), methanol (10 volume%) |
203 |
29 |
| 2 |
ZnO@Bi4O5I2/ZnS |
300 W Xenon lamp (λ > 420 nm), 1![[thin space (1/6-em)]](https://www.rsc.org/images/entities/char_2009.gif) : :![[thin space (1/6-em)]](https://www.rsc.org/images/entities/char_2009.gif) 4 water 4 water![[thin space (1/6-em)]](https://www.rsc.org/images/entities/char_2009.gif) : :![[thin space (1/6-em)]](https://www.rsc.org/images/entities/char_2009.gif) methanol solution methanol solution |
578.4 |
46 |
| 3 |
Bi4O5I2/ZnS |
300 W Xenon lamp (λ > 420 nm), 1![[thin space (1/6-em)]](https://www.rsc.org/images/entities/char_2009.gif) : :![[thin space (1/6-em)]](https://www.rsc.org/images/entities/char_2009.gif) 4 water 4 water![[thin space (1/6-em)]](https://www.rsc.org/images/entities/char_2009.gif) : :![[thin space (1/6-em)]](https://www.rsc.org/images/entities/char_2009.gif) methanol solution methanol solution |
194.6 |
46 |
| 4 |
ZnO@Bi4O5I2 |
300 W Xenon lamp (λ > 420 nm), 1![[thin space (1/6-em)]](https://www.rsc.org/images/entities/char_2009.gif) : :![[thin space (1/6-em)]](https://www.rsc.org/images/entities/char_2009.gif) 4 water 4 water![[thin space (1/6-em)]](https://www.rsc.org/images/entities/char_2009.gif) : :![[thin space (1/6-em)]](https://www.rsc.org/images/entities/char_2009.gif) methanol solution methanol solution |
351.4 |
46 |
| 5 |
Bi7O9I3/B4C |
500 W Xe (λ = 420 nm), triethanolamine (TEOA), anoxic medium |
944.3 |
47 |
| 6 |
gC3N4/Bi4Ti3O12/Bi4O5I2 |
500 W Xe lamp (λ = 420 nm), triethanolamine (TEOA) |
24.12 × 10³ |
48 |
| 7 |
BiOI@NU-1000 |
100 W LED lamp (λ = 400–800 nm), (0.1 M Na2S + 0.1 M Na2SO3) |
610 |
49 |
| 8 |
CIS–BOI |
125 W Xe-lamp (λ > 420 nm), methanol (10 volume%) |
29.436 × 10³ |
This work |
3.6 Possible mechanism for photocatalytic hydrogen evolution
From the above experimental data, the enhanced photocatalytic efficiency of the CIS–BOI binary hybrid may be derived from the synergistic effect of CIS and BOI by the creation of a heterojunction on their interface and the effective charge carrier separation via the Z-scheme pathway.50 In brief, the bandgap alignment of the CIS and BOI photocatalysts is in a heterojunction manner (Scheme 2) and the mechanism of charge carrier migration leading to the improved photocatalytic hydrogen generation may be carried out in two ways: (1) the double charge mechanism, wherein photoexcited electrons from the higher (−)ve CB potential of photosystem I (PS-I) move to the lower CB of photosystem II (PS-II), and simultaneously the photoinduced holes move from higher to lower positive VB potential in a cyclic manner; and (2) the direct Z-scheme mechanism, in which case the electrons in the CB of the system combine with the holes in the VB of the other system without the assistance of any mediator. In detail, if the excitons flow in CIS–BOI photocatalyst goes with the former kind of mechanism as shown in Scheme 2(a), the photo-excited electrons (e−) from the higher CB potential of CIS transfer to the lower CB potential of BOI and the photo-excited holes (h+) from the higher VB potential of BOI transfer to the lower VB potential of CIS. Hence, electron density at CB of BOI increases and electrons are required for the reduction of H2O/2H+ to H2, so the reduction reaction must occur at the CB of BOI. Nevertheless, the accumulated electrons from the CB of BOI cannot reduce H2O to H2 as the CB potential of BOI (0.53 eV) is not suitable for the photocatalytic hydrogen evolution reaction and it should be less than the standard reduction potential of H2 (−0.41 V at pH 7) for an efficacious water reduction process. Hence, when photo-excited electrons and holes transfer via a double charge mechanism, photo-reduction of H2O cannot take place using the CIS–BOI catalyst. However, in the performed experiment, enhanced photocatalytic H2 evolution was observed for the composite material compared to the neat CIS catalyst, which confirms that the photoexcited electron–hole transfer proceeds via the later kind of mechanism, as shown in the Scheme 2(b). In short, after the excitation of electrons and holes, accumulated photoelectrons on the CB of BOI migrate to the VB of CIS through the heterojunction interface without any intermediary and get recombined under the influence of the coulombic force, band bending and built-in electric potential. Consequently, recombination of the charge carriers occurs leading to a quick separation of photo-excited electrons from the conduction band of CIS and holes from VB of BOI. As a result, the heterojunction interface is treated as a recombination hub of charge carriers (e−–h+).51 Furthermore, electrons with high (−)ve reduction potential are available at the CB of CIS and holes with high oxidation ability in the VB of BOI, respectively. In the intervening time, the holes on the surface of BOI are consumed by the sacrificial agent (methanol) and the electrons on the surface of the CIS reduce the water molecule to evolve hydrogen gas. As a result, the direct Z-scheme mechanism could smoothen the progress of the charge transfer and separation process, which enhances the photocatalytic activity. Further, to double sure the origin of the Z-scheme type charge transfer mechanism, the NBT (nitro blue tetrazolium chloride) test and TA (terephthalic acid) test, were carried out using 5 × 10⁻⁵ M NBT and 5 × 10⁻⁴ M TA solutions, respectively, with all three catalysts to check their superoxide (˙O2−) and hydroxyl radical (OH˙) formation abilities by following our previously reported literature.10,13 Generally, the reduction potential of O2 to ˙O2− is about −0.33 eV vs. NHE. Hence, in the case of the BOI catalyst no superoxide radical formation occurs as its CB position lies at a positive value (+0.53 eV), however, ˙O2− species production is observed in the case of the CIS material as its CB is located at a negative potential, i.e., −1.01 eV. Likewise, the CIS–BOI binary composite shows absorbance at 258 nm during NBT spectral analysis, which confirms the conversion of molecular oxygen to superoxide and this takes place over the CIS unit of the binary composite and further, clarifies that the electron–hole migration between the CB and VB of the combining entities does not proceed via a double charge route but rather goes via the proposed Z-scheme mechanism. Additionally, the reduction in the NBT absorption spectrum intensity corresponds to the degradation of NBT moieties by the produced superoxide radical. Further, it was found that the major decrease in UV spectrum intensity is visualized for the CIS–BOI hybrid compared to pristine CIS, which suggests the accumulation of more photoexcited electrons on the CIS unit of the composite, promoting the effective reduction of O2 to ˙O2− as shown in ESI (Fig. S4(a)).† Similarly, the oxidation potential of OH− to ˙OH is +1.99 eV vs. NHE. As such, in the case of CIS, the ˙OH radical formation is not possible as the VB is present at 1.23 eV. Nevertheless, BOI shows ˙OH radical production as its VB lies at 2.31 eV. In the performed NBT test, the CIS–BOI composite shows emission spectra at about 424 nm, as represented in ESI (Fig. S4(b)†) during TA spectral analysis, which verifies the ˙OH radical formation and the generation must have taken place on the surface of BOI, rather than on the surface of CIS. Furthermore, the increase in PL spectrum intensity is expected for CIS–BOI, indicating the accumulation of holes on the VB of BOI, which endorses a more hydroxyl radical formation by effective oxidation of OH− ions. Hence, it is one more time clear that the migration of e−–h+ takes place via the Z-scheme mechanism.
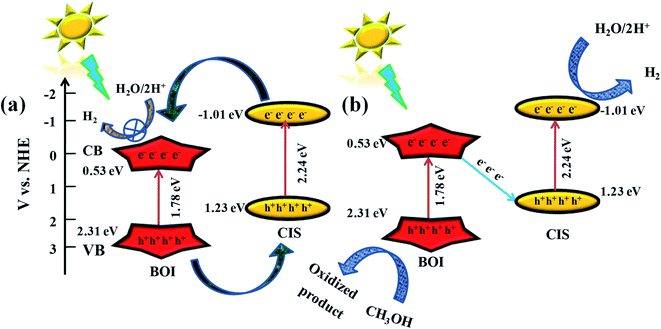 |
| | Scheme 2 Suggested mechanism for hydrogen evolution over the CIS–BOI catalyst via (a) the double charge mechanism and (b) the direct Z-scheme mechanism under visible-light illumination. | |
The overall equations for photocatalytic hydrogen generation can be written as follows:
| | |
CIS–BOI + hv = CIS–BOI (e− + h+)
| (4) |
| | |
CH3OH + h+ = ˙CH2OH + H+
| (7) |
| | |
˙CH2OH = CH2O + e− + H+
| (8) |
4. Conclusion
In the proposed study, CIS–BOI Z-scheme heterojunction photocatalysts were fruitfully synthesized via an ultra-sonication process and analyzed using different characterization techniques. The as-prepared composite (CIS–BOI) showed superior activity towards the photocatalytic performance of H2 evolution under visible-light irradiation, which was 3.2 times greater than the pristine CIS NC, which is credited to the successful separation of charge carriers that go through a direct or mediator-free Z-scheme heterostructure system. In addition, the 3D BOI MF contributes more surface area for the effective distribution of CIS leading to increment in the number of the surface active sites as well as interfacial electron transfer; thereby decreasing the recombination of e−–h+ pairs, which plays a significant role in the photocatalysis. Further, the effective charge separation is well demonstrated by PL, EIS and photocurrent measurements. Additionally, the formation of the heterojunction between the combining units is well established through photocurrent and MS measurements. Therefore, this study can provide a novel approach by designing and constructing promising co-catalyst-free Z-scheme-oriented photocatalytic systems for H2 production in a greener manner.
Conflicts of interest
The authors declare no competing financial interest.
Acknowledgements
The authors express their profound gratitude toward Siksha ‘O’ Anusandhan Deemed to be University for giving all necessary facilities and financial support to carry out this immense research work.
References
- C. L. Wang and D. Astruc, Chem. Soc. Rev., 2014, 43, 7188–7216 RSC.
- D. Prusty, L. Paramanik and K. M. Parida, Energy Fuels, 2021, 35, 4670–4686 CrossRef CAS.
- S. Chu, Y. Cui and N. Liu, Nat. Mater., 2017, 16, 16–22 CrossRef PubMed.
- S. Mansingh, D. K. Padhi and K. M. Parida, Int. J. Hydrogen Energy, 2016, 41, 14133–14146 CrossRef CAS.
- S. Sultana, S. Mansingh and K. M. Parida, J. Phys. Chem. C, 2018, 122, 808–819 CrossRef CAS.
- S. Nayak, G. Swain and K. M. Parida, ACS Appl. Mater. Interfaces, 2019, 11, 20923–20942 CrossRef CAS PubMed.
- M. Arumugam and M. Y. Choi, J. Ind. Eng. Chem., 2020, 81, 237–268 CrossRef CAS.
- B. P. Mishra and K. M Parida, J. Mater. Chem. A, 2021, 9, 10039 RSC.
- D. Majhi, K. Das, R. Barik, S. Padhan, A. Mishra, R. Dhiman, P. Dash, B. Nayak and B. G. Mishra, J. Mater. Chem. A, 2020, 8, 21729–21743 RSC.
- D. Kandi, D. P. Sahoo, S. Martha and K. M. Parida, Adv. Mater. Interfaces, 2019, 6, 1900370 CrossRef.
- S. Nayak and K. M. Parida, Sci. Rep., 2019, 9, 2458–2481 CrossRef PubMed.
- L. Acharya, S. Nayak, S. P. Patnaik and K. M. Parida, J. Colloid Interface Sci., 2020, 566, 211–223 CrossRef CAS PubMed.
- S. Subudhi, S. Mansingh, G. Swain, A. Behera, D. Rath and K. M. Parida, Inorg. Chem., 2019, 58, 4921–4934 CrossRef CAS PubMed.
- D. P. Sahoo, S. Patnaik and K. M. Parida, ACS Omega, 2019, 4, 14721–14741 CrossRef CAS PubMed.
- W. Jiang, X. Zong, L. An, S. Hua, X. Maio, S. Luan, Y. Wen, F. F. Tao and Z. Sun, ACS Catal., 2018, 8, 2209–2217 CrossRef CAS.
- J. Di, J. Xia, S. Guo, H. Li and S. Dai, Nano Energy, 2017, 41, 172–192 CrossRef CAS.
- J. Li, H. Li, G. Zhan and L. Zhang, Acc. Chem. Res., 2017, 50, 112–121 CrossRef CAS PubMed.
- R. He, D. Xu, B. Cheng, J. Yu and W. Ho, Nanoscale Horiz., 2018, 3, 464–504 RSC.
- J. Li, Y. Yu and L. Zhang, Nanoscale, 2014, 6, 8473–8488 RSC.
- D. S. Bhachu, S. J. Moniz, S. Sathasivam and D. Scanlon, Chem. Sci., 2016, 7, 4832–4841 RSC.
- Z. Guo, S. Zhu, Y. Yong, X. Zhang, X. Dong, J. Du, J. Xie, Q. Wang, Z. Gu and Y. Zhao, Adv. Mater., 2017, 29, 1704136 CrossRef PubMed.
- H. Zhang, Y. Yang, Z. Zhou, Y. Zhao and L. Liu, J. Phys. Chem. C, 2014, 118, 14662–14669 CrossRef CAS.
- L. Ye, Y. Su, X. Jin, H. Xie and F. Cao, Appl. Surf. Sci., 2014, 311, 858–863 CrossRef CAS.
- X. Zhang, L. Z. Zhang, T. F. Xie and D. J. Wang, J. Phys. Chem. C, 2009, 113, 7371–7378 CrossRef CAS.
- S. Han, J. Li, K. Yang, J. Lin and C. Xuebao, Chin. J. Catal., 2015, 36, 2119–2126 CrossRef CAS.
- R. Albuquerque, M. C. Neves, M. H. Mendonca, T. Trindade and O. C. Monteiro, Colloids Surf., A, 2008, 328, 107–113 CrossRef CAS.
- K. H. Reddy, S. Martha and K. M. Parida, Inorg. Chem., 2013, 52, 6390–6401 CrossRef CAS PubMed.
- T. B. Li, G. Chen, C. Zhou, Z. Y. Shen, R. C. Jin and J. X. Sun, Dalton Trans., 2011, 40, 6751–6758 RSC.
- D. Kandi, S. Martha, A. Thirumurugan and K. M. Parida, J. Phys. Chem. C, 2017, 121, 4834–4849 CrossRef CAS.
- L. Paramanik, K. H. Reddy and K. M. Parida, J. Phys. Chem. C, 2019, 123, 21593–21606 CrossRef CAS.
- X. B. Fan, S. D. Yu, F. D. Zhang, L. P. Zhang, Y. Tao, C. H. Tung and L. Z. Wu, ChemSusChem, 2017, 10, 4833–4838 CrossRef CAS PubMed.
- J. T. Muldar, N. Kirkwood, L. D. Trizio, C. Li, S. Bals, L. Manna and A. J. Houtepen, ACS Appl. Nano Mater., 2020, 3, 3859–3867 CrossRef PubMed.
- Y. Guo, F. Yang, X. Zheng, J. Tang, H. Zhong, A. Yu, J. Wang and B. Zou, J. Phys. Chem. Lett., 2019, 10, 5297–5301 CrossRef CAS PubMed.
- Y. Chen, W. Yang, S. Gao, C. Sun and L. Qi, ACS Appl. Nano Mater., 2018, 1, 3565–3578 CrossRef CAS.
- Y. Huang, H. Li, M. S. Balogun, W. Liu, Y. Tong, X. Lu and H. Ji, ACS Appl. Mater. Interfaces, 2014, 6, 22920–22927 CrossRef CAS PubMed.
- Z. Guan, J. Pan, Q. Li, G. Li and J. Yang, ACS Sustainable Chem. Eng., 2019, 7, 7736–7742 CrossRef CAS.
- Q. Wang, W. Wang, L. Zhong, S. Liu, X. Cao and F. Cui, Appl. Catal., B, 2018, 220, 290–302 CrossRef CAS.
- Y. Chen, S. Li, L. Huang and D. Pan, Inorg. Chem., 2013, 52, 7819–7821 CrossRef CAS PubMed.
- X. Y. Liu, G. Zhang, H. Chen, H. Li, J. Jiang, Y. T. Long and Z. Ning, Nano Res., 2018, 11, 1379–1388 CrossRef CAS.
- P. F. Liu, M. Y. Zu, L. R. Zheng and H. G. Hang, Chem. Commun., 2019, 55, 12392 RSC.
- S. Chen, Y. Hu, L. Ji, X. Jiang and X. Fu, Appl. Surf. Sci., 2014, 292, 357–366 CrossRef CAS.
- X. Gao, Y. Shang, L. Liu and F. Fu, J. Catal., 2019, 371, 71–80 CrossRef CAS.
- N. Tian, H. Huang, C. Liu, F. Dong, T. Zhang, X. Du, S. Yu and Y. Zhang, J. Mater. Chem. A, 2015, 3, 17120–17129 RSC.
- G. Swain, S. Sultana and K. M. Parida, ACS Sustainable Chem. Eng., 2020, 8, 4848–4862 CrossRef CAS.
- G. Swain, S. Sultana, J. Moma and K. M. Parida, Inorg. Chem., 2018, 57, 10059–10071 CrossRef CAS PubMed.
- K. Wang, Z. Xing, M. Du, S. Zhang, Z. Li, S. Yang, K. Pan, J. Liao and W. Zhou, J. Colloid Interface Sci., 2021, 592, 259–270 CrossRef CAS PubMed.
- A. Rana, A. Kumar, G. Sharma, M. Naushad, C. Bathula and F. J. Stadler, J. Mol. Liq., 2021, 343, 117652 CrossRef CAS.
- A. Kumar, G. Sharma, A. Kumari, C. Guo, M. Naushad, D. N. Vo, J. Iqbal and J. Stadler, Appl. Catal., B, 2021, 284, 119808 CrossRef CAS.
- X. Li, K. Gao, B. Mo and J. Tang, Inorg. Chem., 2021, 60, 1352–1358 CrossRef CAS PubMed.
- J. Liu, Y. Liu, N. Liu, Y. Han, X. Zhang, Y. Lifshitz, S. T. Lee, J. Zhong and Z. Kang, Science, 2015, 347, 970–974 CrossRef CAS PubMed.
- P. Zhou, J. G. Yu and M. Jaroniec, Adv. Mater., 2014, 26, 4920–4935 CrossRef CAS PubMed.
Footnote |
| † Electronic supplementary information (ESI) available: Chemical information, synthetic strategies, characterization techniques, preparation of working electrodes, XPS survey of CIS–BOI composite, FESEM image of CIS–BOI composite, calculation of Apparent Conversion Efficiency (ACE) and a number of H2 molecules of CIS–BOI composite and pristine CIS NC, XRD analysis of CIS–BOI composite before and after use and NBT test of the samples. See DOI: 10.1039/d1ra08004k |
|
| This journal is © The Royal Society of Chemistry 2022 |
Click here to see how this site uses Cookies. View our privacy policy here.  Open Access Article
 ,
Lopamudra Acharya,
Lekha Paramanik and
K. M. Parida
 *
*
![[thin space (1/6-em)]](https://www.rsc.org/images/entities/char_2009.gif) :
:![[thin space (1/6-em)]](https://www.rsc.org/images/entities/char_2009.gif) 1 ethanol–water solution. Then, the solutions were treated under ultra-sonication for a period of 30 min. After a while, both solutions were mixed and sonicated again for 4 h. Then, the solution was heated to 70 °C with a constant stirring of 12 h to evaporate ethanol. Additionally, it was dried under vacuum to obtain the CIS–BOI composite material. The overall synthetic method is represented schematically in Scheme 1.
1 ethanol–water solution. Then, the solutions were treated under ultra-sonication for a period of 30 min. After a while, both solutions were mixed and sonicated again for 4 h. Then, the solution was heated to 70 °C with a constant stirring of 12 h to evaporate ethanol. Additionally, it was dried under vacuum to obtain the CIS–BOI composite material. The overall synthetic method is represented schematically in Scheme 1.
![[thin space (1/6-em)]](https://www.rsc.org/images/entities/char_2009.gif) :
:![[thin space (1/6-em)]](https://www.rsc.org/images/entities/char_2009.gif) In was found to be 0.74
In was found to be 0.74![[thin space (1/6-em)]](https://www.rsc.org/images/entities/char_2009.gif) :
:![[thin space (1/6-em)]](https://www.rsc.org/images/entities/char_2009.gif) 0.26, which is reliable with the molar ratio of precursors taken at the time of the synthesis of CIS NC. Hence, it is obvious from the data that the reactivity of Cu and In was finely proscribed at the time of synthesis and non-stoichiometric CIS resulted as estimated.
0.26, which is reliable with the molar ratio of precursors taken at the time of the synthesis of CIS NC. Hence, it is obvious from the data that the reactivity of Cu and In was finely proscribed at the time of synthesis and non-stoichiometric CIS resulted as estimated.


![[thin space (1/6-em)]](https://www.rsc.org/images/entities/char_2009.gif) :
:![[thin space (1/6-em)]](https://www.rsc.org/images/entities/char_2009.gif) 4 water
4 water![[thin space (1/6-em)]](https://www.rsc.org/images/entities/char_2009.gif) :
:![[thin space (1/6-em)]](https://www.rsc.org/images/entities/char_2009.gif) methanol solution
methanol solution![[thin space (1/6-em)]](https://www.rsc.org/images/entities/char_2009.gif) :
:![[thin space (1/6-em)]](https://www.rsc.org/images/entities/char_2009.gif) 4 water
4 water![[thin space (1/6-em)]](https://www.rsc.org/images/entities/char_2009.gif) :
:![[thin space (1/6-em)]](https://www.rsc.org/images/entities/char_2009.gif) methanol solution
methanol solution


