 Open Access Article
Anisotropic Kubo conductivity of electric field-induced monolayer β12-borophene
Mohammad Mortezaei Nobahari
Department of Sciences, Ferdowsi University of Mashhad, Iran. E-mail: mortezaie.mm71@gmail.com
First published on 23rd December 2021
Abstract
In this paper, we used three monolayer β12-borophene Hamiltonian models to calculate the band structure, intra-band, and inter-band optical conductivity (IOC). Linear response theory and the Kubo formula are employed to calculate optical conductivity. We have shown that the band gap proportional to the inversion non-symmetric model increases by applying an external electric field (EEF), and for homogeneous and inversion-symmetric models, gap opening occurs. We found an anisotropic behavior in the IOC of β12-borophene for polarized light along x and y-directions. The peak of the real part of the IOC for polarized light along the x-direction (ℜσxx) locates at the energy equal to the band gap and by applying an EEF shifts to the higher energies and experiences a blue shift. Also, the electric field has little effect on the IOC along y-direction (σyy) and in contrast to σxx, by applying an electric field, the peak of the IOC shifts towards lower energies and a redshift occurs. In addition, unlike inter-band transitions, the intra-band optical conductivity of β12-borophene is isotropic in all three models, and an EEF can not shift plots to higher or lower energies and only reduces the height of both imaginary and real parts of the optical conductivity.
1 Introduction
After the synthesis of graphene in 2004, two-dimensional (2D) materials attracted the attention of researchers.1 This work opened up a new window for researching low-dimensional materials. Due to its zero band gap and low on/off ratio, researchers looked for new alternative materials. To date, there are more than 700 stable 2D materials like phosphorene, silicon, borophene,.etc. In recent years, several types of borophene were synthesized on the Ag(111) substrate.2–4 There are many types of borophene, but due to the strong interaction between β12 and the Ag substrate, this material is one of the most stable boron allotropes.5,6 Other allotropes of boron are not as stable as β12-borophene.7 By using chemical bonding analyses based on the adaptive natural density partitioning (AdNDP) method, it understood that all 2D boron clusters have an outer ring featuring strong two-center, two-electron (2c-2e) B–B bonds (in which two valence electrons are shared between two atoms) and other atoms interacting with the peripheral ring almost exclusively through delocalized σ and π bonding.8,9 The main challenge in 2D materials is their instability. However, researchers are trying to overcome this by using an appropriate substrate, but the difference between lattice parameters of the substrate and two-dimensional material can make it unstable.10 Borophene, due to its electron mobility, band gap, and anisotropic properties and having both a massless Dirac fermion and massless/massive triplet fermions11,12 is different from other 2D materials. Researchers observed the Dirac fermions in β12-borophene by angle-resolved photoemission spectroscopy, a tight-binding model and first-principles calculations.11–14 The results indicated that β12 is particularly metallic.15–19 It is understood that lattice thermal conductance in the ballistic regime of borophene is very high and similar to graphene in low frequencies, phonons transition in borophene is almost isotropic, and for high frequencies, phonon transition is one-dimensional, and phonons move in one direction.20 Also, it is understood that borophene behaves like a superconductor in the critical temperature range of Tc ≃ 10–20 K since it has a small atomic mass.21 Using non-equilibrium Green’s function simulations and first-principles calculations, thermal conductance of the borophene monolayer has been calculated.20 In a study by Kistanov et al22 charge localization, and the band gap opening of borophene were studied using the first-principles method. The mechanical properties of borophene are unique because of its anisotropic structure. In a study by Mannix et al2 The Young’s modulus of borophene was calculated in special directions. It was found that this quantity in the kx-direction is 398 GPa nm which is even greater than graphene, so it is one of the hardest 2D materials. Effects of the electric field and the charged impurity on the electronic phase and electrical conductivity of β12-borophene were studied using linear response theory and a Green’s function approach.23 Using density functional theory (DFT) researchers studied strain effects on the optical absorbance and electronic band structure of β12 and δ6.24 Also, Zhang et al25 have predicted the high potential of β12 and χ3 phases of borophene for Li-ion and Na-ion batteries. Based on DFT calculations, the electronic, optical, and thermodynamic features of striped borophene were calculated by Peng et al.26Optical conductivity is one of the most significant properties of the materials that describes the material’s response to electromagnetic waves. Knowing the optical conductivity of materials help us to understand the pattern of absorption and scattering of the incident light, and these parameters are critical for use in solar cell technology and optoelectronics. Absorption and scattering are controllable in different ways. Potential gates are one of these methods. Applying an electric field to the β12-borophene generates on-site energies, thus increasing the gap and changing the absorption and scattering pattern.
Due to the inability to solve the 5 × 5 β12-borophene Hamiltonian analytically, to date, there is no report of calculating the optical conductivity of β12-borophene using the tight-binding approximation and Kubo formula. According to the Kubo formula, we need both eigenvalues and eigenvectors of the 5 × 5 Hamiltonian to calculate the optical conductivity. For this purpose, in the present work, we will use a numerical method to diagonalize the Hamiltonian and calculate direction-dependent velocities and optical conductivity.
By considering different symmetries for on-site energies and hopping parameters, there are three various Hamiltonian models of β12-borophene.11 The symmetries of the β12-borophene lattice are the inversion symmetry model, but this symmetry can be broken due to the Ag substrate, and this leads to the inversion non-symmetric model. The third model is called the homogeneous model. In this model, all hopping parameters and on-site energies are equal, and some features of β12-borophene are present only in this model (e.g. gapless triplet fermions).
In this paper, we will investigate the intra-band and inter-band optical conductivity of β12-borophene using linear response theory and the Kubo formula and study the EEF effects on the optical conductivity along the x (σxx) and y (σyy) directions. For this purpose, first, we will calculate the band structure of β12-borophene, then focus on the high symmetry points K and K′ (band gap) to interpret the EEF effects on the IOC. We will also calculate the intra-band optical conductivity and study the EEF effects on the imaginary and real parts.
2 Theory
β12-borophene has a honeycomb lattice structure with five atoms in its unit cell. Atoms are labeled as a, b, c, d, and e as illustrated in Fig. 1. The unit cell has length a = 2.923 6 Å and width Å, which is one-half of the honeycomb lattice. The first Brillouin zone of β12 is a rectangle with −π/a ≤ kx ≤ π/a and −π/b ≤ ky ≤ π/b however, we can shift the first Brillouin zone in the kx-direction and use 0 ≤ kx ≤ 2π/a. Using the tight-binding approximation, the β12-borophene Hamiltonian is
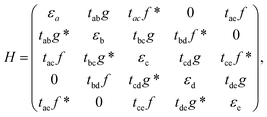 | (1) |
 and
and . According to the different symmetries for on-site energies and hopping parameters, there are three Hamiltonian models with different on-site energies and hopping parameters11 which are known as:
 | ||
| Fig. 1 Top view of the geometry structure of β12 borophene. Atoms are labeled as a, b, c, d and e in different colors. The unit cell is presented by the red solid lines in the rectangle shape. | ||
inversion non-symmetric with
| εa = εd = 0.196 eV, εb = εe = −0.058 eV, εc = −0.845 eV, | (2) |
| tab = tde = −2.04 eV, tac = tce = −1.79 eV, tbc = tcd = −1.84 eV, tae = −2.12 eV, tbd = −1.91 eV; | (3) |
inversion symmetric with
| εa = εe = 0.196 eV, εb = εd = −0.058 eV, εc = −0.845 eV, | (4) |
| tab = tde = −2.04 eV, tac = tce = −1.79 eV, tbc = tcd = −1.84 eV, tae = −2.12 eV, tbd = −1.91 eV; | (5) |
Fig. 2 presents the band structure of the homogeneous model. High symmetry points K′ and K reflect Dirac fermions at zero energy (ε = 0) with positions K′ = (−2π/3a, 0) and K = (2π/3a, 0) and X and M points are triplet fermions at the non-zero energies and the three-band touching point Λ. As is clear in Fig. 2, β12-borophene has five bands including two valences and three conduction bands with a direct gap that varied for different Hamiltonian models. Fig. 3 shows the band structure of the homogeneous, inversion symmetric, and inversion non-symmetric Hamiltonian models. It is clear that proportional band gaps (at K or K′) for the homogeneous and inversion-symmetric models are zero, but in the inversion non-symmetric model, there is a gap of about ≃0.254 eV.11
 | ||
| Fig. 3 Band structure of β12-borophene for the (a) homogeneous (b) inversion non-symmetric and (c) inversion symmetric models. | ||
2.1 Optical conductivity
In general, Ohm’s law is J = σE where J is the current density, E is the electric field, and σ is the optical conductivity tensor
 | (6) |
For calculating the optical conductivity of materials first we need current operator. The current operator definition is jμ = e∂H/∂kμ where μ = x or y.
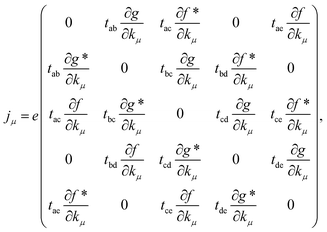 | (7) |
General form for the current operator is
 | (8) |
By using linear response theory, the optical conductivity is given as
 | (9) |
Using eqn (9), inter-band optical conductivity is given as27,28
 | (10) |
For low-frequency photons in the THz region (between the microwave and infra-red), intra-band optical conductivity plays the main role in the optical conductivity. Inra-band transitions are between a special band and in eqn (10) c = v and (fk,c − fk,v)/ΔE must be interpreted as −∂f(k)/∂εj and Drude-like conductivity described as29
 | (11) |
For studying EEF effects on the β12-borophene, we considered two voltage gates V/2 and −V/2 that are placed at the top and the bottom of β12-borophene, respectively. The total Hamiltonian after perturbation by the electric field is
 | (12) |
3 Results and discussion
The electronic phase plays an important role in the optical properties, and any change in the electronic phase affects optical properties. Fig. 4 shows the energy difference between the highest valence and the lowest conduction bands for −π/b ≤ ky ≤ π/b and 0 ≤ kx ≤ 2π/a at zero EEF. The solid black lines represent the maximum equal energy difference between the lowest conduction and highest valence bands. When the equal energy difference in Fig. 4 is continuous, it is easy for carriers in the valence band to absorb photon energy and transfer it to the conduction band. However, a large energy difference between the two bands reduces the excitation probability.Pristine β12-borophene is a metal, although we can change the electronic phase by applying an electric field. According to Fig. 5 and 6 it is clear that the band gap increases with EEF in all Hamiltonian models. The band gap in the pristine homogeneous model is zero, but when the voltage increases, gap opening occurs. For V = 3 eV the gap of the homogeneous model is about 0.15 eV and with increasing the electric field to V = 5 eV the gap increases to 0.5 eV. For the pristine case in the inversion non-symmetric mode, there is a gap of about 0.254 eV which increases with an electric field to ε0.317 eV and 0.6 eV for V = 3 eV and V = 5 eV respectively. Finally, the β12-borophene monolayer in the pristine inversion symmetric model is gapless and for V = 3 eV and V = 5 eV the band gap arrives at 0.02 eV and 0.3 eV energies respectively.
In the present work, for inter-band transitions, the Fermi energy (EF) locates at the midgap between the conduction and valence bands at the K′ (or K) point. Also, because of momentum conservation, we considered only direct inter-band transitions (q → 0) where q indicates the wave-vector change before and after the scattering process. So we neglect indirect transitions and consider two direct transitions between both valences and three conduction bands.
The maximum in the real part of optical conductivity along the x-direction (ℜσxx) in all three models represents the gap. Fig. 7 shows the real and imaginary parts of the optical conductivity along the x-direction for the inversion non-symmetric model. According to the plots, in the pristine case, in the real part, there is a peak at energy ε = 0.26 eV, which is equal to the band gap of the pristine inversion non-symmetric model. When we apply an EEF equal to V = 3 eV to β12-borophene, the peak of the real part of the optical conductivity shifts toward higher energies, which is known as blue shift. At this voltage, the peak energy is equal to the band gap and is about 0.317 eV. Also, by applying an electric field V = 5 eV, this peak is located at ε = 0.6 eV. According to the Kramers–Kronig relation, dips in the imaginary part are at an energy equal to the peak in the real part.
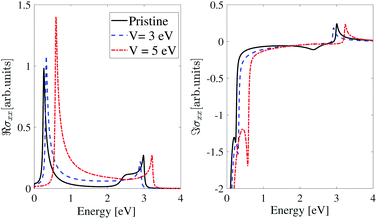 | ||
| Fig. 7 Real and imaginary parts of the IOC of polarized light along the x-direction for the inversion non-symmetric model of β12-borophene in the presence of an electric field. | ||
As mentioned earlier, the band gap for the inversion-symmetric model in the pristine case is zero. According to Fig. 8 when we applied an electric field equal to V = 3 eV to β12-borophene, a peak appeared in the real part of optical conductivity at an energy of about 0.02 eV that is equal to the β12-borophene band gap at V = 3 eV. Applying an EEF V = 5 eV to β12-borophene leads to shifting the peak of the ℜσxx to ε = 0.3 eV which is consistent with the band gap.
 | ||
| Fig. 8 Real and imaginary parts of the IOC of polarized light along the x-direction for the inversion symmetric model of β12-borophene in the presence of an electric field. | ||
As we see in Fig. 9 due to the zero-gap for the homogeneous model in the pristine case, there is no peak in the real part of optical conductivity at low energies. But by applying an EEF, the band gap opening occurs, and at V = 3 eV and V = 5 eV the band gap reaches ε = 0.15 eV and ε = 0.5 eV respectively, and peaks appear at these energies. Also, according to the Kramers–Kronig relation, there is a dip in the imaginary parts at these energies.
 | ||
| Fig. 9 Real and imaginary parts of the IOC of polarized light along the x-direction for the homogeneous model of β12-borophene in the presence of an electric field. | ||
Due to the anisotropic behavior of β12-borophene, the effect of the EEF on the optical conductivity in the y-direction (σyy) is less than that in the x-direction. As shown in Fig. 10, the β12-borophene band structure at kx = 0 and  behaves differently compared to Fig. 5. So we expect the IOC to be different for polarized light along the y-direction. In the IOC for light polarized along the y-direction in the pristine case, peaks and dips appear at the energies shown in Fig. 10, and this is so-called anisotropic optical conductivity. Therefore, we expect the peaks in ℜσyy to be at ε = 3.0 eV, 2.80 eV and 2.90 eV for the pristine homogeneous, inversion non-symmetric and inversion symmetric models respectively. The use of an EEF also reduces the energy difference between the highest valence and the lowest conduction band at kx = 0, so peaks and dips of the IOC shift to lower energies.
 | ||
| Fig. 10 An overview of the lowest conduction band and the highest valence band at kx = 0 under an EEF for (a) homogeneous (b) inversion non-symmetric and (c) inversion symmetric models. | ||
As shown in Fig. 11, the EEF has no significant effect on the optical conductivity of the inversion-symmetric model for light polarized along the y-direction. As we expect from Fig. 10, in the pristine case the optical conductivity peak is at ε = 2.9 eV, and by applying an EEF, the optical conductivity plot shifts toward lower energies (redshift) and for V = 3 eV and V = 5 eV the peak of the real part of the IOC shifts to ε = 2.7 eV and 2.4 eV respectively.
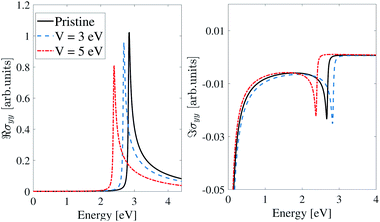 | ||
| Fig. 11 Real and imaginary parts of the IOC of the inversion symmetric model of β12-borophene for polarized light along the y-direction in the presence of an electric field. | ||
The imaginary and real parts of the optical conductivity of the inversion non-symmetric model for polarized light along the y-direction are shown in Fig. 12. Like the inversion-symmetry model, the EEF has little effect on the optical conductivity in the y-direction. Peaks of the real parts of optical conductivity in the pristine and perturbed cases with V = 3 eV and V = 5 eV, are at ε = 2.8 eV, 2.7 eV and 2.5 eV respectively, and there are similar situations for the imaginary parts.
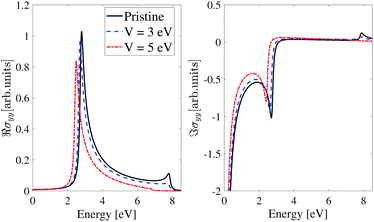 | ||
| Fig. 12 Real and imaginary parts of the IOC of the inversion non-symmetric model of β12-borophene for polarized light along the y-direction in the presence of an electric field. | ||
As illustrated in Fig. 13 in the homogeneous model, the effects of an EEF on σyy are similar to the inversion-symmetric and inversion non-symmetric models. The maximum value of ℜσyy in the pristine case is at ε ≃ 3.0 eV and for the electric field-induced case, real part of σyy shifts toward lower energies and experiences a redshift. The peaks energies for V = 3 eV and V = 5 eV are at ε = 2.8 eV and 2.4 eV respectively.
 | ||
| Fig. 13 Real and imaginary parts of the IOC of the homogeneous model of β12-borophene for polarized light along the y-direction in the presence of an electric field. | ||
At the low energies in the THz region, intra-band transitions exceed the inter-band term (both real and imaginary parts), whereas, in the high-frequency, this term does not play an important role in the optical conductivity. Fig. 14 shows the real and imaginary parts of the intra-band optical conductivity of β12-borophene at the Fermi energy EF = Ec(K′) + μc for light polarized along y-direction. Due to the similarity of the intra-band optical conductivity for light polarized along x and y-directions, real and imaginary parts of σxx are absent in this work. Our results show a similarity between the intra-band optical conductivity of β12-borophene and graphene.30 As we can see in Fig. 14 the height of the ℜσyy and ℑσyy is reduced by applying an EEF, and there is no energy shifting in the real and imaginary parts of the optical conductivity.
In the end, our results show the anisotropic behavior of the β12-borophene due to the anisotropic band structure. For DC currents (ω → 0) optical conductivity converts to electrical conductivity. In a study by Khoa et al23 electrical conductivity of impurity-induced and gated β12-borophene was calculated, and similar to our results, they also reported anisotropic electrical conductivity. Phosphorene has an anisotropic behavior as a puckered 2D material. In a study on the optical properties of strained phosphorene, this anisotropy was observed in the absorption and refraction coefficients.27 Therefore, anisotropic behavior in optical conductivity of β12-borophene is predictable, as we have reported in the present work.
4 Conclusions
In summary, for the β12-borophene monolayer, both the band gap and the optical conductivity can be modified using an EEF. In all three models, the gap increases by applying an electric field. The anisotropic band structure of β12-borophene leads to different optical conductivity for light polarized along the x and y-directions. Also, the peak of the real part of optical conductivity along the x-direction reflects the band gap, and as the electric field increases, it shifts to higher energies and experiences a blue shift. In contrast to σxx, by applying an electric field to β12-borophene, the optical conductivity in the y-direction was shifted to lower energies, and a redshift occurred. Also, intra-band optical conductivity behavior is similar to that of graphene, and applying an external electric field does not shift plots to lower or higher energies but only reduces the height of the IOC plots.Conflicts of interest
There are no conflicts to declare.Notes and references
- K. S. Novoselov, A. K. Geim, S. V. Morozov, D. Jiang, Y. Zhang, S. V. Dubonos, I. V. Grigorieva and A. A. Firsov, Science, 2004, 306, 666–669 CrossRef CAS PubMed.
- A. J. Mannix, X.-F. Zhou, B. Kiraly, J. D. Wood, D. Alducin, B. D. Myers, X. Liu, B. L. Fisher, U. Santiago, J. R. Guest, M. J. Yacaman, A. Ponce, A. R. Oganov, M. C. Hersam and N. P. Guisinger, Science, 2015, 350, 1513–1516 CrossRef CAS PubMed.
- Z. Zhang, A. J. Mannix, X. Liu, Z. Hu, N. P. Guisinger, M. C. Hersam and B. I. Yakobson, Sci. Adv., 2019, 5, eaax0246 CrossRef CAS PubMed.
- B. Feng, J. Zhang, R.-Y. Liu, T. Iimori, C. Lian, H. Li, L. Chen, K. Wu, S. Meng, F. Komori and I. Matsuda, Phys. Rev. B, 2016, 94, 041408 CrossRef.
- Y. Liu, E. S. Penev and B. I. Yakobson, Angew. Chem., Int. Ed., 2013, 52, 3156–3159 CrossRef CAS PubMed.
- Z. Zhang, Y. Yang, G. Gao and B. I. Yakobson, Angew. Chem., 2015, 127, 13214–13218 CrossRef.
- B. Peng, H. Zhang, H. Shao, Z. Ning, Y. Xu, G. Ni, H. Lu, D. W. Zhang and H. Zhu, Mater. Res. Lett., 2017, 5, 399–407 CrossRef CAS.
- A. P. Sergeeva, I. A. Popov, Z. A. Piazza, W.-L. Li, C. Romanescu, L.-S. Wang and A. I. Boldyrev, Acc. Chem. Res., 2014, 47, 1349–1358 CrossRef CAS PubMed.
- L.-S. Wang, Int. Rev. Phys. Chem., 2016, 35, 69–142 Search PubMed.
- H. Li, I. E. Castelli, K. S. Thygesen and K. W. Jacobsen, Phys. Rev. B: Condens. Matter Mater. Phys., 2015, 91, 045204 CrossRef.
- M. Ezawa, Phys. Rev. B, 2017, 96, 035425 CrossRef.
- P. T. T. Le, T. C. Phong and M. Yarmohammadi, Phys. Chem. Chem. Phys., 2019, 21, 21790–21797 RSC.
- M. H. Evans, J. Joannopoulos and S. T. Pantelides, Phys. Rev. B: Condens. Matter Mater. Phys., 2005, 72, 045434 CrossRef.
- B. Feng, O. Sugino, R.-Y. Liu, J. Zhang, R. Yukawa, M. Kawamura, T. Iimori, H. Kim, Y. Hasegawa and H. Li, et al., Phys. Rev. Lett., 2017, 118, 096401 CrossRef PubMed.
- H. Tang and S. Ismail-Beigi, Phys. Rev. B: Condens. Matter Mater. Phys., 2010, 82, 115412 CrossRef.
- X. Wu, J. Dai, Y. Zhao, Z. Zhuo, J. Yang and X. C. Zeng, ACS Nano, 2012, 6, 7443–7453 CrossRef CAS PubMed.
- E. S. Penev, S. Bhowmick, A. Sadrzadeh and B. I. Yakobson, Nano Lett., 2012, 12, 2441–2445 CrossRef CAS PubMed.
- C. Ozdogan, S. Mukhopadhyay, W. Hayami, Z. Guvenc, R. Pandey and I. Boustani, J. Phys. Chem. C, 2010, 114, 4362–4375 CrossRef CAS.
- H. Tang and S. Ismail-Beigi, Phys. Rev. B: Condens. Matter Mater. Phys., 2010, 82, 115412 CrossRef.
- H. Zhou, Y. Cai, G. Zhang and Y.-W. Zhang, npj 2D Mater. Appl., 2017, 1, 1–7 CrossRef.
- E. S. Penev, A. Kutana and B. I. Yakobson, Nano Lett., 2016, 16, 2522–2526 CrossRef CAS PubMed.
- A. A. Kistanov, Y. Cai, K. Zhou, N. Srikanth, S. V. Dmitriev and Y.-W. Zhang, Nanoscale, 2018, 10, 1403–1410 RSC.
- D. Q. Khoa, N. N. Hieu and B. D. Hoi, Phys. Chem. Chem. Phys., 2020, 22, 286–294 RSC.
- L. Adamska and S. Sharifzadeh, ACS Omega, 2017, 2, 8290–8299 CrossRef CAS PubMed.
- X. Zhang, J. Hu, Y. Cheng, H. Y. Yang, Y. Yao and S. A. Yang, Nanoscale, 2016, 8, 15340–15347 RSC.
- B. Peng, H. Zhang, H. Shao, Y. Xu, R. Zhang and H. Zhu, J. Mater. Chem. C, 2016, 4, 3592–3598 RSC.
- M. Yarmohammadi, M. Mortezaei, T. S. Tien and L. T. T. Phuong, J. Phys.: Condens. Matter, 2020, 32, 465301 CrossRef CAS PubMed.
- C. H. Yang, J. Y. Zhang, G. X. Wang and C. Zhang, Phys. Rev. B, 2018, 97, 245408 CrossRef CAS.
- I. Kupčić, Phys. Rev. B: Condens. Matter Mater. Phys., 2009, 79, 235104 CrossRef.
- Y. V. Bludov, N. M. Peres and M. I. Vasilevskiy, J. Opt., 2013, 15, 114004 CrossRef.
| This journal is © The Royal Society of Chemistry 2022 |


