 Open Access Article
Techniques for the characterization of single atom catalysts
Ping Qi†
a,
Jian Wang†
a,
Xavier Djitcheua,
Dehua He b,
Huimin Liu
 *a and
Qijian Zhang
 *a
*a
aSchool of Chemical and Environmental Engineering, Liaoning University of Technology, Jinzhou 121001, P. R. China
bInnovative Catalysis Program, Key Lab of Organic Optoelectronics & Molecular Engineering of Ministry of Education, Department of Chemistry, Tsinghua University, Beijing 100084, China
First published on 5th January 2022
Abstract
Single atom catalysts (SACs) are a hot research area recently. Over most of the SACs, the singly dispersed atoms are the active sites, which contribute to the catalytic activities significantly compared with a catalyst with continuously packed active sites. It is essential to determine whether SACs have been successfully synthesized. Several techniques have been applied for the characterization of the dispersion states of the active sites over SACs, such as Energy Dispersive X-ray spectroscopy (EDX), Electron Energy Loss Spectroscopy (EELS), etc. In this review, the techniques for the identification of the singly dispersed sites over SACs are introduced, the advantages and limitations of each technique are pointed out, and the future research directions have been discussed. It is hoped that this review will be helpful for a more comprehensive understanding of the characterization and detection methods involved in SACs, and stimulate and promote the further development of this emerging research field.
1 Introduction
With the application of nanocatalysts in various reactions and melioration of synthesis methods, catalysts of small particle sizes have been prepared.1–4 It is widely recognized that catalytic activity increases with the reduction of particle size because more active atoms are exposed. Enlightened by this trend, investigators will expect to obtain high atom utilization from high dispersion catalysts in which each active site could be exposed to participate in chemical reactions. The concept of “single-atom catalysis” was firstly introduced by Zhang et al. in 2011. In their work, a highly efficient and robust Pt1/FeOx catalyst was synthesized for CO oxidation reaction by the co-precipitation method. Besides, they demonstrated why Pt single atom catalysts (SACs) showed particularly excellent properties with low loading of Pt.5Inspired by this remarkable research, SACs have been widely investigated in various catalytic reactions. It has been found that SACs have several advantages.6–8 (1) In SACs, the utilization of active center atoms is greatly improved due to their high dispersion.9–12 (2) The strong interaction at the active center–support interface of SACs tunes the electronic properties, leading to the tailorable catalytic activity.13–16 (3) The highly dispersed atoms on the surface of the catalyst have limited numbers of configurations to adsorb the reactant molecules. Compared with traditional nanoparticle (NP) catalysts, side reactions could be significantly inhibited and the selectivity towards the desired products could be improved over SACs.17
Because of these advantages, SACs are widely applied in reactions where a single active site works, such as CO oxidation reaction,18–20 hydrogenation reactions21–23 and so on. On the contrary, SACs cannot catalyze reactions that require surface ensemble sites,24,25 such as hydrocarbon (C ≥ 2) oxidation reaction26 and hydrogenolysis reaction,27 in which traditional nanoparticle catalysts have been extensively explored. Consequently, SACs are a promising research direction in specific reactions.
In single atom catalysis, it is particularly important to determine whether SACs have been successfully synthesized. Up to now, several techniques have been utilized to investigate the presence of single atoms (SAs) in SACs. These techniques could be roughly divided into two types. One type includes high resolution scanning tunneling microscopy (STM) and high angle annular dark field scanning transmission electron microscope (HAADF-STEM), which can directly observe the atomic morphology.28 The other type consists of X-ray absorption spectroscopy (XAS), Fourier-transform infrared spectroscopy (FTIR), X-ray photoelectron spectroscopy (XPS), energy dispersive X-ray spectroscopy (EDX), electron energy loss spectroscopy (EELS) and surface enhanced Raman spectroscopy (SERS), which can provide auxiliary evidence for the existence of SAs (the information of SACs that can be obtained by different techniques are listed in Table 1). Giving an introduction of these techniques to the readers will give them a clear picture and inspire more studies on the area of SACs. As some of the techniques, such as STM, HAADF-STEM, XAS, FTIR and XPS have already been reviewed somewhere,28 this review emphasizes on the applications of EDX, EELS and SERS in SACs. We will briefly introduce the principles of these techniques, illuminate the advantages and limitations of each technique, and emphasize the necessity of combining multiple characterization approaches to fully investigate SACs. In addition, ex situ techniques can not give the precise information of SAs on the catalyst surface in reaction atmosphere, because the atomic structure of SACs might undergo transformation. Hence, in situ/operando techniques are also introduced in this review for the determination of the singly dispersed sites over SACs under the working conditions.
| Techniques | Uses | Information obtained | Merits/disadvantages | Typical resolution |
|---|---|---|---|---|
| XAS | Ex situ and in situ operando | Valence state; electronic structure; coordination number | Atomic level sensitivity; in situ recognition of adsorption process; it is sensitive to chemical groups, local structures and spatial coordination; the test time is short and the damage to the sample is small; complex data processing | 0.1 nm |
| STM | Ex situ and in situ operando | Morphology structure; atomic distribution state | Atomic level sensitivity; in situ recognition of adsorption process; the working environment has universal applicability; the result is easily affected by environment | 0.01 nm vertical resolution |
| HAADF-STEM | Ex situ and in situ operando | Atomic distribution state; morphology structure | Atomic level sensitivity; in situ recognition of adsorption process; thick and low contrast specimens can be observed; micro diffraction can be realized; imaging is limited to selected areas | 0.08 nm |
| EDX | Ex situ and in situ operando | Element type analysis | Atomic level sensitivity; in situ recognition of adsorption process; used with HAADF-STEM; low energy resolution | 0.1 nm |
| EELS | Ex situ and in situ operando | Element and chemical state analysis | Atomic level sensitivity; in situ recognition of adsorption process; high electronic structure sensitivity; insensitive to high number atoms | 0.1 nm |
| SERS | Ex situ and in situ operando | Crystal structure; chemical bonding | Atomic level sensitivity; in situ recognition of adsorption process; difficult sample preparation process; only specific elements could be analyzed | 0.1 nm |
| FTIR | Ex situ and in situ operando | Molecular groups; chemical bonding | Atomic level sensitivity; in situ recognition of adsorption process; only specific molecules can be detected | 0.1 nm |
| XPS | Ex situ and in situ operando | Element analysis; chemical state | Atomic level resolution; it can detect detailed electronic structure and geometric information; in situ detection process; the information is not persuasive | 0.1 nm |
2 Characterization techniques for evidence of single atoms in SACs
2.1 X-ray absorption spectroscopy
XAS is a special technique, which has been widely applied to determine the geometric chemistry and electronic structure of catalysts. XAS could provide the strongest evidence for the presence of SAs. When the irradiated energy of the X-rays is greater than the energy required to excite a specific element on a catalyst, the absorption coefficient is dramatically increased. The absorption edge affords information on the atomic structure of the catalyst. The excessive energy is emitted as an electromagnetic wave, which could be scattered back by adjacent atoms with the outgoing of electromagnetic wave, causing oscillations in the detective signal. XAS contains two parts. (1) The X-ray absorption near edge structures (XANES) and (2) the extended X-ray absorption fine structure (EXAFS). XANES could reflect the electron and oxidation states while EXAFS could provide information on chemical bonding, the interatomic distance and the coordination number of targets element.29–33XAS was universally utilized to reflect the dispersion of active sites on the surface of SACs.34 For example, Chen et al. synthesized a SAs Au1/mpg-C3N4 catalyst and used XAS to determine the electronic and geometric structures of the singly dispersed Au sites.34 The drastic difference between the XANES features for Au1/mpg-C3N4 and Au foil, as well as Au NPs/mpg-C3N4. The result in Fig. 1a implied that the Au atoms were possibly singly dispersed on support, the same threshold value (11![[thin space (1/6-em)]](https://www.rsc.org/images/entities/char_2009.gif) 919.4 eV) for Au over Au1/mpg-C3N4 and AuCl indicated that the valence of Au on Au1/mpg-C3N4 was +1. The lacking the peak assigned to the Au–Au bond in the r-space spectrum of Au1/mpg-C3N4 further confirmed the singly dispersed state of Au on Au1/mpg-C3N4 (Fig. 1b).35
919.4 eV) for Au over Au1/mpg-C3N4 and AuCl indicated that the valence of Au on Au1/mpg-C3N4 was +1. The lacking the peak assigned to the Au–Au bond in the r-space spectrum of Au1/mpg-C3N4 further confirmed the singly dispersed state of Au on Au1/mpg-C3N4 (Fig. 1b).35
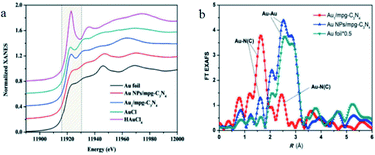 | ||
| Fig. 1 (a) XANES spectra of Au L3 edge. (b) r-space spectra of Au1/mpg-C3N4 and a series of reference samples. This figure has been reproduced from ref. 35 with permission from Wiley-VCH, copyright 2018. | ||
Atomic Cu1-N2/HCNS catalyst was prepared by the simple reduction deposition-acid leaching method. Due to the unique atomic structure of Cu in the catalyst, the activity of SAs Cu-N2 is much better than that of Cu-N3. Under the same reaction condition, the catalytic activity of the former was increased by 3.4 times. Cu1-N2/HCNS catalyst afforded higher selectivity and stability than Cu NPs or nanoclusters.36
In order to further investigate the electronic properties and coordination environment of Cu1-N2/HCNS, XANES and EXAFS were utilized. The results in Fig. 2a indicated outline of Cu K-edge XANES. Cu1-N2/HCNS exhibited an energy absorption edge between Cu+ and Cu2+ standards in the range of E0 (about 8979 eV). The corresponding oxidation state of Cu is +1.5 by linear combination fitting. On the EXAFS spectrum (Fig. 2b) of Cu1-N2/HCNS, there was only a peak at 1.9 Å, which revealed the dispersion of single Cu atoms in the whole HCNs matrix.36
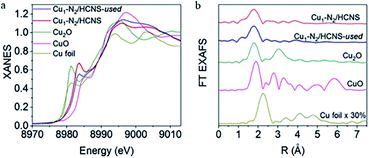 | ||
| Fig. 2 (a) Cu K-edge XANES spectra. (b) Cu K-edge EXAFS spectra. This figure has been reproduced from ref. 36 with permission from Elsevier, copyright 2019. | ||
In addition to the examples listed above, XAS could be applied in situ to reveal the structure of SACs under realistic reaction conditions.37–41 For instance, Wei et al. used in situ XAS to track the evolution of the catalytic active sites of Co SACs under alkaline hydrogen evolution reaction.38 They revealed that the unsaturated singly dispersed Co sites was subjected to undergo a structural and valence state evolution under the reaction atmosphere. They would transform into an HO–Co1–N2 moiety upon the adsorption of a hydroxyl group and further involve into H2O–(HO–Co1–N2) by adsorbing water molecules.38
The center atoms with different coordination numbers or ligands exhibit different XANES adsorption curves. Consequently, it is the most straightforward and beneficial approach to identify the existence of SAs. XAS and in situ XAS are critical in providing the structural details of SACs for unraveling the reaction mechanisms at an atomic level. Yet, the operation of XAS is quite complex and the analysis/interpretation of XAS data is complicated, which limits the reproducibility of XAS final results.
2.2 Scanning tunneling microscopy
The tunneling effect applies for STM. When the distance between the catalyst surface and the needle-like tip is less than 1 nm, the electronic clouds of catalyst surface and the needle-like tip overlap. If a voltage is introduced between the catalyst and the needle-like tip, tunneling current is generated. The tunneling current is exponentially related to the distance between the needle-like tip and the catalyst surface. When the lengthwise height is slightly changed, the intensity of tunneling current is greatly modified to realize the ultra-high atomic resolution (the principle of STM is depicted in Fig. 3). The lateral resolution of STM is 0.1 nm, which makes it applicable to investigate the singly dispersed atoms in SACs.42–45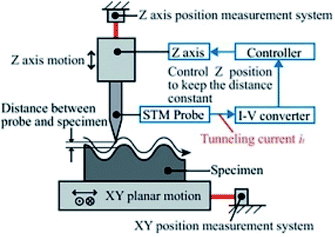 | ||
| Fig. 3 Schematic diagram of STM. This figure has been reproduced from ref. 46 with permission from Elsevier, copyright 2012. | ||
For example, Flytzani-Stephanopoulos et al. utilized high-resolution STM to characterize the distribution of Pt atoms on Cu(111) surface. The results in Fig. 4a and b indicated that the Pt atoms are singly and randomly distributed throughout the surface of Cu(111), with most of the Pt atoms on the terraces and near the step edges of Cu(111).47
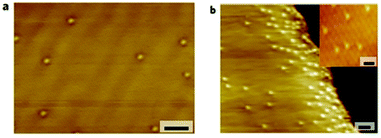 | ||
| Fig. 4 STM and high resolution STM images of Pt1/Cu(111). This figure has been reproduced from ref. 47 with permission from Nature Publishing Group, copyright 2018. | ||
STM could be upgraded into in situ STM by introducing reactants and/or heat into the characterization system. In situ STM allows the direct observation of the SACs structure under the reaction atmosphere. For instance, in situ STM is applied by Sykes et al. to investigate the structure of Pt1/Cu2O in CO oxidation reaction at low temperatures. The experimental and simulated STM images (Fig. 5a and b) demonstrated that CO was adsorbed onto Pt SAs.48
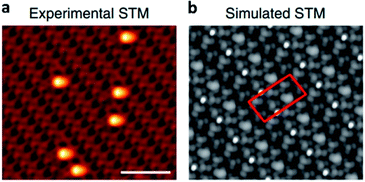 | ||
| Fig. 5 (a) and (b) Experimental and simulated in situ STM images of Pt1/Cu2O in CO oxidation reaction. This figure has been reproduced from ref. 48 with permission from Nature Publishing Group, copyright 2018. | ||
STM has been applied to investigate the singly dispersed atoms on the surface of SACs. STM could be manipulated under many working conditions, including ultra-high vacuum, gaseous atmosphere, and liquid atmosphere, at a temperature range of 0–1273 K.49 The vertical resolution of STM is 0.1 nm. However, it could not be used to recognize the embedded atoms.
2.3 High angle annular dark field scanning transmission electron microscopy
HAADF-STEM is an approach to observe catalyst morphologies. The principle of HAADF-STEM is depicted in Fig. 6. When electrons are accelerated by a high voltage to attack the catalyst surface, different interactions occur between the incident electrons and atoms. Elastically scattered electrons are distributed over wide scattering angles above the catalyst because electrons can not penetrate the catalyst, while non-elastic scattering electrons (transmission electrons) are distributed across small angles. If only electrons of wide range angles are detected, dark-field imaging are obtained.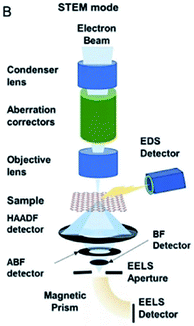 | ||
| Fig. 6 Schematic illustration of HAADF-STEM. This figure has been reproduced from ref. 50 with permission from Wiley-VCH, copyright 2021. | ||
The bright spots in the image always reflect the real atoms. More electrons are diffracted by elements of higher atomic numbers, which then appears brighter in the HADDF-STEM imaging. HADDF-STEM could be utilized to investigate catalyst properties.50
Regarding SACs, if there is a great discrepancy between the atomic number of the singly dispersed atom and support,51–56 singly dispersed atoms could be distinguished by HAADF-STEM. The X-rays produced by electronic attacking of catalyst surface are collected by EDX detector and electrons passing through the catalyst are collected by the EELS detector. Multiple devices are synergistically utilized to explore the atomic states of SAs. The details of EDX and EELS will be minutely described later.
Fe SACs were synthesized by pyrolyzing coordinated polymer strategy. Fig. 7 displayed the dispersion of Fe SAs in Fe-C/Al2O3 catalyst. The HAADF-STEM image straightforwardly demonstrated that Fe existed in the state of SAs. Compared with Fe nanoparticle catalyst, Fe SAC has noteworthy advantages. Fe SAC possesses not only the improved atomic utilization efficiency but also stronger interaction between the active sites Fe and matrix Al2O3. The strong interaction leads to (1) the change of the chemical state of Fe atoms and (2) the enhanced adsorption capacity for reactant gases. In addition, the limited number of configurations between the active sites Fe and reactant gases inhibits the occurrence of side reactions.57
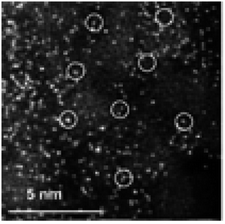 | ||
| Fig. 7 HAADF-STEM image of Fe-C/Al2O3. This figure has been reproduced from ref. 57 with permission from Elsevier, copyright 2021. | ||
In situ HAADF-STEM is an approach to characterize the dispersion state of the active sites and visualize the dynamics of SACs under reaction atmosphere.41,57–63 For instance, Li et al. visualized the transformation of noble metal particles (Pd, Pt, and Au) into singly dispersed atoms at a temperature above 900 °C in an inert atmosphere via in situ HAADF-STEM (Fig. 8a and b are the images for Pt NPs before and after introducing heat and inert atmosphere into the HAADF-STEM chamber).64
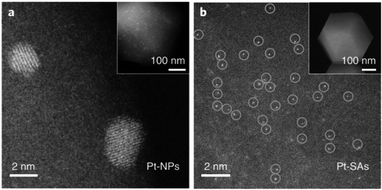 | ||
| Fig. 8 (a) In situ HAADF-STEM image of Pt NPs (short for Pt-NPs in the image) and (b) Pt SACs (short for Pt-SAs in the image). This figure has been reproduced from ref. 64 with permission from Nature Publishing Group, copyright 2018. | ||
HAADF-STEM could directly provide information on the local chemistry of a catalyst at the atomic scale. It is convenient to determine whether SACs have been successfully synthesized or not. However, HAADF-STEM could not provide overall information of SACs, since the images are only limited to the selected areas.
In situ HAADF-STEM could be utilized to characterize the dispersion state of the active sites and visualize the dynamics of SACs under the reaction atmosphere. Due to the operation limitation of HAADF-STEM, only a trace amount of reactant gases is introduced into the operation chamber to mimic the reaction atmosphere and there is still a long way to go to obtain the information under realistic reaction atmosphere.
2.4 Energy dispersive X-ray spectroscopy
Elemental composition on the catalyst surface could be analyzed by EDX. The spatial resolution of EDX depends on the average atomic number of the elements on catalyst, catalyst density and energy of the electronic beam (for example, a 0.2–10 μm resolution could be achieved with ordinary SEM, while a 0.1 nm resolution could be achieved by HAADF). Besides, the superficial area and the focused shape of electronic beam must be contemplated, which also affects the detection resolution.65 In addition to these factors, higher peak to background ratio indicated that SACs could be identified by EDX.In the case that a high-resolution image is needed, the electronic beam of higher energy is required to attack the catalyst surface to generate the X-ray. The inner electrons of different elements are excited by electronic beams to emit characteristic X-rays. The characteristic spectrum can be recorded by the EDX detector. Then the type of elements in the catalyst are determined by the wavelength of the characteristic emitting X-ray and the content of elements are determined by comparing the intensity with the standard elemental spectrum.66 Apart from that, EDX mapping could reflect the spatial distribution of the elements. EDX is used to identify the elements in catalysts and STEM could determine whether they are SAs or not.
Li et al.'s work is a typical example. They adopted EDX mapping analysis and HAADF-STEM to characterize the single dispersion state of Pt on Pt1/Ni(OH)x.67 Defect-rich Ni(OH)x nanoboards was synthesized and fabricated Pt onto Ni(OH)x via a simple wet impregnation method was depicted in Fig. 9a and b. EDX mapping analysis suggested that the Pt species were evenly dispersed on Ni(OH)x (Fig. 9c). HAADF-STEM measurements verified that the Pt species were isolatedly dispersed as single atomic sites (Fig. 9d). The EDX mapping analysis and HAADF-STEM characterization results indicated that Pt atoms were singly dispersed on Ni(OH)x nanoboards.
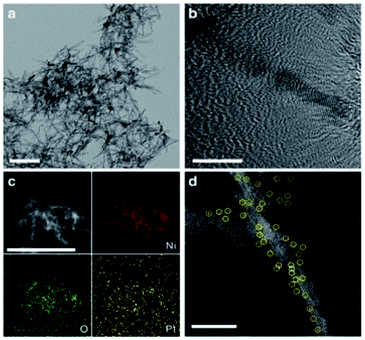 | ||
| Fig. 9 (a) TEM image of Ni(OH)x nanoboards. Scale bar, 50 nm. (b) HRTEM image of a Ni(OH)x nanoboard. Scale bar, 20 nm. (c) EDX mapping analysis of Pt1/Ni(OH)x. Scale bar, 100 nm. (d) HAADF-STEM image of Pt1/Ni(OH)x. The singly dispersed Pt atoms are marked by yellow circles. This figure has been reproduced from ref. 67 with permission from Nature Publishing Group, copyright 2018. | ||
The work of Zhang et al. is another representative example. HAADF-STEM and EDX are utilized to determine the morphology and composition of Ni-MoS2. The results are displayed in Fig. 10. HAADF-STEM image (Fig. 10a) and corresponding element mapping image (Fig. 10b) indicated that Mo (green), S (yellow) and Ni (red) are uniformly distributed on the surface of the catalyst, suggesting Ni was successfully introduced into MoS2 surface. HAADF-STEM image (Fig. 10c) of Ni-MoS2 indicated that single Ni atoms (represented by red circles in Fig. 10d) were dispersed on the MoS2 plane. The red cycles in Fig. 10d represented that the single Ni atoms occupied the position of Mo atoms. In this work, the SACs were studied synergetically via HAADF-STEM and EDX. EDX analysis of the selected region proved that there are only Ni, Mo and O in this region, while HAADF-STEM intuitively demonstrated that MoS2 surface was replaced by other atoms. Therefore, it is fully proved that Ni existed in the form of SAs on MoS2 surface.68
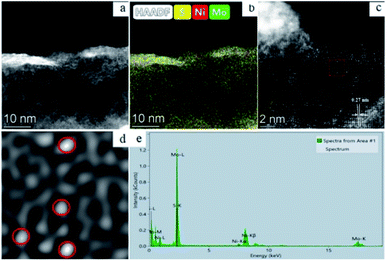 | ||
| Fig. 10 (a) HAADF-STEM of single-atom Ni-doped MoS2; (b) HAADF-STEM image of Ni-MoS2 and corresponding elemental mapping images of Mo, S and Ni; HAADF-STEM image of Ni-MoS2 (c) and magnified domain (d) with red dashed rectangle in (c); (e) EDX spectrum of the Ni-MoS2 sample. This figure has been reproduced from ref. 68 with permission from Elsevier, copyright 2021. | ||
Although EDX could be used to identify SAs, the resolution-limitation directly hinders the detection sensitivity. In order to fully understand the resolution-limitation of SAs in EDX, it is instructive to compare the experimental counting rate with the calculation counting rate under ideal conditions of the first principle.69
| REDX = [n × ò/A] × [ω × GEDX × DEDX] | (1) |
REDX is the X-ray yield per atom per second, n is the beam current that presents the number of electrons per second, ò is the cross-section for the particular atom and shell being studied, A represents the electron beam irradiation area, ω represents the fluorescence yield, GEDX represents the geometrical efficiency accounting for the total angle subtended by the detector and DEDX represents the probability that the X-ray impinging on the detector are detected. The [n × ò/A] presents the ionization number of electrons in the specific shell of the element, which not only represents EDX but also conforms to EELS. The [ω × G × DEDX] presents the signal factor of EDX, which affects the resolution in practical application. The fluorescence yields of C K-shell and Si K-shell were 0.0027 (ref. 70) and 0.047,71 respectively. However, the detection process of elements is affected not only by electron source but also fluorescence detector. The corresponding scaled counting rates measured in some experiments are about 1 count per s per C atom, about 4 counts per s per Si atom, and about 14 counts per s per Pt atom. Due to photon-number uncertainty, the theoretical fluorescence efficiency is nearly twice as low as detected in the actual experiment.69 These statistics indicated that when the atomic number grows, the fluorescence yield increases as well, resulting in the higher EDX response and lower detected deviation, which is why EDX is more suitable to detect atoms with large atomic numbers.
As mentioned in the previous section, EDX could be utilized to identify SACs. However, it suffers from a fundamental drawback. The atomic level of X-ray response makes it impossible to tell whether the target location is SAs or multiple atomic clusters. Thus, EDX is usually installed on the HAADF-STEM instrument for the analysis of SAs. In HAADF-STEM-EDX, the analysis of micromorphology and element on the surface of the catalysts could be carried out simultaneously and SACs could be characterized easily. As a result, EDX has been widely applied for the determination of SACs together with HAADF-STEM.72–74
2.5 Electron energy loss spectroscopy
EELS is utilized to investigate the chemical composition, stoichiometry, energy levels and electronic structure of catalysts.75,76 EELS requires electrons to strike the catalyst surface, so it is conducted on TEM or STEM. A resolution of 0.1 nm could be achieved under the condition of an appropriate electronic source with accelerated voltage and selected appropriate orbital electrons.When a catalyst is irradiated by an electron beam with known kinetic energy, the electron in the beam interacts with atoms to produce inelastically scattered electrons, which loses energy and deflects the paths. The number of detective energy loss electrons on the sample is distributed according to the energy, the spectrum obtained is called the EELS. In the process of analysis, the energy loss of a single atom state is different from that of other chemical states, so the existence of a single atom could be identified.
Liu et al. synthesized a two-dimensional Co3O4 supported La SACs and investigated the structural and chemical of Co3O4 supported singly dispersed La atoms, via EELS with the aberration-corrected STEM.77 HAADF-STEM images (Fig. 11a and b) demonstrated that the self-assembled Co3O4 nanocrystallites with singly dispersed La atoms could be observed. The EELS spectrum (Fig. 11c) revealed the La M4 and La M5 edges from single La atoms. EELS spectrum analysis suggested that La on the surface of La/Co3O4 was different from the reference La cluster. The oxidation state of a single atom existed on the surface of the support, indicating a strong interaction between La and Co3O4.77
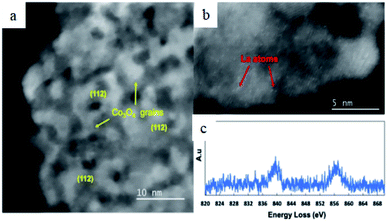 | ||
| Fig. 11 (a) and (b) HAADF-STEM images of La/Co3O4, in which Co3O4 nanocrystallites were marked by yellow arrows and La SAs were marked by red arrows. (c) EELS spectrum of La SAs. This figure has been reproduced from ref. 77 with permission from Cambridge University Press, copyright 2020. | ||
The low voltage transmission electrons are applied by Tizei et al. for microscopic analysis of SAs in their experiments (Fig. 12a), where EELS was simultaneously described. The spatial resolution of 2D EELS maps is mainly limited by the delocalization of inelastic scattering. The result in Fig. 12b demonstrated the delocalization effect caused resolution difference and the spatial distribution of inelastic scattering electrons in different outer orbits of the Ce atom (Fig. 12c). This difference could be quantified from the position where the intensity decreases to 50% in the loss maps. ADF and EELS maps were applied to measure this position (Fig. 12d). The resolution of different orbital electrons measured under the acceleration voltage of 60 keV. Better resolution of the measured atoms could be obtained from higher energy loss, because delocalization of inelastic scattered electrons is reduced. Besides, the resolution obtained at an acceleration voltage of 60 keV was divided into 0.32 (±) 0.02 nm and 0.20 (±) 0.02 nm for the ADF, ΔE = 125 eV and ΔE = 881 eV, respectively.78
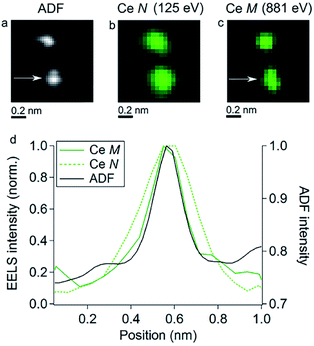 | ||
| Fig. 12 (a–c) ADF (annular dark field) images and chemical maps under two different energy losses (125 eV and 881 eV) with two Ce atoms. The EELS maps have been made close to the threshold energy for the N and M edges of Ce. Note that the spatial resolution in (c) is similar to that in (a). The broadening in (b) happens due to inelastic scattering delocalization. (d) Comparison of the ADF images, Ce N, and Ce M signals at 60 keV, the difference in delocalization at two energy losses is seen. (a–c) have been smoothed. This figure has been reproduced from ref. 78 with permission from Elsevier, copyright 2016. | ||
The influencing factors were explained by eqn (2).78
| de(ΔE) = a/2 × (2E/ΔE)3/4 | (2) |
ΔE represents electron energy loss and E represents the electron primary energy. The theoretical calculation values of 60 keV were de (125 eV) = 0.42 nm and de (881 eV) = 0.10 nm. The measured value of de (125 eV) is significantly less than the theoretical value, which might be impacted by the convergence of electrons and angle collection of the detector. This difference is not explained in their simple calculation.78
The resolution of EDX has been briefly explained in physics by eqn (2). There is a significant difference between EDX and EELS in the detection and collection of the signal, the eqn (1) can be simply changed.
| EEELS = [n ×ò/A] × [GEELS × DEELS] | (3) |
Electrons of energy loss have only a small offset, which make the electron collection efficiency much higher than that of EDX. The transmitted electrons diverge downward and it is easily collected. In eqn (3), the EEELS is the number of electrons with energy loss. GEELS represents the collection efficiency of energy loss electrons (for some atoms of low atomic-numbers, it can reach nearly 100%). DEELS represents the detection probability that the arrival EELS detector is converted into the valid count.69 Compared with the EDX detector, EELS has higher detection efficiency, because the [GEELS × DEELS] value is higher. Consequently, EELS is accompanied by higher detection efficiency in measuring atoms of low atomic-numbers.
EELS could provide the information of the local crystal and electronic structure of the substance. The resolution of EELS is higher than XPS, which could identify micro-regions. EELS is more sensitive than Auger electron spectroscopy (Auger effect involves the energy transfer of multiple electrons and the extreme resolution of Auger electron spectroscopy is 2 nm, which are not suitable for the detection of SACs). In recent years, great progress has been made on the recognition SAs via EELS. EELS is of higher sensitivity for atoms of low atomic-numbers, EDX is more suitable for atoms of high atomic-numbers.
In summary, EELS is not only powerful in the investigation of the electronic structure of the active sites over catalysts, but also of high sensitivity for the distribution of light elements in C to transition metals. In recent years, EELS has been applied to characterize the existence of SAs on catalysts.79–82
2.6 Surface enhanced Raman spectroscopy
SERS has been utilized to investigate SAs on catalysts. As a representative work, in situ SERS was adopted by Wei et al. to identify Pd SACs in the hydrogenation of nitro compounds. The spectral changes in the process of Pd SAs nucleation and the adsorption of reactant gases by SACs were revealed.83Fig. 13a and b displayed the spectral changes of PIC adsorbed on the surface of Pd NPs and Pd SAs. Different existing state leads to different Raman responses. The results in Fig. 13c indicated that PIC could be adsorbed on both Pd SAs and NPs. With the increase of reaction time, Pd gradually aggregated from SAs to form NPs. When the nucleation time was 2.5 min, only the Raman shift at 2129 cm−1 was observed, which was assigned to the adsorption of PIC on Pd SAs. It indicated the existence of Pd SAs. When the nucleation time prolonged to 15 min, the peak at 2028 cm−1 gradually appeared. It suggested the coexistence of Pd NPs and Pd SAs. With the further increase of nucleation time, the intensity of the N![[triple bond, length as m-dash]](https://www.rsc.org/images/entities/char_e002.gif) C–Pd-bridge peak was gradually increased, while the intensity of the N
C–Pd-bridge peak was gradually increased, while the intensity of the N![[triple bond, length as m-dash]](https://www.rsc.org/images/entities/char_e002.gif) C–Pd-atop peak gradually decreased (Fig. 13c). These results demonstrated that Pd was in the state of SAs at the initial time of the synthesis process, but with the increase of reaction time, the Pd SAs gradually grew into NPs. As controlled experiments, catalyst support effects were further studied. It suggested that different types of supports lead to different spectral results. The nucleation of Pd SAs to Pd NPs took longer time on TiO2 than that on Al2O3. The stronger interaction between TiO2 and Pd SAs might inhibit the aggregation of Pd SAs (Fig. 13c and d).83
C–Pd-atop peak gradually decreased (Fig. 13c). These results demonstrated that Pd was in the state of SAs at the initial time of the synthesis process, but with the increase of reaction time, the Pd SAs gradually grew into NPs. As controlled experiments, catalyst support effects were further studied. It suggested that different types of supports lead to different spectral results. The nucleation of Pd SAs to Pd NPs took longer time on TiO2 than that on Al2O3. The stronger interaction between TiO2 and Pd SAs might inhibit the aggregation of Pd SAs (Fig. 13c and d).83
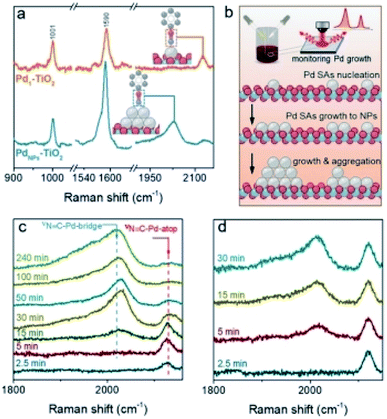 | ||
| Fig. 13 (a) Nanoparticle-enhanced Raman spectroscopy of phenyl isocyanide (PIC) adsorbed on Pd SAs and NPs. (b) The growth of Pd species from SAs to NPs are studied by nanoparticle-enhanced Raman spectroscopy. Nanoparticle-enhanced Raman spectroscopy during the growth of Pd on (c) Au@TiO2 and (d) Au@Al2O3. This figure has been reproduced from ref. 83 with permission from Wiley-VCH, copyright 2021. | ||
In SERS, the Raman shifts of atoms in different chemical states are obviously different, which gives sufficient evidence to prove the existence of SAs. However, the enhanced Raman effect only exists in some specific metals (such as Au, Ag and Cu with nanostructured surfaces).84 Therefore, SERS is not suitable for the study of most SACs.
2.7 Fourier-transform infrared spectroscopy
FTIR usually refers to infrared absorption spectroscopy. The sample is irradiated by infrared light of continuous frequency change. If the frequency of molecular vibration is equal to the frequency of irradiated infrared light, radiation of a specific frequency is absorbed. The absorption of infrared light spectroscopy by molecules leads to the transformation of molecules from the ground state to the excited state. The transmitted intensity of some infrared light corresponding to these absorption regions is weakened. The infrared spectrum is obtained by recording the relationship curve between the percentage transmittance of infrared light and the wavelength.The structure of catalyst molecules could be fully characterized by FTIR. The interaction of the active sites of catalysts and some probe molecules are utilized, such as probe molecule CO. The vibration information between the active site and the probe molecule can be obtained in FTIR spectroscopy. In these cases, the dispersion state of active sites over catalysts could be identified via FTIR, as the singly dispersed atoms typically exhibit different absorption modes of spectroscopy from the NPs. Thus, indirect evidence could be obtained by FTIR analysis about determining the state of active sites whether NPS or SAs.56,85–88
The CO could be linearly bonded on Pt0 sites, bridged adsorbed on two Pt atoms and the interface between Pt clusters and the support. The three different vibrational bands are generated on FTIR spectra, at 2030 cm−1, 1860 cm−1 and 1950 cm−1, respectively.5 The different vibration modes of Pt–CO was utilized by Zhang et al. in situ FTIR to investigate the dispersion state of Pt species over Pt NPs and Pt1/FeOx catalysts. The results in Fig. 14a displayed the three vibration bands that can be observed over Pt NPs catalysts, indicating the coexistence of Pt dimers or clusters together with the segregated Pt atoms. Over Pt1/FeOx SAC, only a weak band at 2080 cm−1 was observed, which was ascribed to CO adsorbed on singly dispersed Ptσ+ (Fig. 14b) and confirmed that all the Pt atoms were singly dispersed over Pt1/FeOx5.
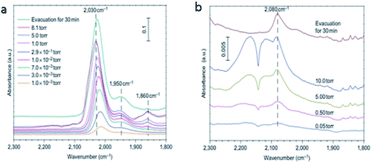 | ||
| Fig. 14 In situ FTIR spectra of (a) Pt NPs catalyst and (b) Pt1/FeOx. This figure has been reproduced from ref. 5 with permission from Nature Publishing Group, copyright 2011. | ||
In situ FTIR was employed to determine the dispersion state of Rh and Pd species. A singly dispersed Rh atom could anchor two CO molecules and exhibits a characteristic vibrational frequency at 2050–2100 cm−1.89,90 A CO molecule linearly adsorbed on a highly dispersed electron-deficient Pd atom shows a band at 2086 cm−1.91,92
In situ FTIR is powerful equipment in determining whether NPs or clusters coexist with the singly dispersed sites over SACs. However, the type of probe molecules available for in situ FTIR characterization limited, which restricts the investigation of the behaviors of SACs via in situ FTIR under some realistic reaction conditions.
2.8 X-ray photoelectron spectroscopy
In XPS operation, a beam of X-ray is used to irradiate a catalyst. The XPS spectra are collected by simultaneously measuring the kinetic energy and the number of escaped electrons. The kinetic energy of the photoelectrons of an X-ray is low, only the electrons from the top 0–10 nm of the catalyst could be analyzed. Thus, XPS is a highly surface sensitive technique. It could provide information on the composition and electronic state of the elements on the surface of a catalyst.29,93 Introducing appropriate reactants and providing suitable reaction temperatures to the XPS chamber, XPS could be upgraded into ambient pressure XPS (AP-XPS), which allows the characterization of catalysts under the reaction atmosphere.42,94,95Over SACs, the singly dispersed atoms are highly unsaturated and interact with support, which makes the structure and electronic state of the SAs different from their metal or metal oxide counterparts. AP-XPS is applicable to study the property of the singly dispersed sites on SACs, given the SAs exist on the surface of catalysts.94–96
Simonovis et al.'s work is a typical example for using AP-XPS to study catalysts under reaction atmosphere, where they investigated the behaviors of the singly dispersed Pt atoms on the surface of Pt/Cu(111) in an ambient pressure of CO.37 Over Pt/Cu(111), there were three types of Pt atoms, free surface Pt, subsurface Pt, and CO-bound surface Pt, respectively. When raising the temperature to 500 °C in an ultrahigh vacuum, the peak assigned to subsurface Pt increased, owing to the diffusion of surface and subsurface Pt atoms during heating. With the increase of CO pressure, the fraction ascribed to CO-bound surface Pt increased, probably because the adsorption of CO could draw Pt atoms out from the bulk, and more surface Pt atoms were available for CO adsorption.37
AP-XPS is powerful in characterizing the electronic state and the evolution behaviors of SACs under the reaction atmosphere. However, the information obtained by AP-XPS characterization could only serve as supporting evidence and complementary techniques are needed to get a firm conclusion. The characterization of this part needs to be carried out in cooperation with other characterization means such as environmental electron microscope (ETEM), in order to explore the dynamic changes of the catalyst surface.
3 Summary and outlooks
The studies on SACs have been bloomed in the past decades. A catalyst of singly dispersed sites generally exhibits high activity in terms of TOF in contrast to a catalyst consisting of continuously packed metal or cation sites. In the case that singly dispersed metal atoms or cations coexist with metal clusters or NPs on an as-prepared catalyst, it definitely impacts negatively on the catalytic performance and a simple assignment of the observed catalytic performance to metal SAs or NPs could be inappropriate. Therefore, a number of techniques have been applied to the characterization of the singly dispersed atoms on SACs, including STM, HAADF-STEM, EDX, EELS, XAS, FTIR, SERS, and XPS. Each of the techniques has merits and limitations, over most of the cases, the combination of these techniques is essential to get an accurate conclusion.In addition, although the reviewed characterization techniques have been used for the identification of single dispersion of the active sites, there is still a lack of techniques that can readily provide quantitative information on the atomic fractions of singly dispersed sites and the co-existence of continuously packed sites. This information is important for elucidating the contribution of the observed catalytic performance of catalysts consisting of both singly dispersed sites and continuously packed sites. The portion of different types of metal existing states could be roughly obtained via TEM characterization, nevertheless, TEM images revealed only a limited portion of a sample and the TEM images obtained depended greatly on the TEM sample preparation method, which can not reflect the accurate fraction of singly dispersed sites. Therefore, developing a technique that could not only distinguish singly dispersed sites from the continuously packed sites but also reveal the exact portion of singly dispersed sites on a catalyst will greatly promote the progress of this research area.
Conflicts of interest
The authors declared no potential conflicts of interest concerning this article's research, authorship, and/or publication.Acknowledgements
This work received financial support from the National Natural Science Foundation of China (21902116), and Liaoning Revitalization Talents Program (XLYC1902070).References
- S. Lu, H. Yang, Z. Zhou, L. Zhong, S. Li, P. Gao and Y. Sun, Chin. J. Catal., 2021, 42, 2038–2048 CrossRef CAS
.
- H. Gong, Z. Xiao, Y. Zhuang, S. Liang, X. Li, W. Zheng, A. Duan, X. Zhang and J. Liu, Fuel, 2021, 302, 121131 CrossRef CAS
.
- S. Somekawa, H. Watanabe, Y. Ono, Y. Oaki and H. Imai, Mater. Lett., 2021, 304, 130609 CrossRef CAS
.
- P. Babaei and J. Safaei-Ghomi, Mater. Chem. Phys., 2021, 267, 124668 CrossRef CAS
.
- B. Qiao, A. Wang, X. Yang, L. F. Allard, Z. Jiang, Y. Cui, J. Liu, J. Li and T. Zhang, Nat. Chem., 2011, 3, 634–641 CrossRef CAS PubMed
.
- N. H. M. D. Dostagir, R. Rattanawan, M. Gao, J. Ota, J.-y. Hasegawa, K. Asakura, A. Fukouka and A. Shrotri, ACS Catal., 2021, 11, 9450–9461 CrossRef CAS
.
- J. Wang, W. Fang, Y. Hu, Y. Zhang, J. Dang, Y. Wu, B. Chen, H. Zhao and Z. Li, Appl. Catal., B, 2021, 298, 120490 CrossRef CAS
.
- W. Chen, Y. Tang, H. Zhang, J. Shi, Z. Wang, Y. Cui, D. Teng, Z. Li and X. Dai, Phys. E, 2022, 135, 114975 CrossRef CAS
.
- Q. Qu, S. Ji, Y. Chen, D. Wang and Y. Li, Chem. Sci., 2021, 12, 4201–4215 RSC
.
- J. C. Matsubu, V. N. Yang and P. Christopher, J. Am. Chem. Soc., 2015, 137, 3076–3084 CrossRef CAS PubMed
.
- L. Liu and A. Corma, Chem. Rev., 2018, 118, 4981–5079 CrossRef CAS PubMed
.
- G. Cha, I. Hwang, S. Hejazi, A. S. Dobrota, I. A. Pašti, B. Osuagwu, H. Kim, J. Will, T. Yokosawa and Z. Badura, Iscience, 2021, 24, 102938 CrossRef PubMed
.
- B. Mei, C. Liu, J. Li, S. Gu, X. Du, S. Lu, F. Song, W. Xu and Z. Jiang, J. Energy Chem., 2022, 64, 1–7 CrossRef
.
- H. Fei, J. Dong, Y. Feng, C. S. Allen, C. Wan, B. Volosskiy, M. Li, Z. Zhao, Y. Wang and H. Sun, Nat. Catal., 2018, 1, 63–72 CrossRef CAS
.
- J. Liu, ACS Catal., 2017, 7, 34–59 CrossRef CAS
.
- S. Sun, G. Zhang, N. Gauquelin, N. Chen, J. Zhou, S. Yang, W. Chen, X. Meng, D. Geng and M. N. Banis, Sci. Rep., 2013, 3, 1–9 Search PubMed
.
- Z. Zuo, S. Liu, Z. Wang, C. Liu, W. Huang, J. Huang and P. Liu, ACS Catal., 2018, 8, 9821–9835 CrossRef CAS
.
- X. P. Zou, L. N. Wang, X. N. Li, Q. Y. Liu, Y. X. Zhao, T. M. Ma and S. G. He, Angew. Chem., 2018, 130, 11155–11159 CrossRef
.
- Z.-Y. Li, Z. Yuan, X.-N. Li, Y.-X. Zhao and S.-G. He, J. Am. Chem. Soc., 2014, 136, 14307–14313 CrossRef CAS PubMed
.
- N. Zhang, C. Ye, H. Yan, L. Li, H. He, D. Wang and Y. Li, Nano Res., 2020, 1–18 Search PubMed
.
- R. Sun, Y. Liao, S.-T. Bai, M. Zheng, C. Zhou, T. Zhang and B. F. Sels, Energy Environ. Sci., 2021, 14, 1247–1285 RSC
.
- Z.-X. Wei, Y.-T. Zhu, J.-Y. Liu, Z.-C. Zhang, W.-P. Hu, H. Xu, Y.-Z. Feng and J.-M. Ma, Rare Met., 2021, 40, 767–789 CrossRef CAS
.
- Y. N. Gong, L. Jiao, Y. Qian, C. Y. Pan, L. Zheng, X. Cai, B. Liu, S. H. Yu and H. L. Jiang, Angew. Chem., 2020, 132, 2727–2731 CrossRef
.
- H. Jeong, S. Shin and H. Lee, ACS Nano, 2020, 14, 14355–14374 CrossRef PubMed
.
- H. Jeong, O. Kwon, B.-S. Kim, J. Bae, S. Shin, H.-E. Kim, J. Kim and H. Lee, Nat. Catal., 2020, 3, 368–375 CrossRef CAS
.
- A. M. Gabelnick, A. T. Capitano, S. M. Kane, J. L. Gland and D. A. Fischer, J. Am. Chem. Soc., 2000, 122, 143–149 CrossRef CAS
.
- M. Chia, Y. J. Pagán-Torres, D. Hibbitts, Q. Tan, H. N. Pham, A. K. Datye, M. Neurock, R. J. Davis and J. A. Dumesic, J. Am. Chem. Soc., 2011, 133, 12675–12689 CrossRef CAS PubMed
.
- Q. Liu and Z. Zhang, Catal. Sci. Technol., 2019, 9, 4821–4834 RSC
.
- Y. Chen, L. Zou, H. Liu, C. Chen, Q. Wang, M. Gu, B. Yang, Z. Zou, J. Fang and H. Yang, J. Phys. Chem. C, 2019, 123, 16651–16659 CrossRef CAS
.
- X. Liang, Z. Li, H. Xiao, T. Zhang, P. Xu, H. Zhang, Q. Gao and L. Zheng, Chem. Mater., 2021, 33, 5542–5554 CrossRef CAS
.
- R. W. Mitchell, D. C. Lloyd, L. G. A. van de Water, P. R. Ellis, K. A. Metcalfe, C. Sibbald, L. H. Davies, D. I. Enache, G. J. Kelly, E. D. Boyes and P. L. Gai, ACS Catal., 2018, 8, 8816–8829 CrossRef CAS
.
- C. Li, Z. Chen, H. Yi, Y. Cao, L. Du, Y. Hu, F. Kong, R. Kramer Campen, Y. Gao and C. Du, Angew. Chem., 2020, 132, 16036–16041 CrossRef
.
- J. Amsler, B. B. Sarma, G. Agostini, G. Prieto, P. N. Plessow and F. Studt, J. Am. Chem. Soc., 2020, 142, 5087–5096 CrossRef CAS PubMed
.
- Y. Li and A. I. Frenkel, Acc. Chem. Res., 2021, 8738–8748 Search PubMed
.
- Z. Chen, Q. Zhang, W. Chen, J. Dong, H. Yao, X. Zhang, X. Tong, D. Wang, Q. Peng and C. Chen, Adv. Mater., 2018, 30, 1704720 CrossRef PubMed
.
- T. Zhang, X. Nie, W. Yu, X. Guo, C. Song, R. Si, Y. Liu and Z. Zhao, iScience, 2019, 22, 97–108 CrossRef CAS PubMed
.
- J. P. Simonovis, A. Hunt, R. M. Palomino, S. D. Senanayake and I. Waluyo, J. Phys. Chem. C, 2018, 122, 4488–4495 CrossRef CAS
.
- L. L. Cao, Q. Q. Luo, W. Liu, Y. K. Lin, X. K. Liu, Y. J. Cao, W. Zhang, Y. Wu, J. L. Yang, T. Yao and S. Q. Wei, Nat. Catal., 2019, 2, 134–141 CrossRef CAS
.
- A. Bafaqeer, M. Tahir and N. A. S. Amin, Appl. Surf. Sci., 2018, 435, 953–962 CrossRef CAS
.
- I. Abbas, H. Kim, C.-H. Shin, S. Yoon and K.-D. Jung, Appl. Catal., B, 2019, 258, 117971 CrossRef CAS
.
- X. Feng, Z. Song, Y. Liu, X. Chen, X. Jin, W. Yan, C. Yang, J. Luo, X. Zhou and D. Chen, ACS Catal., 2018, 8, 10649–10657 CrossRef CAS
.
- M. Cai, Z. Wu, Z. Li, L. Wang, W. Sun, A. A. Tountas, C. Li, S. Wang, K. Feng, A.-B. Xu, S. Tang, A. Tavasoli, M. Peng, W. Liu, A. S. Helmy, L. He, G. A. Ozin and X. Zhang, Nat. Energy, 2021, 6, 807–814 CrossRef CAS
.
- F. Kraushofer, N. Resch, M. Eder, A. Rafsanjani-Abbasi, S. Tobisch, Z. Jakub, G. Franceschi, M. Riva, M. Meier, M. Schmid, U. Diebold and G. S. Parkinson, Adv. Mater. Interfaces, 2021, 8, 2001908 CrossRef CAS
.
- A. Mellor, A. Wilson, C. L. Pang, C. M. Yim, F. Maccherozzi, S. S. Dhesi, C. A. Muryn, H. Idriss and G. Thornton, J. Chem. Phys., 2020, 152, 024709 CrossRef CAS PubMed
.
- D. A. Patel, R. T. Hannagan, P. L. Kress, A. C. Schilling, V. Çınar and E. C. H. Sykes, J. Phys. Chem. C, 2019, 123, 28142–28147 CrossRef CAS
.
- H. Sawano, T. Gokan, H. Yoshioka and H. Shinno, Precis. Eng., 2012, 36, 538–545 CrossRef
.
- M. D. Marcinkowski, M. T. Darby, J. Liu, J. M. Wimble, F. R. Lucci, S. Lee, A. Michaelides, M. Flytzani-Stephanopoulos, M. Stamatakis and E. C. H. Sykes, Nat. Chem., 2018, 10, 325–332 CrossRef CAS PubMed
.
- A. J. Therrien, A. J. Hensley, M. D. Marcinkowski, R. Zhang, F. R. Lucci, B. Coughlin, A. C. Schilling, J.-S. McEwen and E. C. H. Sykes, Nat. Catal., 2018, 1, 192–198 CrossRef CAS
.
- G. Binnig and H. Rohrer, Angew. Chem., Int. Ed. Engl., 1987, 26, 606–614 CrossRef
.
- P. Tieu, X. Yan, M. Xu, P. Christopher and X. Pan, Small, 2021, 17, e2006482 CrossRef PubMed
.
- M. Bar-Sadan, J. Barthel, H. Shtrikman and L. Houben, Nano Lett., 2012, 12, 2352–2356 CrossRef CAS PubMed
.
- D. A. Bulushev, M. Zacharska, A. S. Lisitsyn, O. Y. Podyacheva, F. S. Hage, Q. M. Ramasse, U. Bangert and L. G. Bulusheva, ACS Catal., 2016, 6, 3442–3451 CrossRef CAS
.
- D. A. Bulushev, M. Zacharska, E. V. Shlyakhova, A. L. Chuvilin, Y. N. Guo, S. Beloshapkin, A. V. Okotrub and L. G. Bulusheva, ACS Catal., 2016, 6, 681–691 CrossRef CAS
.
- S. Yang, Y. J. Tak, J. Kim, A. Soon and H. Lee, ACS Catal., 2017, 7, 1301–1307 CrossRef CAS
.
- F. Yang, Z. Liu, X. Liu, A. Feng, B. Zhang, W. Yang and Y. Li, Green Chem., 2021, 23, 1026–1035 RSC
.
- J.-q. Bai, M. Tamura, A. Nakayama, Y. Nakagawa and K. Tomishige, ACS Catal., 2021, 11, 3293–3309 CrossRef CAS
.
- F. Wang, H. Chen, X. Sun, C. Wang, Y. Ma, X. Song, K. Li, P. Ning and H. He, Sep. Purif. Technol., 2021, 258, 118086 CrossRef CAS
.
- Z. Bo, N. E. Thornburg, L. Peng, J. J. Gutierrez Moreno, M. Nolan, L. D. Marks and J. M. Notestein, Nano Lett., 2019, 19, 8103–8108 CrossRef CAS PubMed
.
- L. Chen, K. Xing, Q. Shentu, Y. Huang, W. Lv and Y. Yao, Chemosphere, 2021, 130911 CrossRef CAS PubMed
.
- S. Duan, R. Wang and J. Liu, Nanotechnology, 2018, 29, 204002 CrossRef PubMed
.
- S. Hejazi, S. Mohajernia, B. Osuagwu, G. Zoppellaro, P. Andryskova, O. Tomanec, S. Kment, R. Zbořil and P. Schmuki, Adv. Mater., 2020, 32, 1908505 CrossRef CAS PubMed
.
- X. H. Jiang, L. S. Zhang, H. Y. Liu, D. S. Wu, F. Y. Wu, L. Tian, L. L. Liu, J. P. Zou, S. L. Luo and B. B. Chen, Angew. Chem., Int. Ed., 2020, 59, 23112–23116 CrossRef CAS PubMed
.
- J. Mo, S. Wu, T. Lau, R. Kato, K. Suenaga, T.-S. Wu, Y.-L. Soo, J. Foord and S. Tsang, Mater. Today Adv., 2020, 6, 100020 CrossRef
.
- S. Wei, A. Li, J.-C. Liu, Z. Li, W. Chen, Y. Gong, Q. Zhang, W.-C. Cheong, Y. Wang and L. Zheng, Nat. Nanotechnol., 2018, 13, 856–861 CrossRef CAS PubMed
.
- T. Paulauskas, V. Pacebutas, R. Butkute, B. Cechavicius, A. Naujokaitis, M. Kamarauskas, M. Skapas, J. Devenson, M. Caplovicova, V. Vretenar, X. Li, M. Kociak and A. Krotkus, Nanoscale Res. Lett., 2020, 15, 121 CrossRef CAS PubMed
.
- R. Egerton and M. Watanabe, Ultramicroscopy, 2018, 193, 111–117 CrossRef CAS PubMed
.
- J. Zhang, X. Wu, W. C. Cheong, W. Chen, R. Lin, J. Li, L. Zheng, W. Yan, L. Gu and C. Chen, Nat. Commun., 2018, 9, 1002 CrossRef PubMed
.
- X. Zhang, W. X. Liu, Y. W. Zhou, Z. D. Meng, L. Luo and S. Q. Liu, J. Electroanal. Chem., 2021, 1572–6657 Search PubMed
.
- T. C. Lovejoy, Q. M. Ramasse, M. Falke, A. Kaeppel, R. Terborg, R. Zan, N. Dellby and O. L. Krivanek, Appl. Phys. Lett., 2012, 100, 154101 CrossRef
.
- X. Long, M. Liu, F. Ho and X. Peng, At. Data Nucl. Data Tables, 1990, 45, 353–366 CrossRef CAS
.
- G. Brunner, J. Phys. B: At. Mol. Phys., 1987, 20, 4983 CrossRef CAS
.
- W. He, A. Hu, L. Qiu, W. Wang, Y. Xiang, W. Han, G. Xu, L. Zhang and A. Zheng, Catalysts, 2019, 9, 810 CrossRef CAS
.
- L. Han and H. Xin, Microsc. Microanal., 2020, 26, 2794–2796 CrossRef
.
- D. Bajec, A. Kostyniuk, A. Pohar and B. Likozar, Chem. Eng. J., 2020, 396, 125182 CrossRef CAS
.
- D. M. Koshy, A. T. Landers, D. A. Cullen, A. V. Ievlev, H. M. Meyer III, C. Hahn, Z. Bao and T. F. Jaramillo, Adv. Energy Mater., 2020, 10, 2001836 CrossRef CAS
.
- Y. Piao, Q. Jiang, H. Li, H. Matsumoto, J. Liang, W. Liu, C. Pham-Huu, Y. Liu and F. Wang, ACS Catal., 2020, 10, 7894–7906 CrossRef CAS
.
- J. Xu, Y. Wang, D. Wang and J. Liu, Microsc. Microanal., 2020, 26, 1762–1763 CrossRef
.
- L. H. G. Tizei, Y. Iizumi, T. Okazaki, R. Nakanishi, R. Kitaura, H. Shinohara and K. Suenaga, Ultramicroscopy, 2016, 160, 239–246 CrossRef CAS PubMed
.
- A. Gloter, V. Badjeck, L. Bocher, N. Brun, K. March, M. Marinova, M. Tence, M. Walls, A. Zobelli, O. Stephan and C. Colliex, Mater. Sci. Semicond. Process., 2017, 65, 2–17 CrossRef CAS
.
- X. Jia, L. Xu, L. Xianchun and L. Jingyue, Microsc. Microanal., 2020, 26, 728–730 CrossRef
.
- X. Jia, W. Yang, W. Dongyao and L. Jingyue, Microsc. Microanal., 2020, 26, 1762–1763 CrossRef
.
- P. Xiaoqing, Y. Xingxu, D. Sheng, X. Mingjie and G. Graham, Microsc. Microanal., 2020, 26, 2468–2469 CrossRef
.
- J. Wei, S. N. Qin, J. Yang, H. L. Ya, W. H. Huang, H. Zhang, B. J. Hwang, Z. Q. Tian and J. F. Li, Angew. Chem., 2021, 133, 9392–9396 CrossRef
.
- M. J. Banholzer, J. E. Millstone, L. Qin and C. A. Mirkin, Chem. Soc. Rev., 2008, 37, 885–897 RSC
.
- S. Niu, J. Yang, H. Qi, Y. Su, Z. Wang, J. Qiu, A. Wang and T. Zhang, J. Energy Chem., 2021, 57, 371–377 CrossRef
.
- J. Resasco and P. Christopher, J. Phys. Chem. Lett., 2020, 11, 10114–10123 CrossRef CAS
.
- N. H. M. Dostagir, R. Rattanawan, M. Gao, J. Ota, J.-y. Hasegawa, K. Asakura, A. Fukouka and A. Shrotri, ACS Catal., 2021, 11, 9450–9461 CrossRef CAS
.
- B. B. Sarma, P. N. Plessow, G. Agostini, P. Concepción, N. Pfänder, L. Kang, F. R. Wang, F. Studt and G. Prieto, J. Am. Chem. Soc., 2020, 142, 14890–14902 CrossRef CAS PubMed
.
- F. Basile, I. Bersani, P. D. Gallo, S. Fiorilli, G. Fornasari, D. Gary, R. Mortera, B. Onida and A. Vaccari, Int. J. Spectrosc., 2011, 2011, 1–8 CrossRef
.
- G. Q. Lu, S. G. Sun, L. R. Cai, S. P. Chen, Z. W. Tian and K. K. Shiu, Langmuir, 2000, 16, 778–786 CrossRef CAS
.
- G. X. Pei, X. Y. Liu, A. Wang, A. F. Lee, M. A. Isaacs, L. Li, X. Pan, X. Yang, X. Wang, Z. Tai, K. Wilson and T. Zhang, ACS Catal., 2015, 5, 3717–3725 CrossRef CAS
.
- G. Spezzati, Y. Su, J. P. Hofmann, A. D. Benavidez, A. T. DeLaRiva, J. McCabe, A. K. Datye and E. J. M. Hensen, ACS Catal., 2017, 7, 6887–6891 CrossRef CAS PubMed
.
- J. Y. Jung, Y. L. Hong, J.-G. Kim, M. J. Kim, Y.-K. Kim and N. D. Kim, Appl. Surf. Sci., 2021, 563, 150254 CrossRef CAS
.
- A. C. Schilling, K. Groden, J. P. Simonovis, A. Hunt, R. T. Hannagan, V. Çınar, J.-S. McEwen, E. C. H. Sykes and I. Waluyo, ACS Catal., 2020, 10, 4215–4226 CrossRef CAS
.
- A. Bruix, H. G. Füchtbauer, A. K. Tuxen, A. S. Walton, M. Andersen, S. Porsgaard, F. Besenbacher, B. Hammer and J. V. Lauritsen, ACS Nano, 2015, 9, 9322–9330 CrossRef CAS PubMed
.
- J. Lin, A. Wang, B. Qiao, X. Liu, X. Yang, X. Wang, J. Liang, J. Li, J. Liu and T. Zhang, J. Am. Chem. Soc., 2013, 135, 15314–15317 CrossRef CAS PubMed
.
Footnote |
| † Ping Qi and Jian Wang contributed equally to this manuscript. |
| This journal is © The Royal Society of Chemistry 2022 |


