
 Open Access Article
 This Open Access Article is licensed under a Creative Commons Attribution-Non Commercial 3.0 Unported Licence
The effect of oxygen impurities on the stability and structural properties of vacancy-ordered and -disordered ZrCx†
Theresa Davey * and
Ying Chen
* and
Ying Chen
School of Engineering, Tohoku University, Sendai, 980-8579, Japan. E-mail: theresa@tohoku.ac.jp
First published on 25th January 2022
Abstract
Theoretical calculations predict several long-range ordered sub-stoichiometric zirconium carbide phases to be stable at low temperature, rather than a random (disordered solution) distribution of vacancies. However, experimental synthesis of vacancy-ordered phases is extremely challenging and not all predicted phases have been experimentally observed. It has been hypothesised that the inevitable oxygen contamination in experimental samples may affect the vacancy ordering. In this work, the stability and structural properties of the vacancy-ordered and vacancy-disordered phases are investigated as a function of oxygen defect concentration using first-principles calculations. The observed trends are explained in terms of changes to the local bonding in the presence of varying amounts of oxygen and vacancies. It is found that the relative stability of the ordered phases (compared to the disordered phase at the same composition) decreases as oxygen concentration increases, and some vacancy-ordered phases are destabilised by the level of oxygen impurities found in experimental samples. This suggests that oxygen contamination is a contributing factor to the challenge of synthesising ordered zirconium carbides, and gives insight that may assist fabrication in the future. The volume of all ZrCx (x ≤ 1) phases was found to decrease with increasing oxygen concentration, which can be attributed to the different ionocovalent nature of the C–Zr and O–Zr bonds. The volume of the vacancy-ordered phases within the expected oxygen solubility limit is greater than the disordered phase of the same composition, which is explained in terms of the relative bond strengths surrounding different vacancy distributions.
1. Introduction
The carbon–zirconium system has been widely investigated for over 150 years,1 but there are still many unanswered questions about the single intermediate phase, ZrCx (x ≤ 1), which is widely used in nuclear and aerospace industries because of its extremely high melting point (∼3700 K) and strength at high temperatures.2 Zirconium monocarbide has a rocksalt structure with zirconium atoms forming a cubic lattice and carbon atoms occupying the octahedral interstitial sites. ZrCx has a wide range of stoichiometry, with vacancies on up to ∼50% of the carbon sites.3,4 The mechanical and thermodynamic properties of ZrCx are strongly dependent on the stoichiometry and structural ordering,5 but much is unknown about the character of the vacancy ordering.Historically, ZrCx has been generally treated as a continuous solid solution phase where it is assumed that the vacancies are randomly distributed on the carbon sites.3 Various vacancy-ordered phases have been intermittently reported in the experimental literature but there is no consensus regarding phase stability. Goretzki observed a Zr2C superlattice,6 Obata and Nakazawa unsuccessfully attempted to fabricate Zr2C, but observed Zr4C3,7 de Novion and Maurice reported the Zr2C phase,8 Karimov et al. reported Zr2C,9 Khaenko et al. reported possible trigonal Zr8C5,10 Hu et al. observed Zr2C superstructures,11 Wei et al. reported Zr2C,12 Zhou et al. fabricated Zr2C,13 and Rana et al. reported possible systematic vacancy ordering.4 Theoretical calculations confirm that long-range superstructural ordering of vacancies is expected at low temperature. A theoretical phase diagram from Gusev and Rempel14 determined by the Order Parameter Functional (OPF) method predicted the stability of several ordered zirconium carbide subphases below 1200 K. Zhang et al.15,16 used the Cluster Expansion (CE) method, and Yu et al.17 and Xie et al.18 used the USPEX evolutionary algorithm, to obtain the theoretical convex hull of stable phases at 0 K. All predicted several ordered subphases that are stable compared to the vacancy-disordered phase, but disagreeing upon which phases are stable. In recent work, Davey et al.19 considered the most stable reported structures and clarified the sub-stoichiometric ordered phases at 0 K to be Zr7C6 (R![[3 with combining macron]](https://www.rsc.org/images/entities/char_0033_0304.gif) ), Zr4C3 (C2/c), Zr3C2 (Fddd), and Zr2C (Fdm).
), Zr4C3 (C2/c), Zr3C2 (Fddd), and Zr2C (Fdm).
De Novion and Maurice8 first proposed that the long-range ordering of carbon vacancies was driven by short-range preferences for the arrangement of vacancies, which was confirmed by Razumovskiy et al.,20,21 and Zhang et al.,15 who demonstrated that there was a preference for vacancy pairs to be at third nearest neighbour distances, and that in all stable ordered phases vacancy pairs avoid the second nearest neighbour separation completely. By examining the local electronic, bonding, and structural properties, Davey et al.19 demonstrated that this preference arises from the differing local distortions and electron redistributions based on the local geometry of the rocksalt lattice.
There are several possible reasons why the predicted low-temperature vacancy-ordered phases are not often observed experimentally. During the various fabrication methods for ZrCx, the sample is heated to around 2000 K,22 which would likely cause disordering of any vacancies.5,14 During cooling, this disordered phase may be quenched into the sample.5
Furthermore, ultra-high temperature carbides such as ZrCx are notoriously difficult to fabricate and characterise in terms of impurities.22 ZrCx samples are likely to have Hf, O, and N impurities which may affect the properties and stability.22 Samples synthesised by Jackson et al.23,24 show that the most significant impurity is O, at up to 3.3 wt% (in a sample with target C content of 7.3 wt%), or ∼11 at%.25 Depending on the experimental conditions, oxygen may exist as dissolved oxygen defects, or as ZrO2 on the surface.22 The oxidation pathway from ZrC (cubic Zr with C occupying the octahedral interstitial sites) to ZrO2 (cubic Zr with O occupying the tetrahedral interstitial sites) is not fully understood,26 but several studies have attempted to characterise the structure of zirconium oxycarbide at low oxygen concentration.27–30 However, the crystallographic locations of the O atoms are challenging to characterise as light atoms such as C and O can often be difficult to distinguish experimentally using X-ray diffraction,22,29 which has limited the characterisation of most experimental investigations on the properties of ZrCx.
As the vacancy-ordered phases are so rarely observed, there are not any experimental studies investigating their properties as a function of oxygen defect concentration. However, the high temperature C–O–Zr phase diagram (1650–2000 °C) has been developed by Réjasse et al.30 based on experimental investigations and literature analysis. Réjasse et al. fabricated samples with varying oxygen and carbon stoichiometries with very low vacancy concentration, and report oxygen preferentially occupying vacant octahedral interstitial sites, but also substituting carbon atoms in ZrCx.30 In their work they determined the limit of oxygen solubility in low-vacancy zirconium carbide as substitutional defects on around 17–20% of the C sites, which is consistent with findings by Sarkar et al.27 Such high levels of oxygen impurity are known to affect the crystallographic, thermodynamic, and mechanical properties of ZrCx,25 and may also affect the vacancy-ordering behaviour.
Other experimental investigations into the solubility of O in ZrCx are from Kosolapova et al.,31 Ouensanga et al.,32 Barnier and Thévenot,28 and Gendre et al.,33 who report conflicting results obtained at various temperatures using a variety of fabrication methods. Considering all available data, Réjasse et al. presented a phase diagram predicting increasing solubility of oxygen with increasing vacancy concentration in solid solution ZrCx.30 Réjasse et al. also noted that most authors investigating zirconium oxycarbides note significant changes to the lattice parameter as a function of oxygen content, which they attribute to the covalent radius of oxygen being lower than that of carbon.30 From a theoretical standpoint, Xie et al.18 used first-principles calculations investigate the effect of nitrogen and oxygen impurities on the mechanical properties of the vacancy-ordered zirconium carbides, but did not consider the stability or structural effects in any detail.
In earlier work, first-principles calculations were used to examine the stability of vacancy-ordered and -disordered phases in pure zirconium carbide at 0 K from the perspective of local distortions, bonding, and electronic properties.19 This study further investigates the effect of oxygen impurities on the stability of these phases, also at 0 K. Oxygen defects are introduced at various concentrations to consider the relative stability and volume of the ordered phases compared to the disordered solution phase as a function of oxygen impurity level. Local properties are examined to determine how the presence of oxygen defects affects the local properties that drive vacancy ordering in zirconium carbides.
2. Calculation method and models
2.1 First principles calculations
The ground state energy at 0 K was determined via non-spin-polarised density functional theory (DFT) calculations in the same procedure as Davey et al.,19 using the Projector Augmented Wave (PAW) method34,35 in the GPU implementation36,37 of the Vienna Ab initio Software Package (VASP).38–40 The cutoff energy and k-point Monkhorst–Pack mesh41 density were chosen as 700 eV and at least 15![[thin space (1/6-em)]](https://www.rsc.org/images/entities/char_2009.gif) 000 k-points per supercell to ensure good convergence of all energy calculations. All vacancy-ordered structures were fully (ionic and volume) relaxed until all force components were smaller than 0.001 meV Å−1.
000 k-points per supercell to ensure good convergence of all energy calculations. All vacancy-ordered structures were fully (ionic and volume) relaxed until all force components were smaller than 0.001 meV Å−1.
In earlier finite temperature anharmonic calculations of the thermodynamic properties of zirconium carbide, Duff et al.42 found an unphysical divergence of the calculated heat capacity at high temperature within the Generalized Gradient Approximation (GGA)43,44 results, which was not present within the LDA results. Consequently, Duff et al. adopted the LDA for most calculations as they provided better consistency with experimentally determined properties at high temperatures. Mellan et al.45 later chose the LDA over the GGA for performing finite temperature anharmonic calculations of defective zirconium carbide. Following these studies, Davey et al. chose the LDA for previous calculations of various defective structures of zirconium carbide19 for consistency, but performed calculations of defective structures within the LDA and GGA for benchmarking to confirm that the same trend was reproduced by both approximations at 0 K. Therefore, in this work, calculations were performed using only the Local Density Approximation (LDA)46 for the exchange and correlation functionals as it has been demonstrated to be suitable for calculations of zirconium carbides.
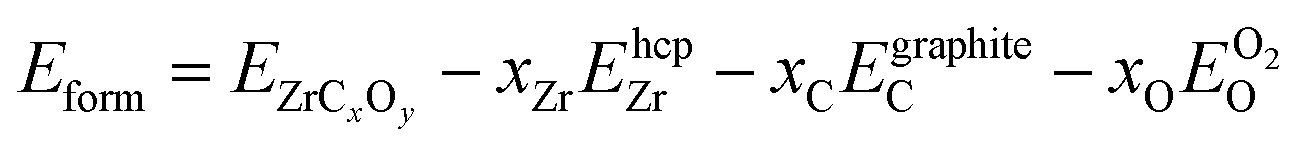
The formation energy (enthalpy) with respect to the pure elements (hcp Zr, graphite C, and gas O2) at 0 K is defined as
 are the energies per atom of pure Zr, C, and O in their ground state structures (hcp, graphite, and dimer O2 respectively). As calculations of graphite C lack accuracy using conventional pseudopotentials due to the interlayer van der Waals forces,47 the energy was obtained by calculating the energy of diamond C and adjusting by the experimentally determined energy difference of 27 meV per atom,48 as done by Mellan et al.45 and Davey et al.19
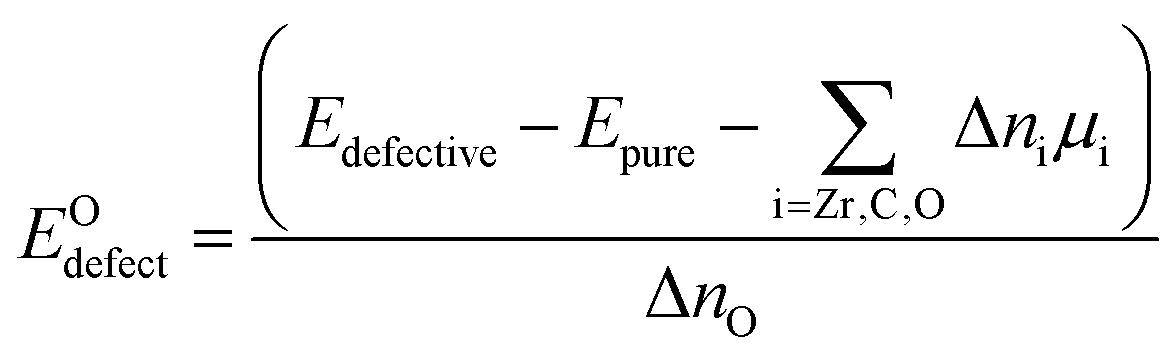
The oxygen defect formation energy (per defect) is defined as
As the long-range ordering of vacancies in zirconium carbide is driven by short-range effects, the local bonding can provide insights regarding the stability and properties of long-range ordered phases. The Crystal Orbital Hamiltonian Population (COHP)49 of each bond was used to examine the strength of the individual bonds between atomic pairs, using the Local Orbital Basis Suite Towards Electronic-Structure Reconstruction (LOBSTER) analysis software.50–52 The VASP38–40 output is used directly53 to obtain the projected COHP from the plane-wave basis sets used in the DFT calculation. The value of the integrated projected COHP (IpCOHP) up to the Fermi level scales with the bond order54 and therefore is used to analyse the relative strength of each pair bond in a particular structure.50 Each X–Y bond (X, Y = C, Zr, O) at first and second nearest neighbour distance (defined with reference to stoichiometric zirconium carbide) in all structures was examined considering the individual and average IpCOHP values using the same procedure as Davey et al.19 This provides a quantitative understanding of the stability and structural trends from a local bonding perspective. The absolute charge spilling in each COHP projection was reduced as much as possible,51 and was below 1.5% for all structures.
The charge density distribution was calculated using VASP and visualised using VESTA.55 The changes to the charge density when oxygen defects are present were calculated by considering defective unrelaxed structures based on the pristine ZrC lattice. The unrelaxed structure distributions were compared with the relaxed structure distributions to confirm compatibility.
The electron localisation function (ELF) represents the probability of finding an electron close to another reference electron at a certain point with the same spin.56–58 The ELF can provide detailed bonding information via the electron pair distribution and quantitatively characterise electron interactions.59 The ELF has values between 0 and 1, where 0 indicates fully delocalised electrons (metallic bonding), 1 indicates fully localised electrons (covalent bonding), and 0.5 is equivalent to a free electron gas.56 The ELF distribution was calculated using VASP and analysed using VESTA.
2.2 Crystal structures
The theoretically predicted stable crystal structures for the vacancy-ordered superstructural phases reported Davey et al.19 are given in Table 1 and shown in Fig. 1. These phases are consistent with the few experimental observations listed above. The positions of the vacancy sites and tetrahedral interstitial sites are also indicated.| Phase | Space group | Space group number | Lattice constants (Å) | Element/site | Wyckoff site | Site coordinates | ||
|---|---|---|---|---|---|---|---|---|
| x | y | z | ||||||
| ZrC | Fmm |
225 | a = 4.64508 | Zr | 4a | 0 | 0 | 0 |
| C | 4b | 0.5 | 0 | 0 | ||||
| Tet | 8c | 0.25 | 0.75 | 0.75 | ||||
| Zr7C6 | R |
148 | a = 8.68908 | Zr | 3b | 0 | 0 | 0.5 |
| 18f | 0.75508 | 0.8004 | 0.17412 | |||||
| C | 18f | 0.57421 | 0.86037 | 0.00093 | ||||
| c = 8.08105 | Va | 3a | 0.33333 | 0.66667 | 0.66667 | |||
| Tet | 18f | 0.57631 | 0.86667 | 0.25 | ||||
| 18f | 0.52149 | 0.625 | 0.58333 | |||||
| 6c | 0.33333 | 0.66667 | 0.41667 | |||||
| Zr4C3 | C2/c | 15 | a = 6.55985 | Zr | 8f | 0.24388 | 0.1921 | 0.24949 |
| 8f | 0.23423 | 0.0665 | 0.72964 | |||||
| b = 13.16493 | C | 4e | 0 | 0.18418 | 0.75 | |||
| 4e | 0 | 0.93793 | 0.75 | |||||
| 4e | 0 | 0.68723 | 0.75 | |||||
| c = 5.69834 | Va | 4e | 0 | 0.56415 | 0.25 | |||
| β = 125.2076 | Tet | 8f | 0.375 | 0.5644 | 0.5 | |||
| 8f | 0.625 | 0.19095 | 0.5 | |||||
| 8f | 0.375 | 0.31328 | 0.5 | |||||
| 8f | 0.875 | 0.56116 | 0.5 | |||||
| Zr3C2 | Fddd | 70 | a = 6.55014 | Zr | 32h | 0.50627 | 0.24144 | 0.08046 |
| 16e | 0.25943 | 0 | 0 | |||||
| b = 9.32001 | C | 16g | 0.5 | 0.5 | 0.41744 | |||
| 16g | 0.5 | 0.5 | 0.25033 | |||||
| c = 19.69019 | Va | 16g | 0.25 | 0.75 | 0.66667 | |||
| Tet | 32h | 0.5 | 0.375 | 0.16667 | ||||
| 32h | 0.75 | 0.125 | 0.08333 | |||||
| 16f | 0.5 | 0.375 | 0.5 | |||||
| 16f | 0.5 | 0.875 | 0.5 | |||||
| Zr2C | Fdm |
227 | a = 9.27273 | Zr | 32e | 0.13103 | 0.36897 | 0.13103 |
| C | 16d | 0.875 | 0.875 | 0.125 | ||||
| Va | 16c | 0.375 | 0.375 | 0.625 | ||||
| Tet | 8a | 0.25 | 0.25 | 0.25 | ||||
| 8a | 0.25 | 0.25 | 0.75 | |||||
| 48f | 0.5 | 0.5 | 0.25 | |||||
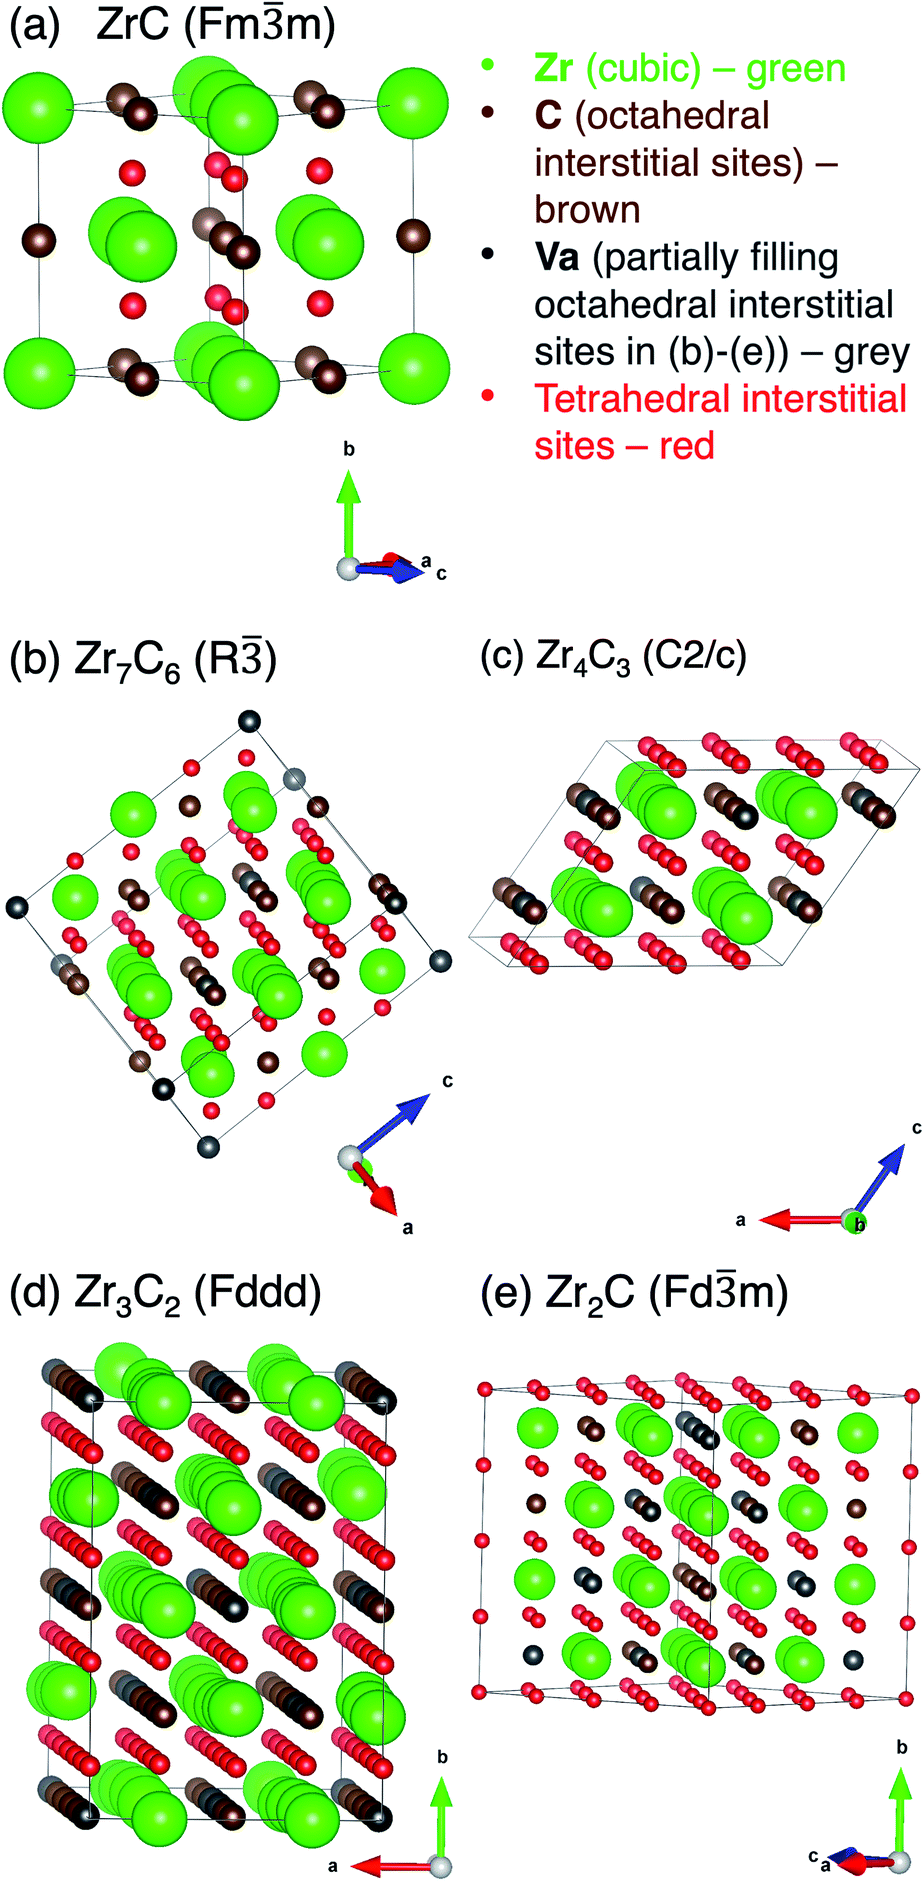 | ||
| Fig. 1 Unit cells for each of the ordered phases in Table 1, with all possible sites for O defects marked. (a) ZrC, (b) Zr7C6, (c) Zr4C3, (d) Zr3C2, (e) Zr2C. | ||
Various types of oxygen defects were considered to determine the most stable defect configuration. Supercells were constructed at approximately the same oxygen concentration for each ordered phase with a single oxygen atom per supercell in the following sites. (i) A substitutional defect on the Zr lattice; (ii) a substitutional defect on a C site; (iii) an octahedral interstitial defect in a C vacancy site; (iv) an interstitial defect in a tetrahedral interstitial site. The atomic coordinates of each position are given in Table 1. Defective structures were constructed considering all possible Wyckoff sites to determine the most stable defect of each type. Stoichiometric ZrC has no carbon vacancies, so only defects in the first, second, and fourth categories were considered.
Special Quasirandom Structures (SQS)60 were used to perform first-principles calculations that approximate the vacancy-disordered phase to determine the relative stability. SQS60 provide a structure that approximates the disordered state by choosing an atomic structure with atomic correlation functions that are close to the disordered state. SQS were generated at various compositions of Zr, C, carbon vacancies, and O based on the rocksalt parent lattice using the mcsqs code in the ATAT package.61 As O atoms were found to be most stable on the vacant octahedral interstitial sites (where vacancies existed) in the vacancy-ordered phases (see Results and discussion section below), it was assumed that this crystallographic position was also most favourable in the disordered solid solution phase. Zr atoms were fixed on a cubic lattice, with C, Va, and O distributed among octahedral interstitial sites. SQS with 0%, 3.125%, 6.25%, 12.5%, and 25% O site fraction (oxygen concentration on the octahedral interstitial sites only) were generated for equally spaced vacancy site fractions between 0% and 50%. The 0%, 3.125%, 6.25%, 12.5%, and 25% O site fractions sets had 32, 32, 96, 96, and 96 Zr atoms respectively. During relaxation, atomic size mismatch and the presence of defects can cause distortions in the SQS lattice that cause a loss of symmetry.62 The radial distribution function of the unrelaxed and fully relaxed structures was examined to ensure that the character of the face-centred cubic rocksalt structure is retained during full relaxation.
The supercell method was used to construct ordered structures with varying oxygen concentration, with one oxygen atom per supercell. Additionally, structures were constructed where all carbon vacancy sites were filled with oxygen, or oxygen atoms were quasi-randomly distributed on the sites using SQS. For the sub-stoichiometric ordered phases in Table 1, O defects were introduced into the vacant octahedral interstitial sites with site fraction between ∼0.7% of the octahedral sublattice and full saturation of the sublattice. Structures with fully vacancy saturation and further carbon substitution were also constructed. In ZrC, O defects were introduced into the octahedral interstitial sites as carbon substitution, occupying between ∼0.7% and 25% of the octahedral sublattice. The full list of calculated supercells is provided as ESI.†
3. Results and discussion
3.1 Structural position of oxygen defects
The preferred crystallographic location of the oxygen defects was determined via first-principles calculation. The stability and volume of the pure and some defective structures (O defect types (i)–(iv)) for ZrC and the sub-stoichiometric ordered phases are shown in Table 2, where the number of O atoms is ∼3% of the number of Zr atoms. Where several configurations of each defect type were possible, the most stable configuration is reported here, while data for the other configurations is given as ESI.†| Phase | ZrC | Zr7C6 | Zr4C3 | Zr3C2 | Zr2C | |
|---|---|---|---|---|---|---|
| Pristine | # Zr atoms | 32 | 42 | 32 | 36 | 32 |
| # C atoms | 32 | 36 | 24 | 24 | 16 | |
| # Va sites | 0 | 6 | 8 | 12 | 16 | |
| Formation energy (eV per atom) | −0.917 | −0.908 | −0.865 | −0.818 | −0.684 | |
| Volume/cation site (Å3) | 25.056 | 25.161 | 25.130 | 25.043 | 24.916 | |
| Defect (i) zirconium substitution | O site fraction | 0.0323 | 0.0244 | 0.0323 | 0.0286 | 0.0323 |
| Formation energy (eV per atom) | −0.744 | −0.789 | −0.733 | −0.709 | −0.577 | |
| O defect formation energy (eV) | 11.045 | 9.290 | 7.362 | 6.545 | 5.154 | |
| Volume/cation site (Å3) | 25.032 | 25.159 | 25.092 | 25.061 | 24.812 | |
| Defect (ii) carbon substitution | O site fraction | 0.0313 | 0.0238 | 0.0313 | 0.0278 | 0.0313 |
| Formation energy (eV per atom) | −1.006 | −0.977 | −0.956 | −0.903 | −0.779 | |
| O defect formation energy (eV) | −5.747 | −5.417 | −5.112 | −5.127 | −4.576 | |
| Volume/cation site (Å3) | 25.008 | 25.095 | 25.041 | 24.942 | 24.826 | |
| Defect (iii) vacancy (octahedral) interstitial | O site fraction | — | 0.0238 | 0.0313 | 0.0278 | 0.0313 |
| Formation energy (eV per atom) | — | −0.982 | −0.972 | −0.922 | −0.819 | |
| O defect formation energy (eV) | — | −6.742 | −6.993 | −7.153 | −7.314 | |
| Volume/cation site (Å3) | — | 25.091 | 25.040 | 24.978 | 24.820 | |
| Defect (iv) tetrahedral interstitial | O site fraction | 0.0313 | 0.0238 | 0.0313 | 0.0278 | 0.0313 |
| Formation energy (eV per atom) | −0.905 | −0.907 | −0.868 | −0.818 | −0.683 | |
| O defect formation energy (eV) | −0.142 | −0.816 | −1.039 | −0.807 | −0.623 | |
| Volume/cation site (Å3) | 25.333 | 25.415 | 25.492 | 25.367 | 25.321 | |
The formation energy of stoichiometric ZrC and the ordered ZrCx phases without any oxygen impurities are consistent with other first-principles studies.15–19 The formation energies in Table 2 show that in all cases of oxygen defect types (ii) and (iii), the structures containing oxygen are more stable than the pure structure and the oxygen defect formation energy is negative. This increased stability may explain why processing ZrCx to fully remove oxygen (such as by carbothermal or methanothermal reduction) is so challenging. For all structures, the octahedral site (defect type (ii) or (iii)) is most favourable for the oxygen atom, where the vacant octahedral site (defect type (iii)) is preferred if vacancies are present, in agreement with experimental observations from Réjasse et al.30 As the oxygen defect formation energy is negative for all the cases of defect types (ii)–(iv), several different defective structures may coexist in a real bulk crystal, although only the most stable octahedral defects are considered further in this work.
3.2 Electronic structures and local bonding
Fig. 2(a) and (b) shows the charge density distribution of pristine and defective ZrC in the (100) plane, where one carbon atom per 2 × 2 × 2 64-atom supercell is substituted with oxygen. The charge density difference between ±0.018 e Bohr−3 in the two structures is visualised in Fig. 2(c). The charge density is significantly increased at the oxygen site compared to the corresponding carbon atom, and there is reduced charge between the oxygen atom and the neighbouring zirconium atoms, as well as reduced charge at the nearest neighbour Zr sites. Fig. 2(d) and (e) show the ELF of the same pristine and defective structures respectively, and the ELF line profiles are shown in Fig. 2(f) along the nearest neighbour C–Zr, C–C, and Z–Zr bonds in the pristine structure, and equivalent O–Zr, O–C, and Zr–Zr bonds in the defective structure. The O–Zr bond has different bonding characteristics to the C–Zr bond. The charge density distribution and increased ELF indicates greater ionic character in the O–Zr bond compared to the C–Zr bond, which is highly covalent. The O–C bond also shown some ionic character, while the character of the nearby metallic Zr–Zr bonds is relatively unchanged.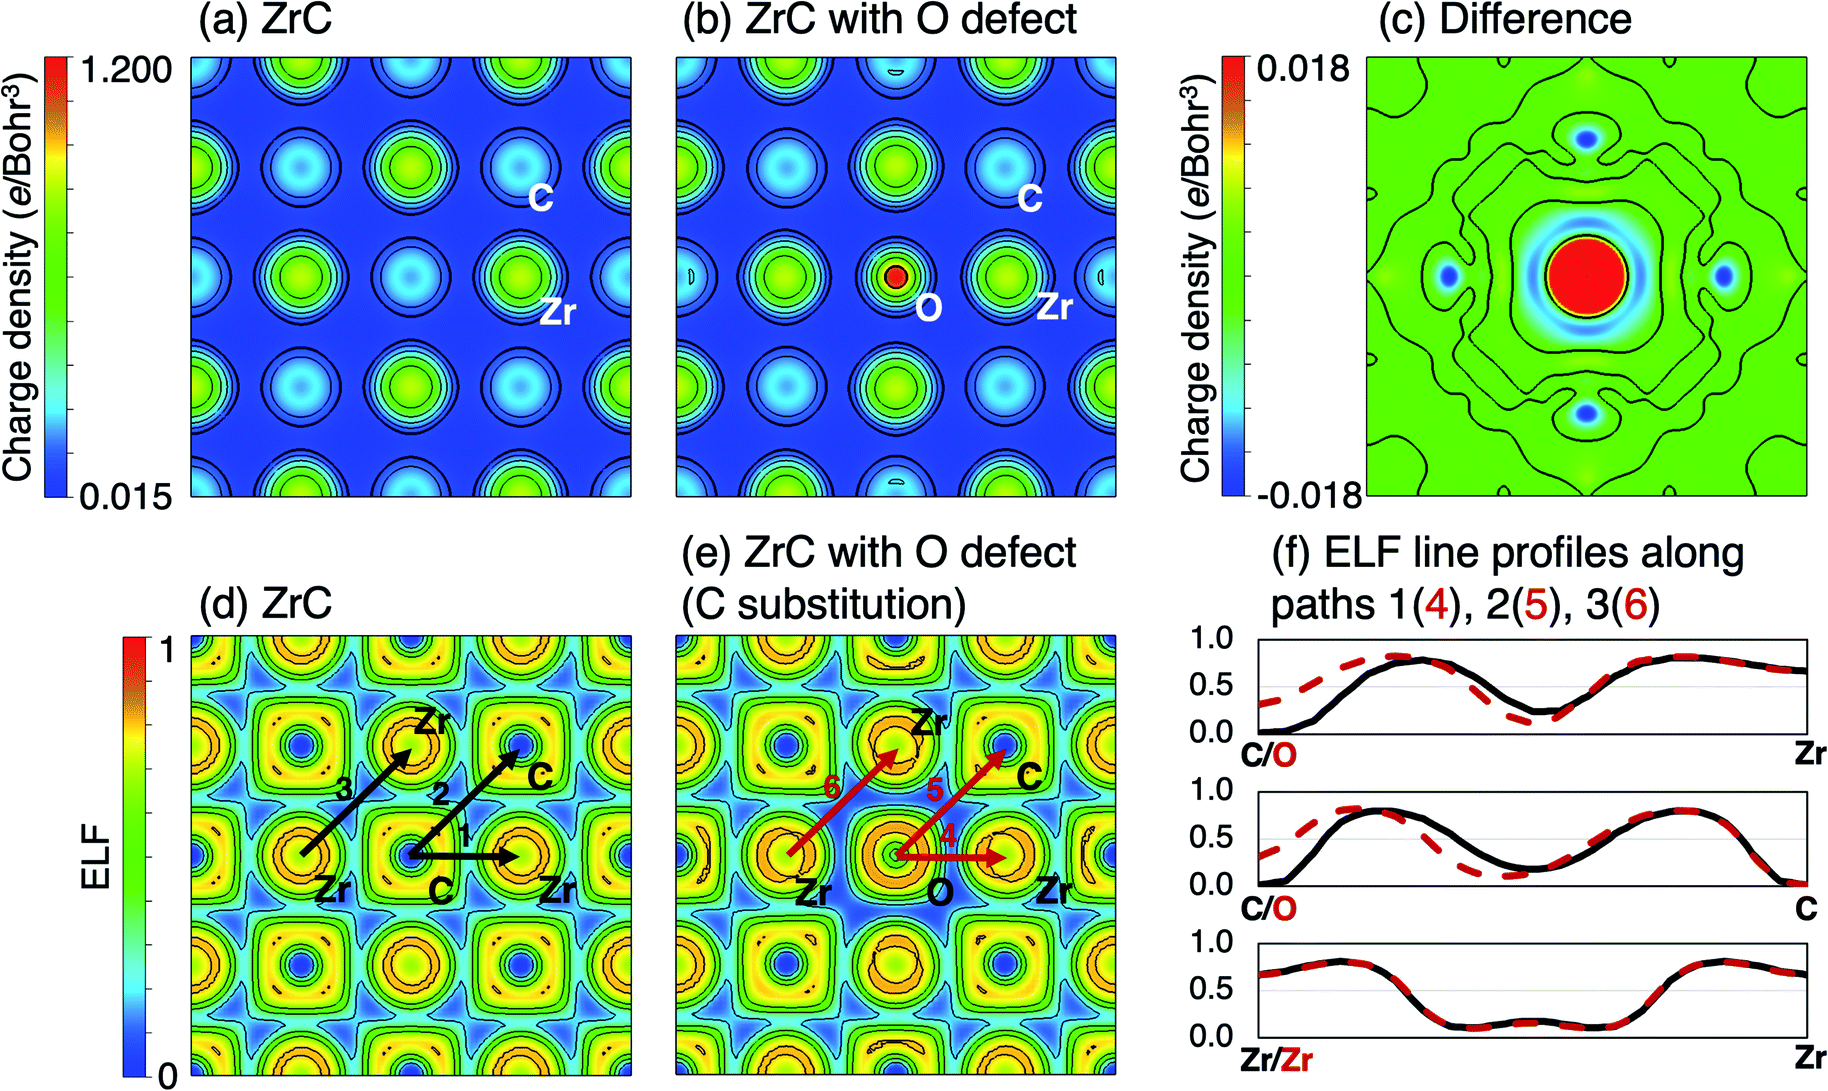 | ||
| Fig. 2 Charge density distribution of the (100) plane of (a) pristine ZrC, (b) ZrC where one carbon atom per 2 × 2 × 2 supercell is substituted for oxygen (3.125% of C sites, defect type (ii)), (c) the difference between the pristine and defective structures. In (c) the lines separate positive and negative regions. ELF of the (100) plane of (d) pristine ZrC, (e) ZrC with O defect as in (b), and (f) along line profiles marked in (d) and (e). | ||
The total, local, and local partial density of states of stoichiometric ZrC and ZrC where 3.125% and 12.5% of the carbon atoms are substituted by oxygen atoms are shown in Fig. 3. The covalent C–Zr bond consists primarily of strong hybridisation between the Zr d-electrons and the C p-electrons between −5.5 eV and the Fermi energy.19 The O–Zr bond is primarily characterised by partial hybridisation of the Zr d-electrons and the O p-electrons between −8 eV and −5 eV below the Fermi energy which obviously enhances the binding of the system. The extent of the orbital hybridisation from the density of states once again suggests that the O–Zr bond is more ionic than the C–Zr bond.
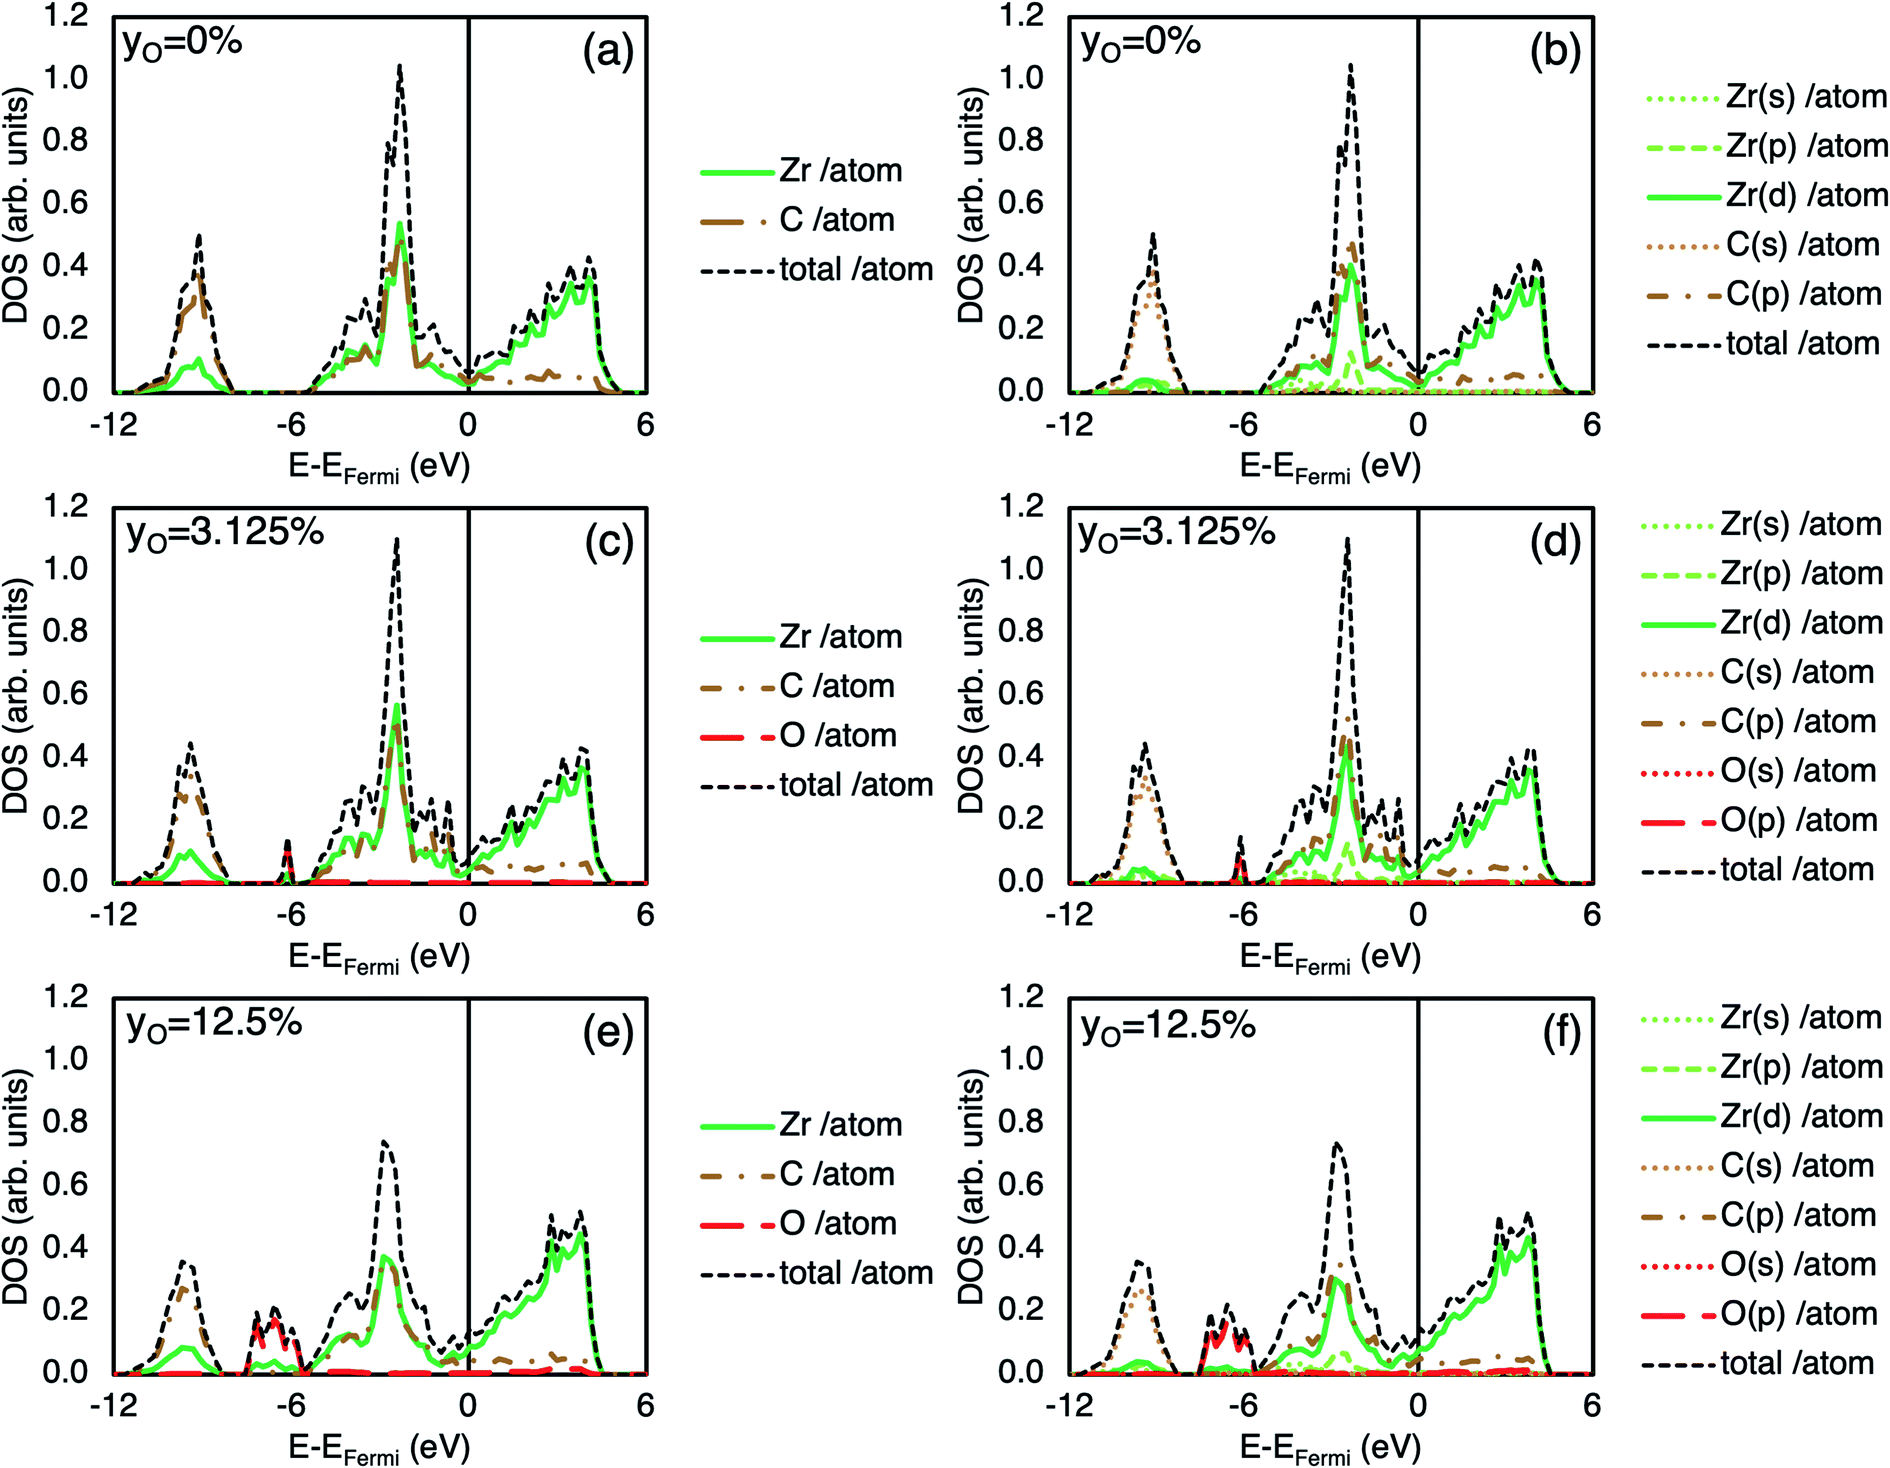 | ||
| Fig. 3 Total and local electronic density of states (DOS) ((a), (c) and (e)) and total and local partial DOS ((b), (d) and (f)) of pristine ZrC ((a) and (b) respectively), ZrC with oxygen substitution on 3.125% of the carbon sites ((c) and (d) respectively), and ZrC with oxygen substitution on 12.5% of the carbon sites ((e) and (f) respectively). | ||
The number of states corresponding to the C–Zr bond is reduced in the defective case as the oxygen defects are substitutional and there are fewer C–Zr bonds present. The O–Zr bond occurs at lower energy states compared to the C–Zr bond, hence the formation energy is lowered by the presence of oxygen defects from −0.917 eV per atom (pristine) to −1.006 eV per atom and −1.254 eV per atom in the 3.125% substitution and 12.5% substitution cases respectively.
The COHP can be used to partition the DOS into bonding, non-bonding, and anti-bonding regions, which are defined by negative, zero, or positive COHP respectively. Fig. 4(a) shows the COHP averaged over all pair bonds in a 2 × 2 × 2 ZrC supercell with and without a single carbon substitutional oxygen defect (3.125% of the carbon atoms). In pristine ZrC, the COHP between −6 eV and the Fermi energy is mostly anti-bonding, while when an oxygen defect is present in the structure it is fully bonding in that energy range. Fig. 4(b) shows the pCOHP for individual representative 1nn X–Zr (X = C, O) pairs in the same supercells. The 1nn C–Zr pairs in the pristine supercell, that dominate the bonding,19 have mixed bonding/anti-bonding behaviour between −6 eV and the Fermi energy. However, in the defective supercell with 3.125% of the C atoms substituted with O, all the 1nn C–Zr pairs become fully bonding between −6 eV and the Fermi energy. Additionally, the 1nn O–Zr pairs are strongly bonding, as indicated by the large spike between −7 and −6 eV below the Fermi energy.
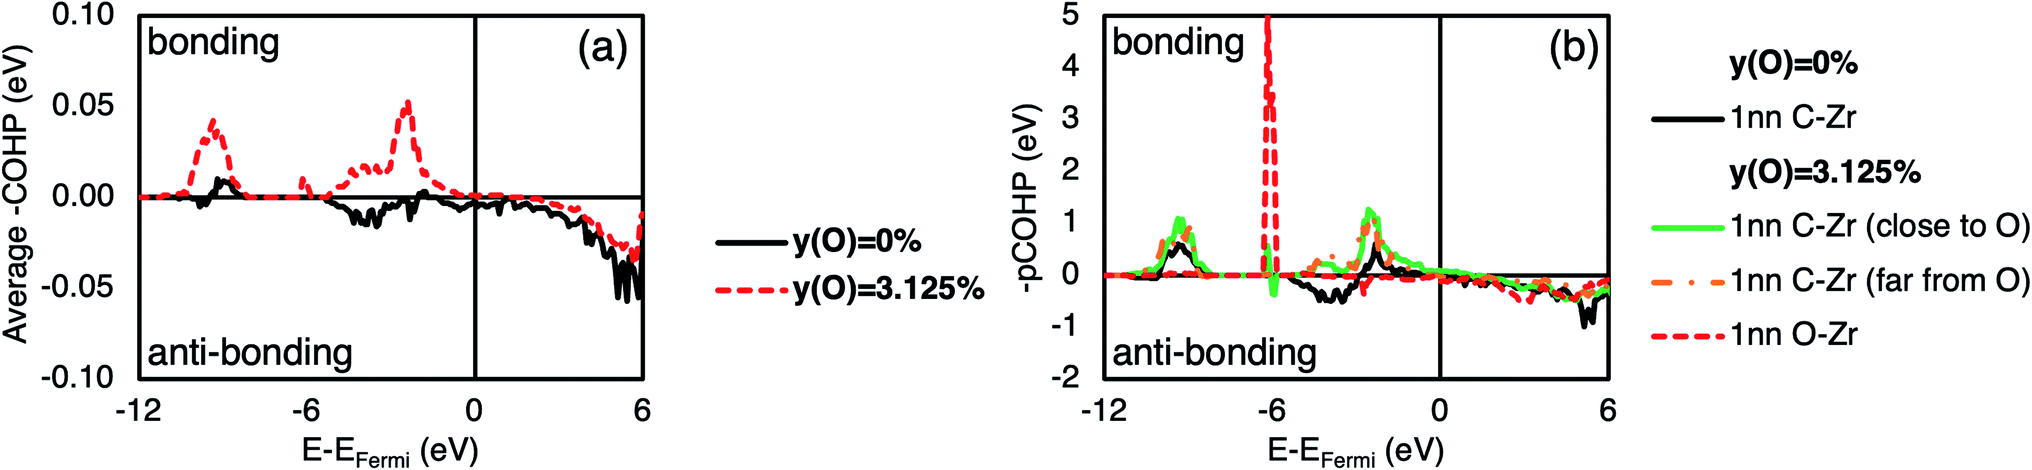 | ||
| Fig. 4 (a) –COHP averaged over all pair bonds within 7 Å for a 2 × 2 × 2 ZrC supercell and a 2 × 2 × 2 ZrC supercell with a single oxygen atom substituting a carbon atom. (b) –pCOHP for single representative 1nn X–Zr (X = C, O) pair bonds in a 2 × 2 × 2 ZrC supercell and in a 2 × 2 × 2 ZrC supercell with a single oxygen atom substituting a carbon atom. | ||
The IpCOHP may be used to examine the effect of this change on the individual bond strengths. The averaged IpCOHP values for each first and second nearest neighbour bond type in stoichiometric ZrC and ZrC where 3.125% and 12.5% of the carbon atoms are substituted by oxygen atoms are shown in Table 3. A negative ICOHP indicates that the bond has a greater bonding than antibonding character (is attractive) and its magnitude is proportional to the strength of the bond. A positive IpCOHP indicates that the pair bond has a greater antibonding character (is repulsive). The average IpCOHP for each bond type reveals that the bonding in pristine zirconium carbide is dominated by the first nearest neighbour (1nn) C–Zr bond, in agreement with Xie et al.18 and Davey et al.19 The 1nn Zr–Zr bond and second nearest neighbour (2nn) C–C bonds also provide smaller but finite bonding contributions. The bonding strength of the other bond types, and those at further distances, are all negligibly small.
| Pristine ZrC | ZrC with yO = 3.125% (C substitution) | ZrC with yO = 12.5% (C substitution) | |||||
|---|---|---|---|---|---|---|---|
| Bond length (Å) | IpCOHP (eV per bond) | Bond length (Å) | IpCOHP (eV per bond) | Bond length (Å) | IpCOHP (eV per bond) | ||
| C–Zr | 1nn | 2.323 | −3.525 | 2.320 | −3.580 | 2.313 | −3.598 |
| 2nn | 4.023 | −0.040 | 4.020 | −0.037 | 4.010 | −0.039 | |
| Zr–Zr | 1nn | 3.285 | −0.689 | 3.282 | −0.703 | 3.274 | −0.741 |
| 2nn | 4.645 | −0.003 | 4.642 | 0.001 | 4.629 | −0.000 | |
| C–C | 1nn | 3.285 | −0.005 | 3.283 | −0.006 | 3.279 | −0.005 |
| 2nn | 4.654 | −0.150 | 4.642 | −0.154 | 4.628 | −0.166 | |
| O–Zr | 1nn | — | — | 2.355 | −2.301 | 2.335 | −2.388 |
| 2nn | — | — | 4.022 | −0.009 | 4.011 | −0.008 | |
| C–O | 1nn | — | — | 3.267 | 0.002 | 3.261 | 0.002 |
| 2nn | — | — | 4.642 | −0.160 | 4.639 | −0.157 | |
When carbon atoms are substituted with oxygen atoms, the average IpCOHP value of the dominant C–Zr, Zr–Zr, and C–C bonds becomes more negative, that is, the bonding is strengthened by the oxygen substitution. The corresponding bond lengths are also seen to shorten. This corresponds to the decreased formation energy and volume in the defective structure compared to the pristine. From the values in Table 3 it can be seen that this effect increases with increasing oxygen site fraction. The 1nn O–Zr bonds are weaker than the 1nn C–Zr bonds, but the individual C–Zr bonds close to the oxygen defect are locally strengthened, increasing the average value over the whole structure. This is consistent with experimental observations from Barnier and Thévenot28 who suggest that the insertion of oxygen atoms in the octahedral sites increases the metal–non-metal bond strength.
Fig. 5(a) shows the formation energy of ZrC with varying amounts of oxygen substituting carbon on up to 25% of the carbon sites based on the supercell approach (one O in an 8-atom unit cell to one O atom in a 4 × 4 × 2 256-atom supercell). In Fig. 5, and all figures showing calculations of varying oxygen contents, each colour is used to consistently represent a certain oxygen site fraction. While the Zr–C–O phase diagram from Réjasse et al.30 predicts the solubility limit of oxygen in zirconium carbides to be ∼10 at% (∼21% site fraction O in ZrC) at high temperature, the stability of the metastable zirconium oxycarbide is considered at higher oxygen concentrations. As more oxygen is introduced, the structure continues to become more stable. The oxygen defect formation energy for ∼1% site fraction O in ZrC is −5.802 eV and becomes less negative with increasing oxygen concentration (−5.155 eV at 25% site fraction O). The numerical data for each composition considered is given as ESI.†
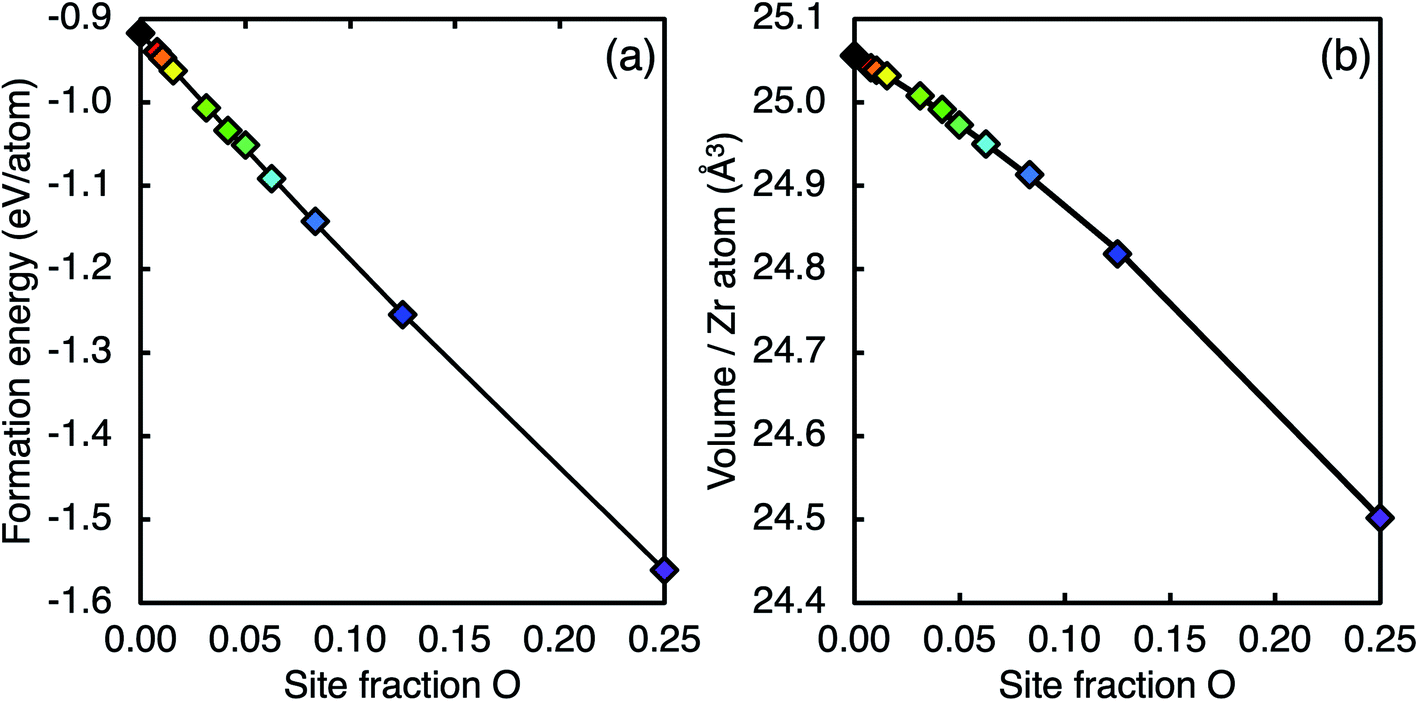 | ||
| Fig. 5 (a) Ground state formation energy and (b) volume of ZrC containing varying oxygen concentration (O substituting the C atoms, zero vacancy site fraction). The solid lines are the fitted functions of the type shown in eqn (1) and (3), where the coefficients are given in Tables 4 and 6 respectively. Each colour is used to consistently represent a certain oxygen site fraction. | ||
The increasing stability with increasing oxygen concentration can be understood by considering the changes in local bonding when the oxygen concentration is changed. Fig. 6 shows the average IpCOHP values for bonds in ZrC with different concentrations of substitutional oxygen defects. The strength of all the dominant 1nn X–Zr (X = C, O, Zr) bonds (Fig. 6(a), (b), (d)) increases as the concentration of oxygen increases, correspondingly stabilising the structure.
 | ||
| Fig. 6 Average integrated projected COHP (IpCOHP) values for each bond type in ZrC with varying amount of oxygen substitution on the carbon sublattice. The error bars indicate the highest and lowest values of each bond type found in the unit cell. | ||
The 0 K lattice parameter for ZrC calculated in this work (4.645 Å) is consistent with other first-principles calculations using the LDA.19,42,63,64 DFT calculations within the LDA typically underestimate the lattice parameter,65 so each calculated volume may not represent the true expected value. However, relative values should be correctly described, so can give insight into the variation of the structure size with vacancy and oxygen content. As several of the ordered phases have non-cubic unit cells from the different symmetry of the vacancy-ordered superstructural phases, the lattice parameter cannot be used as a consistent measurement across the ordered phases. Instead, the volume per cation (Zr atom) is used to compare the cell size for each structure. The volume of ZrC as a function of oxygen concentration is shown in Fig. 5(b), where the volume decreases as oxygen concentration increases. It can be seen in Table 2 that the volume of the supercell decreases when oxygen atoms are introduced on the octahedral interstitial lattice (by substituting carbon or by entering a vacant site), and increases when oxygen atoms are introduced on the tetrahedral interstitial sites. In the case of ZrC where 12.5% of the carbon atoms are substituted with oxygen atoms, there is a reduction in the volume per Zr atom from 25.056 Å3 to 24.819 Å3 (equivalent to a change in lattice parameter from 4.654 Å to 4.626 Å). As bond length is generally inversely proportional to bond strength,19 the bonds are correspondingly shortened when oxygen is present (as can be seen from bond lengths in Table 3), reducing the volume.
3.3 Stability of ordered phases
The formation energies of the sub-stoichiometric vacancy-ordered phases at various oxygen concentrations are shown in Fig. 7(a), where oxygen atoms enter carbon vacancy sites (defect type (iii)). In Fig. 7, each colour is used to consistently represent a certain oxygen site fraction. In all structures, the site fractions of carbon, vacancies, and oxygen (yC, yVa, and yO respectively) must sum to unity, yC + yVa + yO = 1. For all coloured points in Fig. 7, the carbon site fraction is fixed according to the pure structure, and therefore yVa + yO is also constant. Therefore, as the vacancy site fraction of each ordered phase decreases, the oxygen site fraction must correspondingly increase, as represented by the changing colour. Points that are not coloured represent mixed defect types (filled oxygen sites and carbon substitution) or the Zr2C phase when fully saturated with oxygen, which shows significantly different bonding characteristics. The oxygen defect formation energy per defect for each ordered structure is shown in Fig. 7(b). The oxygen defect formation energy becomes more negative with increasing sub-stoichiometry of ordered zirconium carbide phase, and less negative with increasing oxygen concentration. The oxygen defect formation energies of the mixed defect structures (including carbon substitution) are significantly higher than the type (iii) defects, which is consistent with the values in Table 2. | ||
| Fig. 7 (a) Ground state formation energies, and (b) oxygen defect formation energy of sub-stoichiometric ordered phases with varying oxygen defect concentration. Lines are fitted functions from eqn (1) shown in their range of fitting. Each colour is used to consistently represent a certain oxygen site fraction. | ||
For each ordered phase, the formation energy of the defective structure has a convex variation with the O site fraction. For each phase an expression for the formation energy can be written as
| Eform = E pureform + AyO + ByO2 eV per atom | (1) |
| Phase | Fitted pristine formation energy (eV per atom) | A (eV per atom) | B (eV per atom) |
|---|---|---|---|
| ZrC | −0.917 | −2.803 | 0.919 |
| Zr7C6 | −0.908 | −3.147 | 2.011 |
| Zr4C3 | −0.864 | −3.574 | 2.596 |
| Zr3C2 | −0.818 | −3.807 | 2.615 |
| Zr2C | −0.684 | −4.408 | 3.064 |
3.4 Stability of the disordered phase
Fig. 8 shows the formation energy of the disordered solid solution phase (based on SQS) as a function of vacancy site fraction, where the oxygen site fraction is fixed at 0%, 3.125%, 6.25%, 12.5%, or 25% of the octahedral interstitial sites. As such, along each line, yC + yVa is constant. The formation energy at a given carbon site fraction decreases with increasing oxygen site fraction as in the ordered phases. The calculated formation energies for the disordered phase are fitted to a function of oxygen and vacancy site fraction to obtain the formation energy at any composition. Assuming the disordered phase follows the same trends as the ordered phase, the quadratic variation of the formation energy with vacancy site fraction may be combined with the quadratic variation with oxygen site fraction, to fit the data to a function of the form| Eform = (E pureform(ZrC) + ayVa + byVa2) + yO(c + dyVa) + yO2(e + fyVa + gyVa2) |
| Eform = (0.920 + 0.173yVa + 0.957yVa2) + yO(−2.840 − 0.784yVa) + yO2(0.904 + 1.619yVa − 7.434yVa2) eV per atom | (2) |
 | ||
| Fig. 8 Calculated formation energy (with respect to pure elements) of the SQS representing the disordered solid solution phase with varying oxygen and vacancy concentrations. Lines are fitted functions from eqn (2). | ||
This function reproduces all calculated data for the disordered phase within 1%.
3.5 Destabilisation of the ordered phases
The energy difference between the stable ordered phases and the metastable disordered phase at the same composition (which may be called the ordering energy) decreases as the oxygen concentration increases. The order–disorder transition point may be determined for each phase from the function describing the formation energy of the disordered phase in eqn (2) and the formation energy functions for the ordered phases given in Table 4. The formation energy of the ordered and disordered phases are visualised together in Fig. 9(a), and the ordering energy is visualised in Fig. 9(b). The extrapolated oxygen concentration at disordering for each phase is given in Table 5. | ||
| Fig. 9 (a) The formation energy of the calculated ordered and disordered phases. Points are calculated data, solid lines are the fitted functions for the ordered phases (fixed carbon site fraction), and broken lines are the fitted function for the disordered phase (fixed oxygen site fraction). Each colour is used to represent a certain oxygen site fraction, consistent with other figures. Calculated data at 0%, ∼3.125%, ∼6.25%, ∼12.5%, and ∼25% site fraction oxygen are marked with large circles, triangles, diamonds, squares, and crosses respectively, where the data for the disordered phase does not have outlines. The energy of the ordered and disordered phase at the same oxygen concentration may be compared via points and lines of the same shape or colour. (b) The ordering energy, which is the difference between the formation energy of the disordered and ordered phases at each composition, as a function of oxygen defect concentration. Lines are from the fitted functions from Table 4 and eqn (2), and the points are calculated data. | ||
| Phase | Site fraction O | Atomic fraction O |
|---|---|---|
| Zr7C6 | 0.230 | 0.115 |
| Zr4C3 | 0.320 | 0.160 |
| Zr3C2 | 0.425 | 0.213 |
| Zr2C | 0.514 | 0.257 |
The ordering energy at a given oxygen concentration increases with the increasing sub-stoichiometry of the ordered phases, that is, the Zr2C phase has the largest ordering energy, and the Zr7C6 phase the lowest. However, as the oxygen defect formation energy for carbon substitution is much less negative than for interstitial oxygen defects in the vacancy sites, the extrapolated trend is not valid beyond full occupancy of the vacancy sites or the range over which it is fitted (solid lines). The extrapolated parts (dashed lines) represent the value if the trend continued without change, which can be seen to underestimate the ordering energy of the mixed defect type points (unfilled points), while also appearing to decrease more steeply than an extrapolation by eye of the fitted points. The fitted functions are only valid within the range that they are fitted (up to full occupancy of vacancies), and extrapolations beyond that range are not accurate and should be used with caution. It is clear from the unfilled points that at 0 K, the ordered phases are not destabilised by larger amounts of oxygen as the extrapolated lines suggest. Therefore, the disordering concentrations given in Table 5 may be considered a lower boundary for possible destabilisation from oxygen contamination, in order to provide a quantitative recommended value for limiting oxygen contamination during experimental synthesis, but the real oxygen concentration required for possible destabilisation at 0 K is not predicted well by this analysis.
Long-range ordering of vacancies in oxygen-free zirconium carbides is driven by a short-range preference for certain vacancy clusters that are more stable than isolated vacancies.15,19,20 As oxygen is introduced into the vacant sites, the vacancy clusters are disrupted, reducing the favourable vacancy–vacancy interactions that stabilise the structure compared to a random arrangement of vacancies. As such, the ordering energy decreases.
The decrease in the ordering energy with increasing oxygen concentration can be further understood by considering the local bonding. Fig. 10 shows the average IpCOHP for the 1nn and 2nn bonds in the vacancy-ordered structures with ∼3.1% site fraction O, and vacancy-disordered structures with 3.125% site fraction O. The average bond strengths for the 1nn C–Zr and Zr–Zr bonds, which dominate the bonding in zirconium carbides, are very similar for the ordered and disordered structures, although the range of values is larger in the disordered phases as seen in the same phases without oxygen defects.19 In the zirconium oxycarbides the 1nn O–Zr bonds also contribute significantly to the stability of the structure, and increase in strength with vacancy site fraction for both the ordered and disordered phases. However, the O–Zr bonds are stronger on average in the disordered phase compared to the ordered phases at the same composition, hence the ordering energy is reduced with increasing oxygen content.
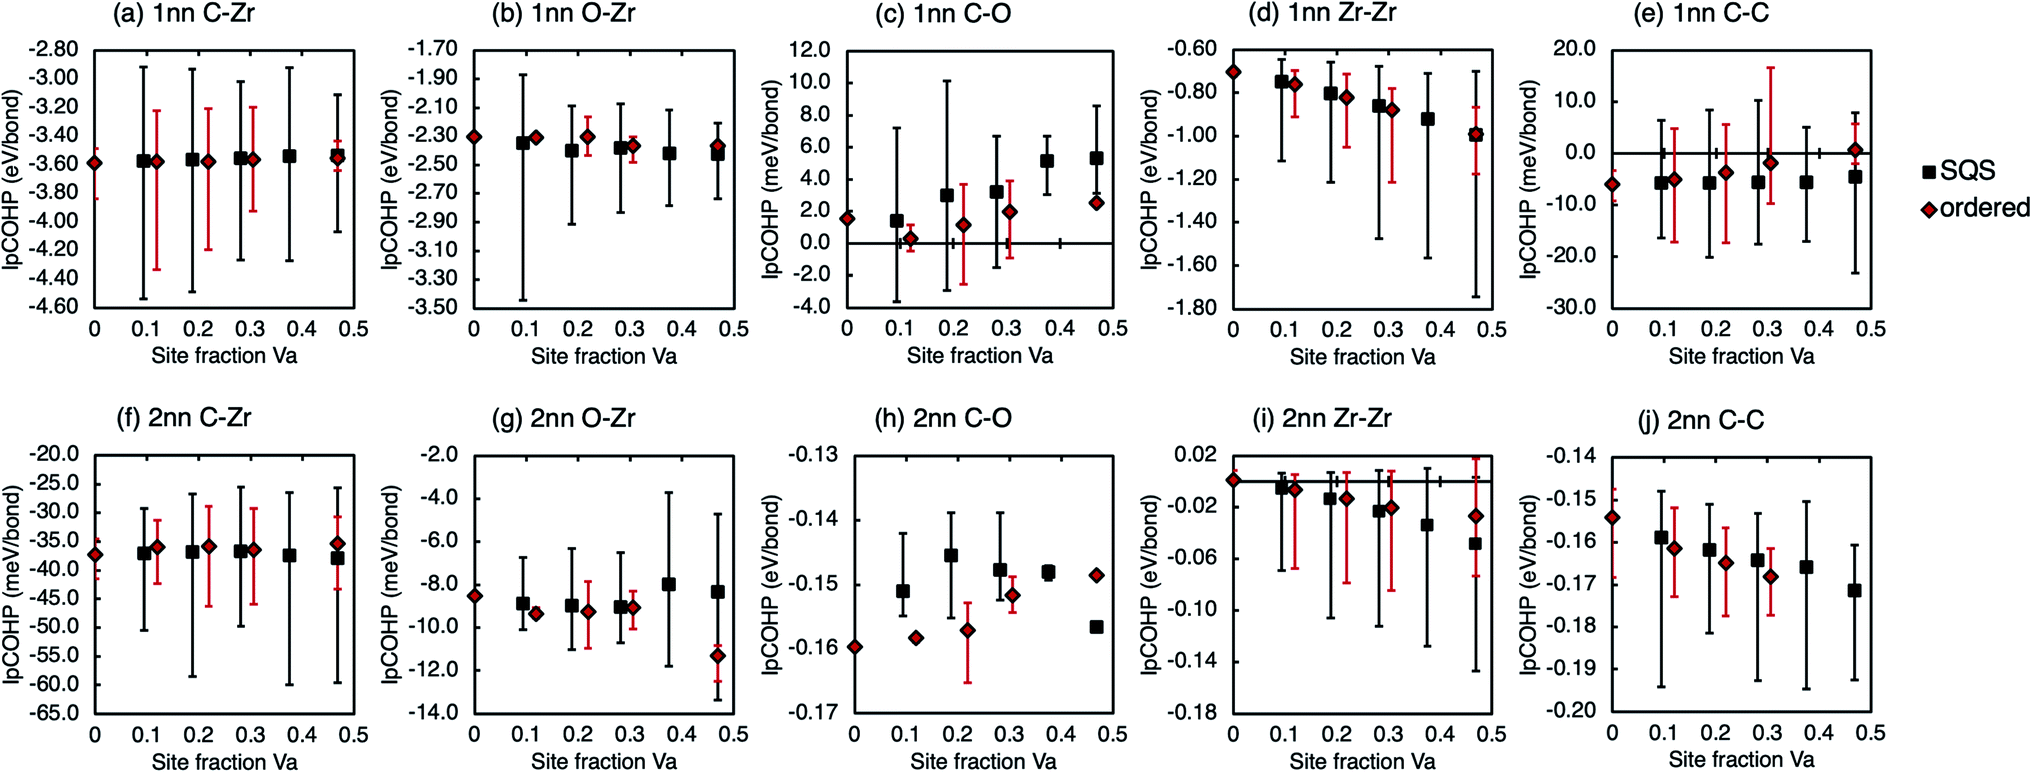 | ||
| Fig. 10 Average IpCOHP values for vacancy-ordered and vacancy disordered zirconium carbides with ∼3% O on the octahedral sites. | ||
For the Zr4C3, Zr3C2, and Zr2C phases, the destabilising oxygen concentration is beyond the maximum oxygen solubility predicted by the C–O–Zr phase diagram from Réjasse et al.30 therefore at 0 K these vacancy-ordered zirconium carbide phases cannot be fully destabilised by the addition of oxygen. Due to the challenging nature of the fabrication process of ZrCx, samples fabricated from commercial powders may typically have up to 11 at% O as an impurity25 (equivalent to 18.5% site fraction O in Zr2C or 22.0% site fraction O in Zr7C6). This level of oxygen contamination significantly reduces the ordering energy for all phases and may prevent the fabrication of vacancy-ordered phases in the experimental samples, which could explain why they are rarely experimentally observed. However, these ground state (0 K) first-principles calculations may not indicate the precise oxygen impurity threshold for ordered phase stability at finite temperature. As the energy difference between the ordered and disordered phases is expected to decrease with increasing temperature due to the configurational entropy contribution to the Gibbs energy of the disordered phase, it is likely that the threshold oxygen concentration for destabilisation of the ordered phases is lower at finite temperature.
In the Zr3C2, Zr4C3, and Zr7C6 phases, any amount of oxygen reduces the ordering energy. However, in the Zr2C phase, the ordering energy increases slightly when the oxygen concentration is below 3.125% site fraction O (∼2 at% fraction O). Therefore, the presence of small amounts of oxygen is not as detrimental to the fabrication of the ordered Zr2C phase as it may be to the other ordered phases. Additionally, Zr2C can tolerate more oxygen than other ordered phases due to its larger ordering energy at a given oxygen concentration. This is consistent with the Zr2C phase being the most-often experimentally synthesised ordered zirconium carbide, being reported twice as often4,6,8,9,11–13 as all other ordered structures combined.4,7,8,10
3.6 Variation of volume with oxygen and vacancy content
The calculated volume as a function of oxygen concentration is shown for ZrC in Fig. 5(b) (where oxygen defects are C substitutional type (ii)), and for the sub-stoichiometric ordered structures in Fig. 11(a) (where oxygen atoms enter the vacancy sites, type (iii)), and for the sub-stoichiometric disordered phase in Fig. 11(b) (where oxygen atoms enter the vacancy sites, type (iii)). For the phases shown in Fig. 11(a), all oxygen atoms enter vacancy sites, therefore yC is fixed and yVa + yO is constant along each line, and a decreasing vacancy site fraction corresponds to an increasing oxygen site fraction. In Fig. 11(b), yO is fixed, therefore yC + yVa is constant along each line. For all zirconium carbide phases, the volume per cation (Zr atom) at a certain carbon site fraction decreases with increasing oxygen site fraction.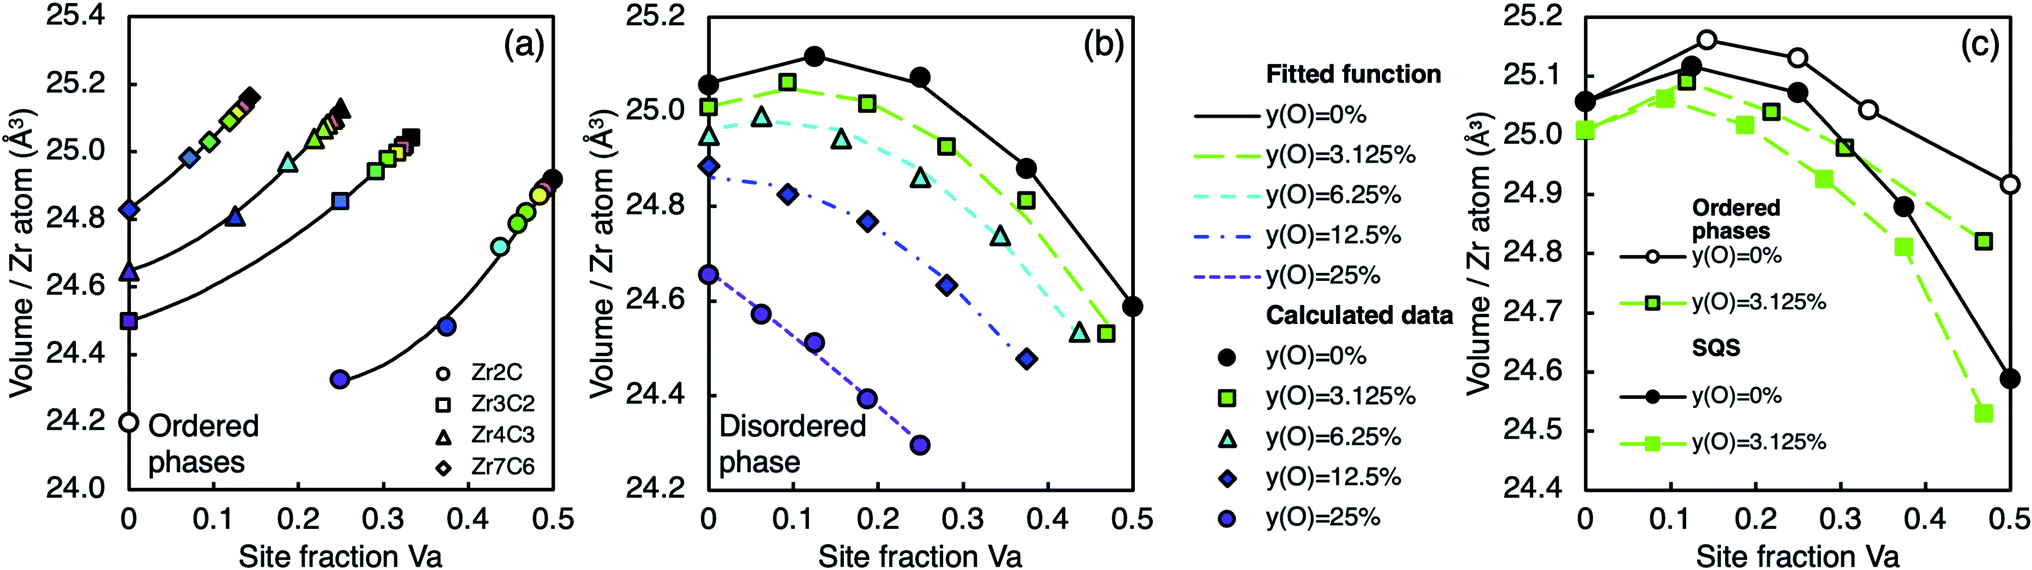 | ||
| Fig. 11 Volume per Zr atom at various oxygen and vacancy concentrations for (a) the ordered phases listed Table 1, (b) the disordered phase, (c) a comparison of the ordered and disordered phases at 0% and 3.125% site fraction O. Lines connecting the ordered phases are from eqn (3) in (a), lines connecting disordered phases in (b) are from eqn (5) and lines are shown to guide the eye only in (c). Each colour is used to consistently represent a certain oxygen site fraction. | ||
Bond strength is broadly inversely proportional to bond length, that is, stronger bonds of each type tend to be shorter. As the insertion of oxygen into the lattice increases the average strength of all dominant bond types, as seen in Fig. 6, we also find that the average bond lengths of each type decrease, resulting in decreasing volume. As the C–Zr bonds are strongest close to the oxygen defect, they are correspondingly shortened, however, the 1nn O–Zr bonds are longer than the average 1nn C–Zr bond (see Table 3). The shortening of the 1nn C–Zr bonds close to the oxygen defect allows local distortion of the lattice to accommodate the longer O–Zr bonds, while maintaining the structure far from the defect.
The decrease in cell volume is consistent with the experimental observations reported by Barnier and Thévenot,28 Gendre et al.,33 and Réjasse et al.,30 and a collection of data reported by Mitrokhin et al.66 Most experimental investigations of fully oxygen saturated ZrCx show an almost linear decrease in volume with increasing oxygen content, but these calculations (Fig. 5(b)) reveal it to be slightly concave at 0 K, although not to a degree that might be visible amongst experimental scatter. However, Réjasse et al. observe a convex parabolic curve for the lattice parameter (and corresponding volume).30 The non-linearity of the high temperature measurements from Réjasse et al. may be a result of varying thermal expansion at each composition due to the change in the ionocovalent character of the chemical bonds. This is consistent with the finding above that the O–Zr bond is more ionic than the C–Zr bond. The thermal vibrational contribution to the lattice parameter (thermal expansion) could vary as a result of the different bond characteristics of the O–Zr and C–Zr bonds.
Fig. 11(b) shows the change in volume with oxygen concentration for the disordered phase based on SQS. Mitrokhin et al.66 reviewed lattice parameters of various zirconium oxy- and nitro-carbides in the literature and fitted an empirical function for the lattice parameter as a function of carbon and oxygen content,
| aZrCx(O,N)y = 4.5621 − 0.2080x2 + 0.3418x − 0.80y(1 − x) Å |
The calculated volume of the disordered zirconium oxycarbide phase was compared with the experimental data in the literature1,67–86 and the empirical relation from Mitrokhin et al.66 by converting the calculated volume into an equivalent cubic lattice parameter and normalising by the room temperature lattice parameter of stoichiometric ZrC. The calculated data is shown alongside the values determined by Mitrokhin et al.66 in Fig. 12. While it is evident that this formula does not reproduce the 0 K calculated data, there is a general agreement between the trends found in the calculated data and the high temperature empirical relation from Mitrokhin et al., that is, the general form as a function of carbon site fraction, and the decreasing site fraction as a function of increasing oxygen concentration. Differences arise from varying thermal expansion at different compositions and the imperfect nature of experimental samples. The empirical relation provided by Mitrokhin et al. also possibly includes defects outside the octahedral interstitial sites (e.g., tetrahedral interstitials and zirconium substitution), although based on Table 2 it can be expected that most of the stoichiometry variation is accounted for by mixing of carbon, oxygen, and vacancies on the octahedral interstitial sites, which is described by the SQS calculations. The differences arising from thermal expansion may be understood by considering the bonding character at varying carbon, vacancy, and oxygen concentrations.
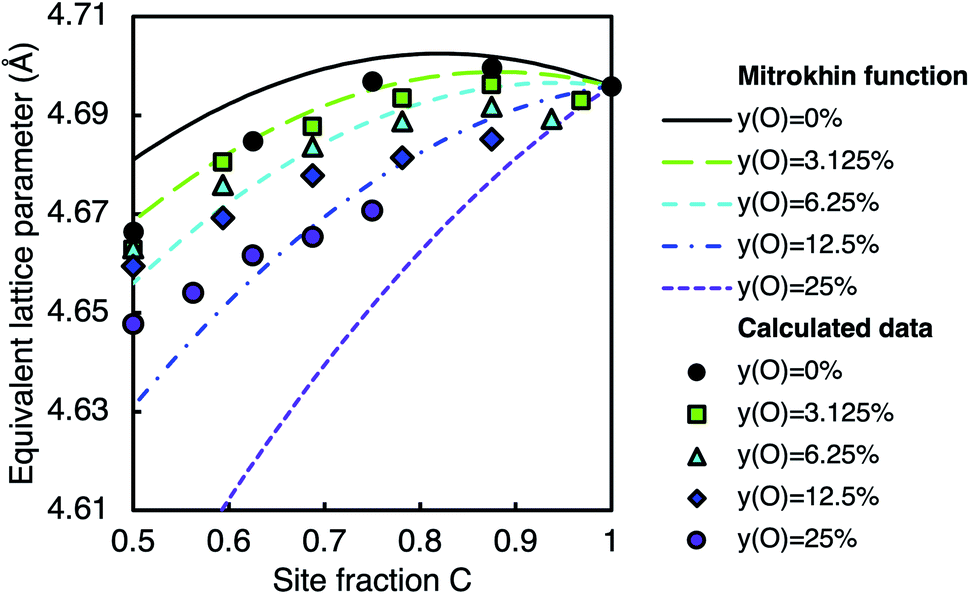 | ||
| Fig. 12 Equivalent lattice parameter of the disordered phase from calculations (points) and from the empirical relation from Mitrokhin et al.66 (lines) at different oxygen and carbon contents. The two sets of data are normalised by the same experimentally determined lattice parameter of stoichiometric ZrC. | ||
Local bonding analysis reveals that the dominant C–Zr bonding is weakened when more vacancies are present.19 Furthermore, when more vacancies are present, there are fewer C–Zr bonds. As such, the lattice is free to expand more at finite temperatures, as seen in the increasing coefficient of thermal expansion with vacancy concentration in zirconium carbides without the presence of oxygen.25,87,88 As the calculated data are normalised considering the finite temperature lattice parameter of ZrC, this variation in the coefficient of thermal expansion accounts for the underprediction of the lattice parameter at high vacancy concentration compared to the fitted function from Mitrokhin et al.66 As the introduction of oxygen into vacant sites introduces more Zr–X (X = C, O) bonds into the structure, it can be expected that the coefficient of thermal expansion will also decrease with increasing oxygen concentration. Therefore, the normalisation to the room temperature lattice parameter of ZrC, which is expected to have a larger thermal expansion, results in an overprediction of the lattice parameter compared to the empirical function at high oxygen concentration.
Fig. 11(c) shows the volume of the ordered and disordered phases for comparison at 0% and ∼3% oxygen site fraction. At low oxygen concentration, the vacancy-ordered phases have a larger volume per Zr atom (and therefore equivalent lattice parameter) than the disordered phase at the same composition, which is consistent with experimental measurements of the lattice parameter of the Zr2C phase.11,89
The variation of the volume with oxygen and vacancy content is fitted to functions of the same form as the formation energy,
|
V = Vpure + CyO + DyO2
| (3) |
|
V = (Vpure(ZrC) + ayVa + byVa2) + yO(c + dyVa) + yO2(e + fyVa + gyVa2)
| (4) |
| V = (25.060 + 0.934yVa − 3.743yVa2) + yO(−1.590 − 5.123yVa) + yO2(−0.015 − 15.267yVa + 50.547yVa2) Å3 per Zr atom | (5) |
| Phase | Fitted pristine volume (Å3 per Zr atom) | C (Å3 per Zr atom) | D (Å3 per Zr atom) |
|---|---|---|---|
| ZrC | 25.056 | −1.516 | −2.821 |
| Zr7C6 | 25.157 | −2.750 | 3.244 |
| Zr4C3 | 25.130 | −3.053 | 4.481 |
| Zr3C2 | 25.039 | −2.424 | 2.393 |
| Zr2C | 24.933 | −4.275 | 7.297 |
As the oxygen site fraction increases, the volume of the ordered phases decreases at a greater rate than the disordered phase at the same composition, converging at ∼15% site fraction O. Davey et al. showed that the pure ordered phases have a larger volume than the disordered phase at the same composition because the long-range ordering of vacancies maximises the volume.19 However, as oxygen atoms enter the vacant sites, the ordering of vacancy clusters is disrupted, and there is a corresponding volume decrease. As more of the vacancy clusters that maximise the volume are filled with oxygen atoms, the bonding distribution becomes closer to that of the disordered phase, resulting in a convergence in volume.
4. Conclusions
In this study, first-principles calculations of the ground state (0 K) energy of vacancy-ordered and vacancy-disordered ZrCx phases were performed with varying quantities of oxygen impurities. The most stable crystallographic position of oxygen defects was determined by considering the stability of several kinds of oxygen defects: Zr substitutional, C substitutional, octahedral interstitial (in a C vacancy site), and tetrahedral interstitial. In all cases, the most stable O defect configuration was in the octahedral interstitial lattice, which is consistent with experimental observations. If carbon vacancies are present, the oxygen atom is most stable in a vacant site, otherwise C substitution is preferred. For all phases, the formation energy of a structure with an oxygen defect in an octahedral site is lower than the pure structure, and the oxygen defect formation energy is negative, which is consistent with the ready reaction of zirconium carbides with oxygen and gives insight into the synthesis challenge of fully removing oxygen impurities via experimental processing such as carbothermal or methanothermal reduction.The formation energy of each ordered phase with varying oxygen concentration was evaluated using the supercell method, and it was found that the energy of each structure decreased quadratically as oxygen site fraction increased, which was attributed to the increasing average strength of all significant bond types when oxygen defects are present. The stabilisation from dissolved oxygen increases with sub-stoichiometry, as the O–Zr bonding is stronger when more vacancies are present.
The disordered phase was modelled by constructing SQS that approximate the disordered phase at varying vacancy and oxygen fractions on the octahedral interstitial sites. The formation energy of the disordered phase was also found to decrease quadratically with increasing oxygen content. The average strength of the O–Zr bonds is greater in the disordered phase than in the ordered phases, which consequently decreases the ordering energy with increasing oxygen concentration.
When no oxygen impurities are present, the vacancy-ordered phases are more stable than the vacancy-disordered phase at 0 K. The relative stability of the ordered phases compared to the disordered phase decreases as the dissolved oxygen contamination increases, and within the expected maximum oxygen solubility of oxygen, there may be an order–disorder transition where the disordered phase becomes more stable than the Zr7C6 vacancy-ordered phase. The other ordered phases (Zr4C3, Zr3C2, and Zr2C) also have reduced stability compared to the disordered phase at common experimental oxygen contamination levels. At elevated temperatures it is expected that the relative stability of the ordered phases will also decrease, possibly leading to destabilisation of some of the ordered phases within levels of oxygen contamination found experimentally. This is consistent with the infrequent observations of the vacancy-ordered phases despite their theoretical prediction, in particular the never-experimentally-solved Zr7C6, Zr4C3, and Zr3C2 phases which have lower ordering energies than the experimentally observed Zr2C phase.
The volume per cation (Zr atom) of the vacancy-ordered and disordered phases was calculated and found to decrease as a function of oxygen site fraction. This is attributed to the more ionic nature of the O–Zr bond compared to the C–Zr bond, and the increase in the average strength of all significant bond types when oxygen is present in the lattice. At low oxygen concentration, the vacancy-ordered phases have larger volume than the disordered solid solution phase at the same composition. However, as the concentration of oxygen increases, the volume difference at a given composition decreases. There are no systematic experimental investigations of the structural properties of zirconium carbides with varying oxygen and vacancy concentrations at low temperatures, so the calculated data was compared with finite temperature experimental data. The structural properties at 0 K are consistent with experimental observations when accounting for the expected thermal expansion as a function of vacancy and oxygen concentration. The effect of finite temperatures on the vacancy ordering in zirconium carbide will be discussed in future work (under preparation).90
Data availability
The data used in this study are available from the corresponding author upon reasonable request.Conflicts of interest
There are no conflicts of interest to declare.Acknowledgements
This work was supported by JSPS KAKENHI Grant Numbers JP19K15273 and JP21K14393. The authors acknowledge the Center for Computational Materials Science of the Institute for Materials Research, Tohoku University, for the support of the supercomputing facilities.References
- R. V. Sara, The System Zirconium-Carbon, J. Am. Ceram. Soc., 1965, 48(5), 243–247, DOI:10.1111/j.1151-2916.1965.tb14729.x
.
- H. F. Jackson and W. E. Lee, Properties and Characteristics of ZrC, in Comprehensive Nuclear Materials, Elsevier Inc., 1st edn, 2012, vol. 2, pp. 339–372 Search PubMed
- A. Fernández Guillermet, Analysis of thermochemical properties and phase stability in the zirconium-carbon system, J. Alloys Compd., 1995, 217, 69–89, DOI:10.1016/0925-8388(94)01310-E
- D. B. K. Rana, E. Z. Solvas, W. E. Lee and I. Farnan, An investigation of the long-range and local structure of sub-stoichiometric zirconium carbide sintered at different temperatures, Sci. Rep., 2020, 10, 3096, DOI:10.1038/s41598-020-59698-6
- C. R. Weinberger and G. B. Thompson, Review of phase stability in the group IVB and VB transition-metal carbides, J. Am. Ceram. Soc., 2018, 101, 4401–4424, DOI:10.1111/jace.15768
- H. Goretzki, Neutron Diffraction Studies on Titanium-Carbon and Zirconium-Carbon Alloys, Phys. Status Solidi, 1967, 20(1), K141–K143, DOI:10.1002/pssb.19670200260
- N. Obata and N. Nakazawa, Superlattice Formation in Zirconium-Carbon system, J. Nucl. Mater., 1976, 60, 39–42, DOI:10.1016/0022-3115(76)90115-X
- C. H. De Novion and V. Maurice, Order and disorder in carbides and nitrides, J. Phys., Colloq., 1977, 38(C7), 211–220, DOI:10.1051/jphyscol:1977740
- Y. Karimov, V. T. Ehm, Y. Khidirov and Y. S. Latergaus, Neutron diffraction study of ordering in titanium carbides and zirconium carbides, Izv. Akad. Nauk UzSSR, Ser. Fiz.-Mat. Nauk, 1979, 15(4), 81–83 Search PubMed
- B. V. Khaenko, Ordering in cubic carbides and nitrides of group 4 and 5 transition metals, Izv. Akad. Nauk SSSR, Neorg. Mater., 1979, 15(11), 1952–1960 CAS
- W. Hu, et al., Superstructural nanodomains of ordered carbon vacancies in nonstoichiometric ZrC0.61, J. Mater. Res., 2012, 27(9), 1230–1236, DOI:10.1557/jmr.2012.72
- B. Wei, et al., Densification, mechanical and thermal properties of ZrC1−x ceramics fabricated by two-step reactive hot pressing of ZrC and ZrH2 powders, J. Eur. Ceram. Soc., 2018, 38(2), 411–419, DOI:10.1016/j.jeurceramsoc.2017.09.027
- Y. Zhou, T. W. Heitmann, E. Bohannan, J. C. Schaeperkoetter, W. G. Fahrenholtz and G. E. Hilmas, Carbon vacancy ordering in zirconium carbide powder, J. Am. Ceram. Soc., 2020, 103(4), 2891–2898, DOI:10.1111/jace.16964
- A. I. Gusev and A. A. Rempel, Phase Diagrams of Metal-Carbon and Metal-Nitrogen Systems and Ordering in Strongly Nonstoichiometric Carbides and Nitrides, Phys. Status Solidi A, 1997, 163, 273–304, DOI:10.1002/1521-396X(199710)163:2%3C273::AID-PSSA273%3E3.0.CO;2-U
- Y. Zhang, B. Liu and J. Wang, Self-assembly of Carbon Vacancies in Sub-stoichiometric ZrC(1-x), Sci. Rep., 2015, 5, 18098, DOI:10.1038/srep18098
- Y. Zhang, B. Liu, J. Wang and J. Wang, Theoretical investigations of the effects of ordered carbon vacancies in ZrC1-x on phase stability and thermo-mechanical properties, Acta Mater., 2016, 111, 232–241, DOI:10.1016/j.actamat.2016.03.074
- X. X. Yu, C. R. Weinberger and G. B. Thompson, Ab initio investigations of the phase stability in group IVB and VB transition metal carbides, Comput. Mater. Sci., 2016, 80, 341–349, DOI:10.1016/j.actamat.2014.07.070
- C. Xie, et al., Effects of carbon vacancies on the structures, mechanical properties, and chemical bonding of zirconium carbides: a first-principles study, Phys. Chem. Chem. Phys., 2016, 18, 12299, 10.1039/c5cp07724a
- T. Davey, K. Suzuki, H. Miura and Y. Chen, Stability and volume of vacancy-ordered and -disordered ZrCx, RSC Adv., 2021, 11, 32573–32589, 10.1039/d1ra06362f
- V. I. Razumovskiy, A. V. Ruban, J. Odqvist and P. A. Korzhavyi, Vacancy-cluster mechanism of metal-atom diffusion in substoichiometric carbides, Phys. Rev. B: Condens. Matter Mater. Phys., 2013, 87, 054203, DOI:10.1103/PhysRevB.87.054203
- V. I. Razumovskiy, M. N. Popov, H. Ding and J. Odqvist, Formation and interaction of point defects in group IVb transition metal carbides and nitrides, Comput. Mater. Sci., 2015, 104, 147–154, DOI:10.1016/j.commatsci.2015.03.042
- C. Gasparrini, et al., On the stoichiometry of zirconium carbide, Sci. Rep., 2020, 10, 6347, DOI:10.1038/s41598-020-63037-0
- H. F. Jackson, D. D. Jayaseelan, D. Manara, C. P. Casoni and W. E. Lee, Laser Melting of Zirconium Carbide: Determination of Phase Transitions in Refractory Ceramic Systems, J. Am. Ceram. Soc., 2011, 94(10), 3561–3569, DOI:10.1111/j.1551-2916.2011.04560.x
- H. F. Jackson, et al., Laser Melting of Spark Plasma-Sintered Zirconium Carbide: Thermophysical Properties of a Generation IV Very High-Temperature Reactor Material, Int. J. Appl. Ceram. Technol., 2010, 7(3), 316–326, DOI:10.1111/j.1744-7402.2009.02434.x
- H. F. Jackson, Thermophysical Properties and Thermodynamic Stability of Zirconium Carbide as a function of Non-Stoichiometry, Imperial College London, 2010 Search PubMed
- C. Gasparrini, R. J. Chater, D. Horlait, L. Vandeperre and W. E. Lee, Zirconium carbide oxidation: kinetics and oxygen diffusion through the intermediate layer, J. Am. Ceram. Soc., 2018, 101(6), 2638–2652, DOI:10.1111/jace.15479
- S. K. Sarkar, A. D. Miller and J. I. Mueller, Solubility of Oxygen in ZrC, J. Am. Ceram. Soc., 1972, 55(12), 628–630, DOI:10.1111/j.1151-2916.1972.tb13457.x
- P. Barnier and F. Thévenot, Synthesis and hot-pressing of single-phase ZrCxOy and two-phase ZrCxOyZrO2 materials, Int. J. High Technol. Ceram., 1986, 2, 291–307, DOI:10.1016/0267-3762(86)90022-6
- M. Gendre, A. Maître and G. Trolliard, Synthesis of zirconium oxycarbide (ZrCxOy) powders: influence of stoichiometry on densification kinetics during spark plasma sintering and on mechanical properties, J. Eur. Ceram. Soc., 2011, 31, 2377–2385, DOI:10.1016/j.jeurceramsoc.2011.05.037
- F. Réjasse, O. Rapaud, G. Trolliard, O. Masson and A. Maitre, Experimental investigation and thermodynamic evaluation of the C–O-Zr ternary system, RSC Adv., 2016, 6, 100122–100135, 10.1039/c6ra21967e
- T. Y. Kosolapova, V. B. Fedorus, A. D. Panasyuk and G. K. Kozina, Conditions of formation and some properties of zirconium oxycarbides, Powder Metall. Met. Ceram., 1972, 11(1), 47–50 CrossRef
- A. Ouensanga and M. Dode, Study of oxygen solubility in zirconium carbide at 1555 deg C with free carbon and in thermodynamical equilibrium conditions, Rev. Int. Hautes Temp. Refract., 1974, 11(1), 35–39 CAS
- M. Gendre, A. Maître and G. Trolliard, Synthesis of zirconium oxycarbide (ZrCxOy) powders: influence of stoichiometry on densification kinetics during spark plasma sintering and on mechanical properties, J. Eur. Ceram. Soc., 2011, 31, 2377–2385, DOI:10.1016/j.jeurceramsoc.2011.05.037
- P. E. Blöchl, Projector augmented-wave method, Phys. Rev. B: Condens. Matter Mater. Phys., 1994, 50(24), 17953–17979, DOI:10.1103/PhysRevB.50.17953
- G. Kresse and D. Joubert, From ultrasoft pseudopotentials to the projector augmented-wave method, Phys. Rev. B: Condens. Matter Mater. Phys., 1999, 59(3), 1758–1775, DOI:10.1103/PhysRevB.59.1758
- M. Hacene, A. Anciaux-Sedrakian, X. Rozanska, D. Klahr, T. Guignon and P. Fleurat-Lessard, Accelerating VASP electronic structure calculations using graphic processing units, J. Comput. Chem., 2012, 33(32), 2581–2589, DOI:10.1002/jcc.23096
- M. Hutchinson and M. Widom, VASP on a GPU: application to exact-exchange calculations of the stability of elemental boron, Comput. Phys. Commun., 2012, 183(7), 1422–1426, DOI:10.1016/j.cpc.2012.02.017
- G. Kresse and J. Hafner, Ab initio molecular-dynamics simulation of the liquid-metal–amorphous-semiconductor transition in germanium, Phys. Rev. B: Condens. Matter Mater. Phys., 1994, 49(20), 14251–14269, DOI:10.1103/PhysRevB.49.14251
- G. Kresse and J. Furthmüller, Efficiency of ab initio total energy calculations
for metals and semiconductors using a plane-wave basis set, Comput. Mater. Sci., 1996, 6(1), 15–50, DOI:10.1016/0927-0256(96)00008-0
- G. Kresse and J. Furthmüller, Efficient iterative schemes for ab initio total-energy calculations using a plane-wave basis set, Phys. Rev. B: Condens. Matter Mater. Phys., 1996, 54(16), 11169–11186, DOI:10.1103/PhysRevB.54.11169
- H. J. Monkhorst and J. D. Pack, Special points for Brillouin-zone integrations, Phys. Rev. B: Condens. Matter Mater. Phys., 1976, 13(12), 5188–5192, DOI:10.1103/PhysRevB.13.5188
- A. I. Duff, et al., Improved method of calculating ab initio high-temperature thermodynamic properties with application to ZrC, Phys. Rev. B: Condens. Matter Mater. Phys., 2015, 91, 214311, DOI:10.1103/PhysRevB.91.214311
- J. P. Perdew, K. Burke and M. Ernzerhof, Generalized Gradient Approximation Made Simple, Phys. Rev. Lett., 1996, 77(18), 3865, DOI:10.1103/PhysRevLett.77.3865
- J. P. Perdew, K. Burke and M. Ernzerhof, Generalized Gradient Approximation Made Simple- ERRATA, Phys. Rev. Lett., 1996, 78(7), 1396, DOI:10.1103/PhysRevLett.78.1396
- T. A. Mellan, A. I. Duff, B. Grabowski and M. W. Finnis, Fast anharmonic free energy method with an application to vacancies in ZrC, Phys. Rev. B, 2019, 100(2), 24303, DOI:10.1103/PhysRevB.100.024303
- J. P. Perdew and A. Zunger, Self-interaction correction to density-functional approximations for many-electron systems, Phys. Rev. B: Condens. Matter Mater. Phys., 1981, 23(10), 5048–5079, DOI:10.1103/PhysRevB.23.5048
- S. Grimme, C. Mück-Lichtenfeld and J. Antony, Noncovalent interactions between graphene sheets and in multishell (hyper)fullerenes, J. Phys. Chem. C, 2007, 111(30), 11199–11207, DOI:10.1021/jp0720791
- M. T. Yin and M. L. Cohen, Ground-state properties of diamond, Phys. Rev. B: Condens. Matter Mater. Phys., 1981, 24(10), 6121–6124, DOI:10.1103/PhysRevB.24.6121
- R. Dronskowski and P. E. Blöchl, Crystal orbital hamilton populations (COHP). Energy-resolved visualization of chemical bonding in solids based on density-functional calculations, J. Phys. Chem., 1993, 97, 8617–8624, DOI:10.1021/j100135a014
- S. Maintz, V. L. Deringer, A. L. Tchougréeff and R. Dronskowski, Analytic projection from plane-wave and PAW wavefunctions and application to chemical-bonding analysis in solids, J. Comput. Chem., 2013, 34(29), 2557–2567, DOI:10.1002/jcc.23424
- S. Maintz, V. L. Deringer, A. L. Tchougréeff and R. Dronskowski, LOBSTER: A tool to extract chemical bonding from plane-wave based DFT, J. Comput. Chem., 2016, 37(11), 1030–1035, DOI:10.1002/jcc.24300
- R. Nelson, C. Ertural, J. George, V. L. Deringer, G. Hautier and R. Dronskowski, LOBSTER: Local orbital projections, atomic charges, and chemical-bonding analysis from projector-augmented-wave-based density-functional theory, J. Comput. Chem., 2020, 41(21), 1931–1940, DOI:10.1002/jcc.26353
- V. L. Deringer, A. L. Tchougréeff and R. Dronskowski, Crystal orbital Hamilton population (COHP) analysis as projected from plane-wave basis sets, J. Phys. Chem. A, 2011, 115, 5461–5466, DOI:10.1021/jp202489s
- R. Y. Rohling, I. C. Tranca, E. J. M. Hensen and E. A. Pidko, Correlations between Density-Based Bond Orders and Orbital-Based Bond Energies for Chemical Bonding Analysis, J. Phys. Chem. C, 2019, 123(5), 2843–2854, DOI:10.1021/acs.jpcc.8b08934
- K. Momma and F. Izumi, VESTA 3 for three-dimensional visualization of crystal, volumetric and morphology data, J. Appl. Crystallogr., 2011, 44, 1272–1276, DOI:10.1107/S0021889811038970
- A. D. Becke and K. E. Edgecombe, A simple measure of electron localization in atomic and molecular systems, J. Chem. Phys., 1990, 92(9), 5397–5403, DOI:10.1063/1.458517
- B. Silvi and A. Savin, Classification of chemical bonds based on topological analysis of electron localization functions, Nature, 1994, 371(6499), 683–686, DOI:10.1038/371683a0
- A. Savin, R. Nesper, S. Wengert and T. F. Fässler, ELF: the electron localization function, Angew. Chem., Int. Ed. Engl., 1997, 36(17), 1808–1832, DOI:10.1002/anie.199718081
- K. Koumpouras and J. A. Larsson, Distinguishing between chemical bonding and physical binding using electron localization function (ELF), J. Phys.: Condens. Matter, 2020, 32(31), 315502, DOI:10.1088/1361-648X/ab7fd8
- A. Zunger, S.-H. Wei, L. G. Ferreira and J. E. Bernard, Special quasirandom structures, Phys. Rev. Lett., 1990, 65(3), 353–356, DOI:10.1103/PhysRevLett.65.353
- A. van de Walle, et al., Efficient stochastic generation of special quasirandom structures, Calphad, 2013, 42, 13–18, DOI:10.1016/j.calphad.2013.06.006
- D. Shin, R. Arróyave and Z.-K. Liu, Thermodynamic properties of binary hcp solution phases from special quasirandom structures, Phys. Rev. B: Condens. Matter Mater. Phys., 2006, 74, 024204, DOI:10.1103/PhysRevB.74.024204
- K. K. Korir, G. O. Amolo, N. W. Makau and D. P. Joubert, First-principle calculations of the bulk properties of 4d transition metal carbides and nitrides in the rocksalt, zincblende and wurtzite structures, Diamond Relat. Mater., 2011, 20, 157–164, DOI:10.1016/j.diamond.2010.11.021
- H. Fu, W. Peng and T. Gao, Structural and elastic properties of ZrC under high pressure, Mater. Chem. Phys., 2009, 115, 789–794, DOI:10.1016/j.matchemphys.2009.02.031
- H. Li, et al., Structural, elastic and electronic properties of transition metal carbides TMC (TM=Ti, Zr, Hf and Ta) from first-principles calculations, Solid State Commun., 2011, 151(8), 602–606, DOI:10.1016/j.ssc.2011.02.005
- V. A. Mitrokhin, R. A. Lyutikov and R. S. Yurkova, Change in the lattice constant of zirconium carbide in the region of homogeneity, Inorg. Mater., 1975, 11(6), 978–980 Search PubMed
- C. P. Kempter and R. J. Fries, Crystallographic data 189. Zirconium Carbide, Anal. Chem., 1960, 32(4), 570, DOI:10.1021/ac60160a042
- H. Nickel, Ö. Inane and K. Lücke, Beitrag zum system Zirkonium-Kohlenstoff, Z. Meteorol., 1968, 59(12), 935–940 CAS
- L. Ramqvist, Variation of lattice parameter and hardness with carbon content of group 4 b metal carbides, Jernkontorets Ann., 1968, 152(10), 517–523 CAS
- F. Baker, E. K. Storms and C. E. Holley, Enthalpy of Formation of Zirconium Carbide, J. Chem. Eng. Data, 1969, 14(2), 244–246, DOI:10.1021/je60041a034
- B. H. Morrison and L. L. Sturgess, The thermal diffusivity and conductivity of zirconium carbide and niobium carbide from 100 to 2500 deg K, Rev. Int. Hautes Temp. Refract., 1970, 7(4), 351–358 CAS
- A. S. Shevchenko, R. A. Andrievskii, V. P. Kalinin and R. A. Lyutikov, X-ray diffraction and pycnometric determinations of the density of zirconium-base interstitial phases, Powder Metall. Met. Ceram., 1970, 9, 71–73, DOI:10.1007/BF00796955
- V. G. Bukatov, G. A. Rymashevskij and V. B. Fedorov, Thermal expansion of nonstoichiometric zirconium carbides, Izv. Akad. Nauk SSSR, Neorg. Mater., 1971, 7(3), 519–520 CAS
- E. K. Storms and J. Griffin, Vaporization behavior of the defect carbides. IV. The zirconium-carbon system, High Temp. Sci., 1973, 5(4), 291–310 CAS
- E. K. Storms and P. Wagner, Thermal conductivity of substoichiometric ZrC and NbC, High Temp. Sci., 1973, 5(6), 454–462 CAS
- V. P. Bulychev, R. A. Andrievskii and L. B. Nezhevenko, The sintering of zirconium carbide, Powder Metall. Met. Ceram., 1977, 16, 273–276, DOI:10.1007/BF00806128
- A. S. Shevchenko, R. A. Lyutikov, R. A. Andrievskii and V. A. Terekhova, Oxidation of zirconium and niobium carbides, Powder Metall. Met. Ceram., 1980, 19, 48–52, DOI:10.1007/BF00798164
- J. Farr, Unpublished work (Cited by E. K. Storms, LAMS-2674, 1962), 1962.
- Y. Kumashiro, Y. Nagai, H. Katō, E. Sakuma, K. Watanabe and S. Misawa, The preparation and characteristics of ZrC and TaC single crystals using an r.f. floating-zone process, J. Mater. Sci., 1981, 16(10), 2930–2933, DOI:10.1007/BF02402865
- J. Henney and J. W. S. Jones, Ternary phases in the zirconium-carbon-oxygen system, report no, Atomic Energy Research Establishment, 1964 Search PubMed
- L. N. Grossman, High-Temperature Thermophysical Properties of Zirconium Carbide, J. Am. Ceram. Soc., 1965, 48(5), 236–242, DOI:10.1111/j.1151-2916.1965.tb14728.x
- E. Rudy, P. Harmon and C. E. Brukl, Ternary Phase Equilibria in Transition Metal-Boron-Carbon-Silicon Systems Part I, Related Binary Systems Volume II. Ti-C and Zr-C System, 1965 Search PubMed
- S. Aronson, E. Cisney and A. B. Auskern, Thermal Expansion of Nonstoichiometric Zirconium Carbides, J. Am. Ceram. Soc., 1966, 49(8), 456, DOI:10.1111/j.1151-2916.1966.tb15417.x
- H. L. Brown and C. P. Kempter, Elastic Properties of Zirconium Carbide, Phys. Status Solidi, 1966, 18, K21–K23, DOI:10.1002/pssb.19660180150
- R. Chang and L. J. Graham, Low-temperature elastic properties of ZrC and TiC, J. Appl. Phys., 1966, 37(10), 3778–3783, DOI:10.1063/1.1707923
- E. K. Storms, Refractory Materials Volume 2: The Refractory Carbides, Academic Press, 1967 Search PubMed
- G. V. Samsonov and V. Y. Naumenko, Thermal expansion of carbides of the transition metals of groups IV–V in their homogeneity range, High Temp., 1970, 8(5), 1022–1024 Search PubMed
- T. Y. Kosolapova, Handbook of high temperature compounds: properties, production, applications, CRC Press, 1990 Search PubMed
- B. Wei, Y. Wang, H. Zhang, D. Wang, S. Peng and Y. Zhou, Microstructure evolution of nonstoichiometric ZrC0.6 with ordered carbon vacancies under ion irradiation, Mater. Lett., 2018, 228, 254–257, DOI:10.1016/j.matlet.2018.06.010
- T. Davey and Y. Chen, A vacancy-centric thermodynamic assessment of the carbon-zirconium system, in preparation, 2021.
Footnote |
| † Electronic supplementary information (ESI) available: Crystal structure files (cifs) for the ordered phases, POSCARS for the generated SQS, and tabulated data for the formation energies, oxygen defect formation energies, and volumes of all calculated structures. See DOI: 10.1039/d1ra07768f |
| This journal is © The Royal Society of Chemistry 2022 |