 Open Access Article
Generation of multi-valence CuxO by reduction with activated semi-coke and their collaboration in the selective reduction of NO with NH3†
Bo Peng a,
Shuoyang Liangb,
Zheng Yanc,
Hao Wang
 ad,
Zhao Mengd and
Mei Zhang
 *a
*a
aState Key Laboratory of Advanced Metallurgy, School of Metallurgical and Ecological Engineering, University of Science and Technology Beijing, Beijing 100083, PR China. E-mail: zhangmei@ustb.edu.cn
bSchool of Environmental Science and Engineering, Southern University of Science and Technology, Shenzhen, 518055, PR China
cCollege of Energy & Environment, Shenyang Aerospace University, Shenyang, 110136, PR China
dSchool of Materials Science and Engineering, Peking University, Beijing 100871, PR China
First published on 7th February 2022
Abstract
Multi-valence CuxO has been demonstrated to have high activity in the low-temperature selective catalytic reduction of NOx with NH3 (NH3-SCR). Here, CuxO was loaded onto activated semi-coke (ASC) for SCR, which has shown satisfactory low-temperature SCR activity. By virtue of the reduction property of carbon, the valence of Cu was regulated by simply adjusting the calcination temperature. The high concentration of Cu+ generated from the reduction of CuO by ASC during calcination can collaborate to form Cu2+/Cu+ circulation. After systematic characterization by XPS, H2-TPD, and NH3-TPR, it is revealed that abundant acidic sites and surface reactive oxygen species are formed on the surface of the catalysts. Further investigation with in situ DRIFTS confirms that the NH3-SCR over the as-prepared CuO|Cu2O-ASC catalysts simultaneously follows the Langmuir–Hinshelwood (L–H) and Eley–Rideal (E–R) pathways, attributed to the synergistic effects of Cu2+ and Cu+.
1. Introduction
As a major pollutant, the emission control of NOx has attracted much attention. Selective catalytic reduction with NH3 (NH3-SCR) is considered the most effective technology and has been commercialized for decades.1–3 In recent years, many efforts have been devoted to low-temperature SCR (LT SCR, <200 °C) since it can widen the utilization of SCR and avoid severe flue gas conditions. The development of catalysts that can be utilized at a low temperature range has presented great prospects.4,5Various investigations have demonstrated that transition metal oxides are ideal candidates for low-temperature SCR, such as CuxO, MnxOy, and FexOy.5–8 Among the potential metal oxides that have been employed as active ingredients for low-temperature SCR catalysts, CuxO can offer high redox capacity and suitable acidic sites, which are significant for LT SCR performance. It was found that the valence of Cu directly affected the surface acidity and redox capacity of the catalysts, which are vital for their catalytic performance.9 Redox cycles of Cu2+/Cu+ and Cu+/Cu0 are considered to play a governing role during LT SCR.10 Although it has been well demonstrated that the appearance of a large number of Cu+ merits superior catalytic performance, pure Cu2O or CuO oxide catalysts show poor activity in a narrow temperature window.11 Hence, CuxO has usually been loaded onto a support, such as carbon,10,12–14 alumina,15 and molecular sieve.16 CuxO can be highly dispersed on the surface of the supports to expose more active sites. Meanwhile, the defects on the substrate are favorable during the creation of multi-valence CuxO. In comparison with alumina and other supports, carbonaceous materials are not only able to provide high surface area for the active sites but are also equipped with a large amount of functional groups.10,13 Close interactions have been observed during the loading of CuxO onto carbonaceous materials, which can regulate the valence distribution of copper species by virtue of their surface oxygen vacancy storage/release capacities and facilitate electron transfer among different Cu species.17–19 Li et al. prepared CuxO-carbon nanotubes (CNTs), CuxO-activated carbon (AC) and CuxO-graphite catalysts by wet impregnation methods to probe the effect of carbonaceous material supports and the nature of CuxO species. It was found that the good de-NOx of the Cu-CNTs catalyst originated from the good dispersion of CuxO, the existence of Cu+ and the strong acid sites on the catalyst surface. However, the interaction between Cu2+ and Cu+ was not discussed in detail.20 Zhu et al. loaded CuO on activated carbon and the catalysts showed high activities for NO reduction with NH3 at temperatures above 180 °C. They found that calcination temperature and Cu loading of the catalyst strongly influence the activity and structure of the catalyst. During the NO–NH3–O2 reaction, Cu2O can be easily oxidized into active CuO and results in increased activity.14 Wu et al. fabricated a series of CuAl-layered double oxide/carbon nanotubes-x (CuAl-LDO/CNTs-x) nanocatalysts with a tunable valence distribution of highly dispersed CuxO, which further demonstrated the synergistic catalytic mechanism of Cu2O and CuO.21 Herein, it is of great importance to regulate the distribution of Cu2+ and Cu+ in a convenient way. Xue et al. has reported the pretreatment of activated carbon using several methods, including air oxidation or wet oxidation in HNO3, H2O2, H2SO4 or H3PO4 aqueous solution. The de-NOx efficiencies of the as-prepared catalysts treated by HNO3 or H2O2 were greatly improved, contributed by the high concentration of acidic oxygen groups.10 This study presents the influence of the surface properties of the substrate, but the correlation between Cu2+/Cu+ and the reaction pathways is still ambiguous.
Based on previous research ideas, we employed activated semi-coke (an economical industrial carbonaceous material22), as the substrate to load CuxO, followed by regulating the calcination condition to obtain multi-valence Cu oxides. The abundant oxygen-containing groups on the surface of activated semi-coke can enhance the production of multi-valence Cu. The influence of the calcination temperature and atmosphere on the physical and chemical properties was further examined to probe the role of Cu2+/Cu+ circulation and the oxygen vacancies during LT SCR. Reaction mechanisms were further investigated with in situ diffuse reflectance infrared Fourier transform spectroscopy (in situ DRIFTS).
2. Methods and experiments
2.1 Preparation of activated semi-coke
The raw semi-coke was purchased from Shanxi Shenmu Group Limited Liability Company. Firstly, the semi-coke was mechanically crushed and sieved into 10–20 mesh, which was denoted as SC. Then, the SC sample was activated with 40 wt% HNO3 solution at 60 °C accompanied by magnetic stirring (600 rpm) for 2 h. After the acid activation, the sample was washed with de-ionized water until neutral and dried at 110 °C for 6 h. The obtained sample was then calcinated at 700 °C for 2 h with the protection of Ar flow, named as ASC.2.2 Preparation of CuxO loaded catalysts
A certain amount of copper nitrate trihydrate (analytical purity) was measured and fully dissolved in 20 mL of deionized water as the precursor solution. Excessive impregnation was employed to load the active component by adding 5 g of activated semi-coke into the precursor solution. After ultrasonic treatment (60 Hz) for 1 h, the sample was dried for 12 h at 110 °C, and calcinated at 350 °C for 2 h with the protection of Ar, denoted as CuX, in which X presents the molar concentration of the copper nitrate in precursor solution (0.3, 0.6, 1.0, 1.5 and 2.0 mol L−1).The calcination temperature was varied in the range of 250–450 °C, and the samples were denoted as Cu1.0-Y, in which Y stands for the calcination temperature (250, 300, 400, and 450 °C).
The calcination atmosphere was regulated as well, including pure Ar and the Ar flow containing 10% O2.
2.3 Characterization methods
The loading amount of metal oxides supporting on the sorbents was analyzed by inductive coupled plasma emission spectrometer (ICP, AFS-2000). The surface morphologies and microstructure of the samples were observed by field emission scanning electron microscope (FESEM, Zeiss supra 55) installed with an EDS system, operating at 10 kV. X-ray diffraction (XRD) analysis was investigated by X-ray powder diffractometer (Rigaku Dmax- 2500 diffractometer using Cu Kα radiation) to understand the crystal phase structure of the samples. Nitrogen adsorption–desorption isotherms were measured on a Micromeritics ASAP2020 instrument. The Brunauer–Emmett–Teller (BET) surface area measurements were evaluated from the adsorption data. X-ray photoelectron spectroscopy (XPS) analysis was carried out on AXIS ULTRA (Kratos, Japan) with the Al Kα radiation for the surface binding and elemental speciation. Further nanoscale morphology characterization of the sorbents was performed by high resolution transmission electron microscopy (HRTEM, Tecnai F20) installed with EDS system, operating at 200 kV. TG-DSC analysis of the precursor and other samples was carried out under N2 flow from room temperature to 800 °C (heat rate: 10 °C min−1). Moreover, hydrogen temperature programmed reduction (H2-TPR) and NH3 temperature programmed reduction (NH3-TPD) experiments were separately performed on Micromeritics AutoChem 2920 equipment with these conditions: 10 vol% H2/Ar and 10% NH3/He flow, 10 °C min−1. The thermal gravity-differential scanning calorimetry (TG-DSC) performance of samples were recorded with a Simultaneous Thermal Analyzer (LABSYS EVO, SETARAM).2.4 Activity test
The activity test was carried out on a self-made equipment. The de-NOx activity measurements were performed in the range of 90–210 °C in a fixed-bed continuous flow quartz reactor (with an inner diameter of 25 mm and equipped with a thermocouple). The flow rate of the reaction path was 200 mL min−1 with the space velocity (GHSV) of 10![[thin space (1/6-em)]](https://www.rsc.org/images/entities/char_2009.gif) 000 h−1. The simulated flue gas contained 500 ppm NO, 500 ppm NH3, 3% O2 and N2 as the equilibrium gas. The inlet NO concentration was collected ahead of each measurement. After the reaction system reached a stable state for 30 min, the NOX concentration in the outlet gas was measured by a NO/NO2 flue gas analyzer (Testo Pro350). By comparison of the NOX concentration in the inlet and outlet gas, the NO conversion rate is calculated according to the following formula.
000 h−1. The simulated flue gas contained 500 ppm NO, 500 ppm NH3, 3% O2 and N2 as the equilibrium gas. The inlet NO concentration was collected ahead of each measurement. After the reaction system reached a stable state for 30 min, the NOX concentration in the outlet gas was measured by a NO/NO2 flue gas analyzer (Testo Pro350). By comparison of the NOX concentration in the inlet and outlet gas, the NO conversion rate is calculated according to the following formula.
 | (1) |
3. Results and discussion
3.1 Chemical composition and textural properties of CuX catalysts
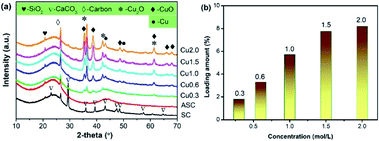
CuxO was loaded onto the activated semi-coke (ASC) by impregnation method with Cu(NO3)2. By varying the concentration of the Cu precursor from 0.3 to 2.0 mol L−1, the loading amount was manipulated to obtain CuX catalysts. The XRD patterns in Fig. 1(a) illustrate the chemical composition of as-prepared catalysts. By activation with nitric acid, CaCO3 in the original raw material SC was successfully removed, giving rise to the production of pores to accommodate the subsequent loading of active components. With the increase of loading amount, the diffraction profiles of CuxO, including CuO and Cu2O, began to emerge and the intensities increased gradually. The peaks assigned to Cu is also observed and strengthened with the rise in loading amount. The XRD patterns in Fig. 1(a) not only demonstrate the successful loading of Cu-containing active sites on ASC, but also exhibit a multi-valence state of Cu, which is commonly regarded to be convenient for the transfer of electrons during the redox cycle in SCR reactions. For clarity, the actual loading amount of Cu with respect to the Cu precursor concentration is quantified with ICP-AES, as depicted in Fig. 1(b). It can be seen that by increasing the precursor concentration, the loading amount increases as well, presenting a nearly linear increase. When the precursor concentration is higher than 1.5 mol L−1, the growth rate becomes slow. At a concentration of 2.0 mol L−1, the loading amount (8.19%) only exhibits a slight increase compared to that of Cu1.5 (7.75%), which indicates that the loading process has approached saturation.The morphologies of CuX catalysts are shown in Fig. 2. As illustrated in Fig. 2(a), the surface of the sample ASC presents a porous structure, which can provide high surface area and is suitable for the subsequent loading of active composites. When the Cu precursor concentration is 0.3 mol L−1, large CuxO sheets with a size of ∼10 μm are observed. With the rising of Cu precursor concentration, the sheets begin to splinter into small pieces (Fig. 2(c)) and then form rod morphologies (Fig. 2(d–f)). At a concentration of 2.0 mol L−1, the rods accumulate and the surface of ASC is completely covered, which coincides with the variation of loading amount exhibited in Fig. 1(b). In addition, the EDS characterization results show that the element distribution in the catalyst surface is very uniform (Fig. S1†).
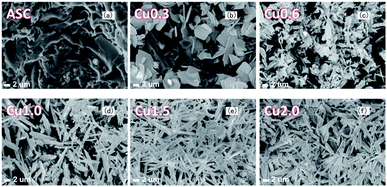 | ||
| Fig. 2 Morphologies of CuX samples prepared with different precursor concentrations, (a) 0, (b) 0.3 mol L−1, (c) 0.6 mol L−1, (d) 1.0 mol L−1, (e) 1.5 mol L−1, (f) 2.0 mol L−1 Cu0.3. | ||
The textural properties of as-prepared catalysts are illustrated in Table 1. The pore size distributions and N2 adsorption isotherms are shown in Fig. S2.† The treatment with HNO3 greatly improved the specific surface area from 27 m2 g−1 to 357 m2 g−1, which can expose more effective surface. After loading CuxO, the surface areas of catalysts present an initial increase and then a decreasing trend in the range of 260–290 m2 g−1, among which Cu1.0 achieves the largest surface area (289.5 m2 g−1). Meanwhile, the pore diameters of all CuX samples decreases to ∼2 nm. Therefore, the formation of CuxO can influence the textural properties, which is also consistent with the morphology analyses. Nevertheless, overdose of active components usually causes obvious accumulation and block the pores. Hence, the precursor concentration has a great influence on the catalytic activity.
| Samples | Specific surface area (m2 g−1) | Pore volume (cm3 g−1) | Average pore diameter (nm) |
|---|---|---|---|
| SC | 27 | 0.028 | 4.008 |
| ASC | 357 | 0.164 | 3.787 |
| Cu0.3 | 262.5 | 0.146 | 2.139 |
| Cu0.6 | 269.3 | 0.152 | 2.143 |
| Cu1.0 | 289.5 | 0.151 | 2.170 |
| Cu1.5 | 278.1 | 0.150 | 2.168 |
| Cu2.0 | 267.7 | 0.143 | 2.141 |
3.2 Morphologies and SCR activities of CuX catalysts
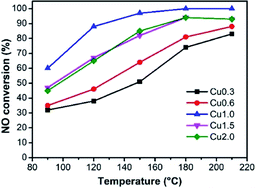
It has been well demonstrated that the performances of catalysts are affected by several different factors, such as loading amount, textural properties, and chemical composition.5,23 Fig. 3 reveals the SCR activities of samples at a low temperature range (90–210 °C). As a comparison, we can find that the unloaded ASC shows only about 20% catalytic conversion in the 90–210 °C window (Fig. S3†).It can be observed from Fig. 3 that the activities of as-prepared samples increase along with the rising temperature. Taking the loading amount into account, the catalysts present an initial increase and then decreasing tendency, in which sample Cu1.0 has the highest efficiency in the whole conducted range. At 150 °C, sample Cu1.0 presents about 90% NOx removal efficiency and achieves 100% efficiency at 180–210 °C. Furthermore, at a higher temperature range (180 and 210 °C), the advantages that originated from the high loading amount are reduced. Combined with the characterization of textural properties in Table 1 and the morphologies in Fig. 2, we proposed that when the precursor concentration is lower than 1.0 mol L−1, the main limitation is the absence of abundant active sites, but a higher loading amount may result in the loss of surface area. Therefore, we choose Cu1.0 as the best load condition for the next exploration. The N2 selectivity of these catalysts can be seen in Fig. S4,† which indicates high values close to 100%.
3.3 Catalysts calcinated at different atmosphere
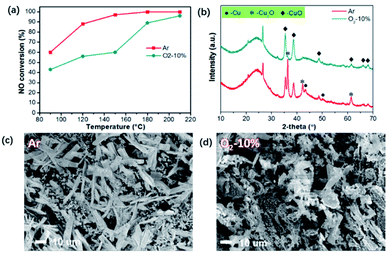
Nevertheless, the mechanism for the superior activities of the catalysts is still ambiguous, especially taking the valence distribution into account. It should be noted that due to the carbonaceous substrate, the abundant oxygen functional groups on the surface of ASC may react with carbon to generate CO during calcination with Ar, which can cause partial reduction of CuO. Herein, the reduction atmosphere during calcination was adjusted to further detect the formation process of multi-valence CuxO. The samples were treated with inert (Ar) and limited oxygen (10%) atmosphere at a heating rate of 10 °C min−1.The catalytic activities of the sample calcinated at 350 °C were compared as shown in Fig. 4(a). Activities of the sample treated in Ar atmosphere is more than the one treated with O2, particularly at a temperature lower than 150 °C. The XRD patterns were thus examined and are illustrated in Fig. 4(b). For the sample treated with protection of Ar, the main phases of CuxO are Cu2O, CuO, and even elemental Cu, resulted from the reduction by C after decomposition of Cu(NO3)2. However, when limited oxygen (10%) was introduced (Ar as the balancing gas), only CuO species can be found. Therefore, it can be deduced that the existence of O2 can effectively restrain the appearance of high content of Cu+ and Cu, which is not beneficial for the production of multi-valence Cu. From the morphologies demonstrated in Fig. 4(c), we can observe that with Ar atmosphere, the CuO grown on the surface of ASC mainly presents a sheet morphology with a size of 20–50 μm. When O2 is involved, the CuxO presents flocculent morphology, resulting from the erosion reaction by O2, indicating the transformation of Cu+ and Cu0 to high valence Cu2+. Combined with the de-NOx performance in Fig. 4(a) and the XRD patterns in Fig. 4(b), we can further draw the conclusion that the appearance of multi-valence Cu is favorable for low temperature SCR, owing to the synergistic effect of CuO/Cu2O.18
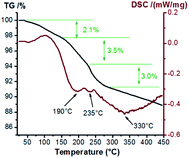
Considering that the precursors of samples with different loads are consistent, we choose the samples with better performance to study the thermal stability of precursors. Thermal analyses of sample Cu1.0 with Ar were performed to probe the production process of multi-valence Cu and the results are shown in Fig. 5. The weight loss is slow due to the inert atmosphere. The initial weight loss stage (to 2.1%) takes place at a temperature of ∼100 °C, resulting from the evaporation of water from the sample. Then, a rapid loss of weight observed below 200 °C is usually ascribed to the formation of Cu2(OH)3NO3, originating from Cu(NO3)2·3H2O. The decomposition of Cu2(OH)3NO3 over 200 °C results in the mixture of CuO and Cu2O. On further increasing the temperature, the weight loss rate becomes slow again, and the wide endothermic peak centered around 330 °C is assigned to the transformation of Cu2O to Cu.24 Herein, the decomposition reactions of Cu(NO3)2·3H2O on ASC can be described as Cu(NO3)2·5H2O → Cu2(OH)3NO3 → CuO → Cu2O → Cu.
Another important proposal that should be also noted is the properties of the carbonaceous support, which not only provides a high surface area to load the active sites, but also affects the loading process of the metal oxides since the carbon element can reduce the high valence metal ion, and oxygen functional groups usually display synergistic effect accompanied with the active sites.18,21,22,25
3.4 Comparison of properties before and after SCR Ar protection
It is widely demonstrated that Cu2+/Cu+ pairs are the catalytic active species for the reduction of NOX, and the distribution of Cu2+ and Cu+ is a key factor that influences the performance of catalysts.26To further investigate the roles of CuO and Cu2O, characterizations for sample Cu1.0 before and after the NH3-SCR were carried out, and the results are shown in Fig. 6. As shown in Fig. 6(a), the XPS spectra of sample Cu1.0 before and after SCR have Cu 2p peaks. In detail, Fig. 6(b) exhibits the spectra of deconvoluted Cu 2p peaks. The peak located at 934.4 eV is assigned to the binding energy of Cu2+ and the one centered around 932.6 eV is attributed to Cu+.27 It can be seen that the intensity of Cu2+ increases after the SCR reactions, and meanwhile, the peak presenting Cu+ is weaker, indicating the transformation of Cu+ to Cu2+ during SCR reactions. In Fig. 6(c), one can observe a stronger peak of O 1s after SCR reactions, which confirms the existence of higher valence of CuxO. The XRD patterns in Fig. 6(d) furthermore evidences that the intensity of peaks ascribed to CuO increases and Cu2O decreases after SCR reactions, which agrees well with the XPS spectra.28 Hence, it is concluded that the redox cycle of Cu2+/Cu+ might play the main role during the NH3-SCR reactions, especially the existence of Cu+. Wu et al. proposed the different roles of CuO and Cu2O during SCR reactions. CuO active center can function as the dominant adsorption site of NO and NH3 to promote the formation of NO+ active species and the dehydrogenation activation of NH3. The Cu2O active center can act as the adsorption site for O, promoting the formation of active oxygen species O−.18 Herein, it is of great importance to regulate the distribution of Cu2+ and Cu+ with an easy and convenient approach.
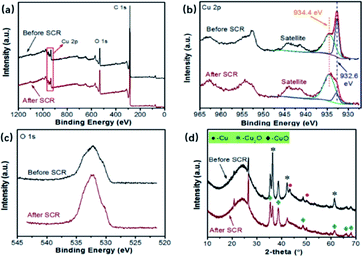 | ||
| Fig. 6 The properties of Cu1.0 before and after SCR reactions: (a) XPS spectra, (b) XPS spectra of Cu 2p, (c) XPS spectra of O 1s, (d) XRD patterns. | ||
3.5 Properties and SCR performance of Cu1.0-Y catalysts
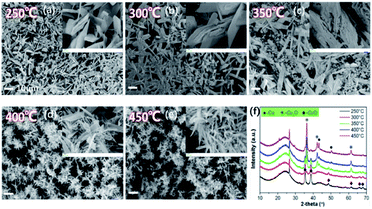
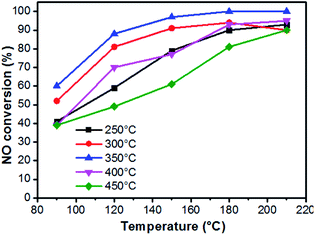
On the basis of the above investigation above, we found that the decomposition temperature of Cu(NO3)2·3H2O greatly influences the chemical construction of CuxO, in which the activated semi-coke not only plays the role of a support, but also provides a reductive atmosphere.29 Hence, the following study focuses on the distribution of Cu with different valences by simply changing the calcination temperature. The as-prepared catalysts were denoted as Cu1.0-Y, in which Y presents the calcination temperature. Fig. 7 reveals the variations of the morphologies and XRD patterns. When the calcination temperature was 250 °C, the sheet-structure of CuxO can be seen on the surface of activated semi-coke. The XRD patterns in Fig. 7(f) shows the main chemical pattern of CuxO is CuO at lower temperatures. With increasing calcination temperature, the morphologies gradually transfer into needle-like cluster structures, of which the XRD intensity of CuO decreases and the main components turn into Cu2O and even Cu can be noticed. This transformation agrees well with the TG-DSC results in Fig. 5.The de-NOX performances of the above samples were conducted to further verify the relationships between the distribution of Cu valence and the reaction mechanisms (Fig. 8 and S6†). With the increase in calcination temperature, activities of catalysts reveal an initial increase and then a decreasing trend, and the one treated at 350 °C (Cu1.0-350) shows the best performance, which implies an optimal proportion of Cu2+ and Cu+. Hence, several different characterization methods are employed to systematically discuss the influence of Cu valence distribution.
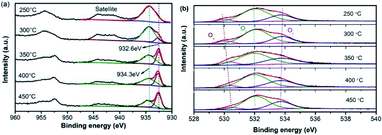
X-ray photoelectron spectroscopy (XPS) was used to probe the surface states and atomic concentration of Cu, as illustrated in Fig. 9(a). The XPS spectrum of Cu 2p was deconvoluted into several peaks by fitting the Gaussian peaks. The peaks detected at 934.3 eV and 932.6 eV can be assigned to Cu2+ and Cu+ respectively, evidencing the co-existence of multi-valence Cu ions. The peak area ratios of Cu2+ and Cu+ are listed in Table 2. When the calcination temperature was 250 °C, the peak was totally composed of Cu2+. By increasing the calcination temperature, the value of Cu2+/Cu+ remarkably decreases from 6.9 (300 °C) to 0.8 (450 °C), further evidencing that the composition of Cu ions can be manipulated via the calcination process. Meanwhile, the collaboration of Cu2+ and Cu+ facilitates the oxidation–reduction process during NH3-SCR reactions.17 The synergistic effect of Cu2+ and Cu+ can also result in changes in the active oxygen. The O 1s peaks are displayed in Fig. 9(b). The peak around 530.37 eV corresponds to lattice oxygen (Oα), whereas the one at 531.96 eV is attributed to the surface adsorbed oxygen species O2− or O− (Oβ). The peak that originates from the hydroxyl-like groups, including chemisorbed water, is denoted as Oγ. It has been well demonstrated that Oβ species can flexibly adsorb and release oxygen and transfer the lattice oxygen atoms to the surface of the catalysts.18 Thus, a higher relative concentration of Oβ is beneficial to the formation of adsorbed NO2 and favors the fast SCR reaction. Meanwhile, with the increasing temperature, the binding energies become higher, demonstrating a better transfer capability of lattice oxygen atoms to the surface of the catalysts.21,30
| Calcination temperature | Peak area ratio (Cu2+![[thin space (1/6-em)]](https://www.rsc.org/images/entities/char_2009.gif) : :![[thin space (1/6-em)]](https://www.rsc.org/images/entities/char_2009.gif) Cu+) Cu+) |
Oα ratio | Oβ ratio | Oβ/(Oα + Oβ) (%) |
|---|---|---|---|---|
| 250 °C | — | 7.9 | 60 | 88.4 |
| 300 °C | 6.9 | 8.3 | 67.2 | 89.0 |
| 350 °C | 1.7 | 7.2 | 62.1 | 89.6 |
| 400 °C | 1.3 | 7.5 | 66.5 | 89.9 |
| 450 °C | 0.8 | 6.3 | 62.5 | 90.8 |
The relative content of Oα and Oβ of each sample are compared in Table 2. It can be seen that Oβ is the dominant of the O species, and the ratio of Oβ increases along with the increased Cu+ content, consistent with the study conducted by Wu et al.21 Combined with the value of Cu2+/Cu+, it is found that a certain ratio of Cu+ is beneficial to the SCR activity, and the oxygen vacancies are closely related to the Cu2+/Cu+circulation. Consequently, surface active oxygen species with better mobility account for one of the key factors that permits a high SCR activity.31 Nevertheless, the SCR activities are not completely in conformity with the Oβ variation, which implies acidic sites that influence the adsorption of NH3 might also play a significant role during NH3-SCR.32
3.6 Redox properties and surface acidity analyses
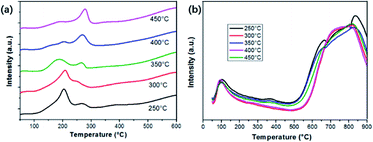
The transformation between Cu2+ and Cu+ is accompanied by the redox reactions during NH3-SCR of NOX. Herein, H2-Temperature-Programmed-Reduction (H2-TPR) can be used to assess the reducibility of the catalysts, as shown in Fig. 10(a). Two distinct peaks can be observed, including the one located around 200 °C and another at 260 °C. According to the XPS and XRD results, we assume the higher temperature peak can be assigned to the transformation of isolated Cu2+ to Cu+, and the one at a lower temperature is attributed to the reduction of Cu+ to Cu0. Comparatively, the reduction temperature in the process is greatly decreased since the active components are in a high dispersion state instead of being in a crystalline state.33 Particularly, the Cu2+ → Cu+ reduction peak of the sample calcinated at 350 °C is much lower than other samples, indicating its better reduction properties. Hence, the better NH3-SCR properties of sample Cu1.0-350 might have originated from the optimized distribution of Cu2+ and Cu+. In other words, the synergetic effect of Cu2+ and Cu+ can be achieved and optimized by adjusting the calcination temperature.Another factor that triggers the SCR reactions is the adsorption of NH3 on acidic sites.34 Herein, NH3-TPD technology is used to determine the surface acidity of the catalysts. Trends of NH3-TPD patterns along with the variation of calcination temperature are shown in Fig. 10(b). Two obvious sections can be observed in the desorption temperature range for all samples. One section corresponded to the desorption of weakly bound NH3 around 100 °C, which is derived from the breakage of fairly weak hydrogen bonds between adsorbed NH3 and surface acidic groups.35 The other part in a wide range of 600–900 °C is attributed to the desorption of NH3 from the strong acid sites, specifically Lewis acid sites. One small peak around 385 °C, owing to the existence of Brønsted acid sites can be found for the sample calcinated at 250 and 350 °C. It has been demonstrated that Brønsted and Lewis acid sites on catalysts can greatly affect the adsorption states of NH3 and the reaction pathway. It can be seen that the sample treated at 350 °C has abundant acidic sites. Thus, we propose that the NH3-SCR activities of as-prepared catalysts should take the integrated effect of oxygen vacancies and acidic sites into consideration.36 Herein, it is of great importance to systematically conduct the NH3-SCR process for better understanding.
3.7 In situ DRIFTS analyses
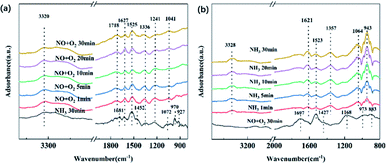
In order to further investigate the reaction mechanism for the high activity by catalyst Cu1.0-350 at a low temperature, in situ DRIFTS experiments were performed at 180 °C to detect the surface adsorption reaction of NH3 and NO + O2.The adsorptions of NH3 were conducted with the inlet gas of 500 ppm NH3/N2, which occurred after pretreatment in an N2 atmosphere at 300 °C and background collection at 180 °C. As shown in Fig. 11(a), the NH3 adsorption on CuxO/ASC was performed. As shown in Fig. 11(a), the NH3 adsorption on the catalyst resulted in the formation of several peaks originating from the NH4+ bound to Brønsted acid sites (1681–1900 cm−1, 1452 cm−1), NH3 coordinated on Lewis acid sites (1630–1070 cm−1), and weakly adsorbed NH3 (970 and 927 cm−1).21,37 In detail, the peak at 1681 and 1452 cm−1 present symmetric and asymmetric bending vibrations of NH4+ species after reaction with Brønsted acid sites.25,38 Peaks at 1627 and 1241 reveal the existence of NH3 coordinated to the Lewis acid sites. A strong peak is centered around 1525 cm−1, which can be assigned to the amide species (–NH2) and intermediates from the partial oxidation of NH3.39 Peaks at 970 and 927 cm−1 can be assigned to either gas phase or weakly adsorbed NH3.40 It has been demonstrated from NH3-TPD that Lewis acid sites are in the majority among acid sites, which is consistent with the in situ DRIFTS analyses.
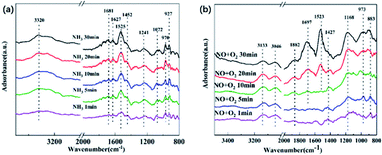 | ||
| Fig. 11 In situ DRIFTS spectra of the catalyst pre-treated in different flowing gas at 180 °C for various times: (a) 500 ppm NO/N2 + 3% O2 and (b) 500 ppm NH3/N2. | ||
The adsorptions of NO and O2 were conducted with the inlet gas of 500 ppm NO/N2 + 3% O2, which occurred after pretreatment in an N2 atmosphere at 300 °C and background collection at 180 °C. The absorption spectrum is shown in Fig. 11(b). After NO + O2 was purged in, the peak at 973 cm−1 assigned to C–O vibration in primary C–OH appears, owing to the ASC support.25 Due to gaseous or weakly adsorbed NO, one peak at 1882 cm−1 was found. The peak surrounding 1697 cm−1 reveals the weakly adsorbed NO2 molecules.41 The peak at 1523 cm−1 reveals the appearance of bidentate nitrate, and the one at 1427 cm−1 can be attributed to monodentate nitrate. The band observed at 1168 cm−1 can be assigned to cis-N2O22−, suggesting the improved oxidation of NO to NO2.42
In situ DRIFTS transient reactions were further performed. First, NH3/N2 flow was purged for 30 min and then shut down. Afterwards, NO + O2/N2 was switched on over the NH3-adsorbed samples to further probe the reaction mechanisms. The spectra are shown in Fig. 12(a). After NH3 pre-adsorption for 30 min, one can observe several NH3 adsorption species as described above, including NH4+ bound to Brønsted acid sites (1681–1900 cm−1, 1452 cm−1), NH3 coordinated on Lewis acid sites (1630–1070 cm−1), and weakly adsorbed NH3 (970 and 927 cm−1). After the reaction with NO + O2, an obvious change can be noticed. It is found that the peaks at 970 and 927 cm−1 corresponding to weakly adsorbed NH3 gradually disappeared after the inlet of NH3, which are active for NH3-SCR.11,38 The peaks at 1681 and 1452 cm−1 corresponding to NH4+ species after reaction with Brønsted acid sites also disappeared immediately after the purge of NO + O2, indicating the high reactivity of Brønsted acid sites. Instead, the peaks at 1627, 1525, and 1241 cm−1 remain stable, which is attributed to the intermediates related to the Lewis acid sites. Herein, we can speculate that Brønsted acid sites play a key role during NH3-SCR.
The order of purged flow was reversed to further evaluate the reactivity of the adsorbed nitrogen oxide species. The catalysts were first treated with NO + O2 for 30 min, and then NH3 was introduced for 30 min to observe the reactions among NO and the NH3-originated intermediates. The results are shown in Fig. 12(b). The pretreatment with NO + O2 results in the form of adsorbed NO2 (1697 cm−1), nitrate (1523 and 1427 cm−1), and nitrite (1168 cm−1) on the catalyst surface. After NH3 is switched in, most peaks of the NO-related species vanish immediately, suggesting that adsorbed NOx species on the catalyst surface participate in the SCR reaction. Meanwhile, new peaks at 1621, 1357, 1064, and 943 cm−1 can be observed, which represent the NH3 coordinated on Lewis acid sites, and weakly adsorbed NH3, respectively. Therefore, one can conclude that the adsorbed NO2, bridge nitrates, and nitrite are quite active during the SCR reactions of the prepared catalysts.
3.8 Catalytic mechanism discussion
The chemical mechanism and critical role species of the catalytic process were comprehensively explained by in situ DRIFTS and active adsorption site characterization of the best-performing catalyst Cu1.0-350. In combination with the characterizations by XPS and H2-TPR, one can observe that the transformation between Cu2+ and Cu+ can induce the variation of Oβ/(Oα+Oβ). The existence of metal ions can also affect the amount of acidic sites. In accordance with the in situ DRIFTS results, it is found that both the oxygen species and the acidic sites on the surface of catalysts play a significant role during the low temperature NH3-SCR reactions.43 The high content of Oβ and mobility of Oα guarantee the adsorption and activation site for NO into NO2, which promotes the proceeding of “fast SCR” reaction (NO + NO2 + 2NH3 → 2N2 + 3H2O).44 Consequently, the SCR reactions follow both the Langmuir–Hinshelwood (reaction between adsorbed NH3 and adsorbed NOx) and Eley–Rideal (reaction between adsorbed NH3 and gaseous NO).4. Conclusions
In summary, the reduction feature of semi-coke provides a new approach for regulating the valence of Cu. Multi-valence CuxO was loaded onto activated semi-coke through a simple impregnation–calcination method. By varying the concentration of the Cu(NO3)2 precursor, calcination atmosphere, and calcination temperature, the CuO|Cu2O/ASC heterostructure catalysts showed above 80% NH3-SCR activity in a temperature range of 100–200 °C (Cu1.0-350). The synergistic catalysis mechanism between Cu2O and CuO species was investigated based on the dual function of oxygen vacancies and acidic sites. The SCR reactions simultaneously follow both L–H and E–R mechanisms.Author contributions
Mei Zhang and Bo Peng conceived the idea and designed the experiments; Bo Peng and Zhao Meng conducted the experiments; Bo Peng analyzed the data and wrote the manuscript; Mei Zhang and Zheng Yan provided guidance on the manuscript preparation, modified the manuscript, and supervised the whole work; Shuoyang Liang and Hao Wang discussed and modified the manuscript.Conflicts of interest
There are no conflicts to declare.Acknowledgements
This work was financially supported by the National Natural Science Foundation of China (51672025, 51572020, 51372019), and Major Projects of Science and Technology in Shanxi Province (MC2016-03).References
- P. Forzatti, Appl. Catal., A, 2001, 222, 221–236 CrossRef CAS.
- T. Boningari, R. Koirala and P. G. Smirniotis, Appl. Catal., B, 2013, 140–141, 289–298 CrossRef CAS.
- D. Damma, D. K. Pappas, T. Boningari and P. G. Smirniotis, Appl. Catal., B, 2021, 287, 119939 CrossRef CAS.
- G. Qi and R. T. Yang, J. Catal., 2003, 217, 434–441 CrossRef CAS.
- D. Damma, P. Ettireddy, B. Reddy and P. Smirniotis, Catalysts, 2019, 9, 349 CrossRef CAS.
- H.-H. Tseng, M.-Y. Wey, Y.-S. Liang and K.-H. Chen, Carbon, 2003, 41, 1079–1085 CrossRef CAS.
- T. Boningari, D. K. Pappas and P. G. Smirniotis, J. Catal., 2018, 365, 320–333 CrossRef CAS.
- D. Damma, T. Boningari, P. R. Ettireddy, B. M. Reddy and P. G. Smirniotis, Ind. Eng. Chem. Res., 2018, 57, 16615–16621 CrossRef CAS.
- P. G. Smirniotis, D. A. Peña and B. S. Uphade, Angew. Chem., 2001, 40, 2479–2482 CrossRef CAS.
- Y. Xue, G. Lu, Y. Guo, Y. Guo, Y. Wang and Z. Zhang, Appl. Catal., B, 2008, 79, 262–269 CrossRef CAS.
- Q. Wang, H. Xu, W. Huang, Z. Pan and H. Zhou, J. Hazard. Mater., 2019, 364, 499–508 CrossRef CAS PubMed.
- J. Amanpour, D. Salari, A. Niaei, S. M. Mousavi and P. N. Panahi, J. Environ. Sci. Health, Part A: Toxic/Hazard. Subst. Environ. Eng., 2013, 48, 879–886 CrossRef CAS PubMed.
- Z. Gholami and G. Luo, Ind. Eng. Chem. Res., 2018, 57, 8871–8883 CrossRef CAS.
- Z. Zhu, Z. Liu, S. Liu, H. Niu, T. Hu, T. Liu and Y. Xie, Appl. Catal., B, 2000, 26, 25–35 CrossRef CAS.
- D. Yadav, A. R. Kavaiya, D. Mohan and R. Prasad, Bull. Chem. React. Eng. Catal., 2017, 12, 415–429 CrossRef CAS.
- G. Xie, Z. Liu, Z. Zhu, Q. Liu, J. Ge and Z. Huang, J. Catal., 2004, 224, 42–49 CrossRef CAS.
- Z. Xu, Y. Li, J. Guo, J. Xiong, Y. Lin and T. Zhu, Chem. Eng. J., 2020, 395, 125047 CrossRef CAS.
- X. Sun, P. He, Z. Gao, Y. Liao, S. Weng, Z. Zhao, H. Song and Z. Zhao, J. Colloid Interface Sci., 2019, 553, 1–13 CrossRef CAS PubMed.
- B. Peng, C. Feng, S. Liu and R. Zhang, Catal. Today, 2018, 314, 122–128 CrossRef CAS.
- Q. Li, H. Yang, Z. Ma and X. Zhang, Catal. Commun., 2012, 17, 8–12 CrossRef CAS.
- X. Wu, H. Meng, Y. Du, J. Liu, B. Hou and X. Xie, J. Catal., 2020, 384, 72–87 CrossRef CAS.
- Z. Yan, Y. Qu, L. Liu, X. Ge, J. Yang, L. Wei, T. Yang and X. Wang, Environ. Sci. Pollut. Res., 2017, 24, 24473–24484 CrossRef CAS PubMed.
- X. Zhu, L. Zhang, Y. Dong and C. Ma, Energy Fuels, 2021, 35, 6167–6178 CrossRef CAS.
- S. K. Ryu, W. K. Lee and S. J. Park, Carbon Lett., 2004, 5, 180–185 Search PubMed.
- J. Wang, Z. Yan, L. Liu, Y. Chen, Z. Zhang and X. Wang, Appl. Surf. Sci., 2014, 313, 660–669 CrossRef CAS.
- C. Marquez-Alvarez, I. Rodriguez-Ramos and A. Guerrero-Ruiz, Carbon, 1996, 34, 339–346 CrossRef CAS.
- T. Boningari, D. K. Pappas, P. R. Ettireddy, A. Kotrba and P. G. Smirniotis, Ind. Eng. Chem. Res., 2015, 54, 2261–2273 CrossRef CAS.
- R.-C. Wang and C.-H. Li, Acta Mater., 2011, 59, 822–829 CrossRef CAS.
- P. Ehrburger, J. M. Henlin and J. Lahaye, J. Catal., 1986, 100, 429–436 CrossRef CAS.
- Z. Qu, L. Miao, H. Wang and Q. Fu, Chem. Commun., 2015, 51, 956–958 RSC.
- T. H. Vuong, J. Radnik, J. Rabeah, U. Bentrup, M. Schneider, H. Atia, U. Armbruster, W. Grünert and A. Brückner, ACS Catal., 2017, 7, 1693–1705 CrossRef CAS.
- W. S. Kijlstra, D. S. Brands, E. K. Poels and A. Bliek, J. Catal., 1997, 171, 208–218 CrossRef CAS.
- Z. Li, Y.-Y. Niu, H.-Y. Zheng, T.-J. Fu, Q.-F. Zhu and L.-H. Yin, Chin. J. Inorg. Chem., 2011, 27, 1277–1284 CAS.
- Y. Inomata, H. Kubota, S. Hata, E. Kiyonaga, K. Morita, K. Yoshida, N. Sakaguchi, T. Toyao, K. I. Shimizu, S. Ishikawa, W. Ueda, M. Haruta and T. Murayama, Nat. Commun., 2021, 12, 557 CrossRef CAS PubMed.
- B. Afsin and M. Macit, Phys. Low-Dimens. Struct., 1998, 3, 191–198 Search PubMed.
- L. Yao, Q. Liu, S. Mossin, D. Nielsen, M. Kong, L. Jiang, J. Yang, S. Ren and J. Wen, J. Hazard. Mater., 2020, 387, 121704 CrossRef CAS PubMed.
- L. Lietti, I. Nova, G. Ramis, L. Dall'Acqua, G. Busca, E. Giamello, P. Forzatti and F. Bregani, J. Catal., 1999, 187, 419–435 CrossRef CAS.
- S. Yang, C. Wang, L. Ma, Y. Peng, Z. Qu, N. Yan, J. Chen, H. Chang and J. Li, Catal. Sci. Technol., 2013, 3, 161–168 RSC.
- B. Jiang, Z. Li and S.-c. Lee, Chem. Eng. J., 2013, 225, 52–58 CrossRef CAS.
- Z. Wu, B. Jiang, Y. Liu, H. Wang and R. Jin, Environ. Sci. Technol., 2007, 41, 5812–5817 CrossRef CAS PubMed.
- G. Ramis, Appl. Catal., 1990, 64, 259–278 CrossRef CAS.
- A. Martínez-Arias, J. Soria, J. C. Conesa, X. L. Seoane, A. Arcoya and R. Cataluña, J. Chem. Soc., Faraday Trans., 1995, 91, 1679–1687 RSC.
- X. Fang, Y. Liu, W. Cen and Y. Cheng, Ind. Eng. Chem. Res., 2020, 59, 14606–14615 CrossRef CAS.
- M. Bendrich, A. Scheuer, R. E. Hayes and M. Votsmeier, Appl. Catal., B, 2018, 222, 76–87 CrossRef CAS.
Footnote |
| † Electronic supplementary information (ESI) available. See DOI: 10.1039/d1ra07647g |
| This journal is © The Royal Society of Chemistry 2022 |

