 Open Access Article
Electrochemical reduction of NO catalyzed by boron-doped C60 fullerene: a first-principles study†
Nasibeh Saeidia,
Mehdi D. Esrafili *b and
Jaber Jahanbin Sardroodi
 a
a
aDepartment of Chemistry, Azarbaijan Shahid Madani University, Tabriz, Iran
bDepartment of Chemistry, Faculty of Basic Sciences, University of Maragheh, P. O. Box 55136-553, Maragheh, Iran. E-mail: esrafili@maragheh.ac.ir
First published on 21st January 2022
Abstract
The electrochemical reduction of nitrogen monoxide (NO) is one of the most promising approaches for converting this harmful gas into useful chemicals. Using density functional theory calculations, the work examines the potential of a single B atom doped C60 fullerene (C59B) for catalytic reduction of NO molecules. The results demonstrate that the NO may be strongly activated over the B atom of C59B, and that the subsequent reduction process can result in the formation of NH3 and N2O molecules at low and high coverages, respectively. Based on the Gibbs free energy diagram, it is inferred that the C59B has excellent catalytic activity for NO reduction at ambient conditions with no potential-limiting. At normal temperature, the efficient interaction between the *NOH and NO species might lead to the spontaneous formation of the N2O molecule. Thus, the findings of this study provide new insights into NO electrochemical reduction on heteroatom doped fullerenes, as well as a unique strategy for fabricating low-cost NO reduction electrocatalysts with high efficiency.
1. Introduction
The continual growth in the concentration of hazardous air pollutants is one of the most pressing concerns in today's modern world. Nitric monoxide (NO) is a main environmental pollutant generated by the burning of fossil fuels in different industrial processes and internal combustion engines.1,2 NO species in the atmosphere can interact with water molecules, resulting in acid rain, which has a detrimental impact on plants, forests, soil, buildings, and human health. Additionally, NO contributes to photochemical smog and ozone depletion.3 High NO concentrations can cause a variety of health issues in humans, including irritation of the eyes, nose, and mucous membranes. Hence, controlling NO emission and minimizing the atmospheric concentration of this toxic gas are critical to protect public health and the environment.4,5 Several effective ways for eliminating NO molecules from waste gases have been presented to achieve this goal.6–10 Recent studies, for example, have demonstrated that in the presence of visible light radiation, NO molecules may be readily oxidized over chemically doped TiO2 (ref. 9) and SnO2 (ref. 10) photocatalysts. The insertion of Fe (Ce) atoms in TiO2 (SnO2) was revealed to result in the formation of oxygen vacancies, which further facilitated NO deep oxidation under visible light irradiation.Electrochemical techniques are one of the most effective methods for addressing environmental and energy issues. Clearly, converting hazardous NO directly to NH3 via an environmentally friendly electrocatalytic reduction process not only prevents NO pollution, but the resultant product may also be used in industry. In the electrocatalytic reduction process, the type and nature of the catalyst is an important factor in improving reaction rate, lowering energy consumption and costs, and enhancing reaction selectivity.11 For the NO electrochemical reaction (NOER), different pure transition metals (TMs) such as Cu, Pt, Pd, and other electrocatalysts have been commonly employed.12–14 Although these metal surfaces have a high catalytic activity for NOER, the low utilization of atoms and poor long-term stability have limited their industrial applicability. As a result, it is critical to look for low-cost, high-efficiency alternative NOER electrocatalysts.
In recent years, single-atom catalysts (SACs) have emerged as a distinct branch of heterogeneous catalysts due to their high metal performance and long-term durability.15–18 SACs are also promising candidates for addressing the poor atom efficiency issues of bulk metals and metal clusters used in various electrocatalytic processes such as N2 fixation,19,20 O2 (ref. 21) and CO2 (ref. 22 and 23) reduction or hydrogen evolution reaction (HER).24,25 Numerous studies26–28 based on density functional theory (DFT) have also demonstrated the potential of such SACs for electrochemical NO molecule reduction. Wang et al.26 investigated the NO binding on various TM doped nitrogen incorporated graphene (TM = Sc–Cu, Mo, Rh, and Ru) and found that the Co atom is the most suitable SAC for the reduction of NO. Furthermore, their DFT calculations revealed that the following NOER process can generate either NH3 or N2O on the embedded CoN4 moiety, depending on the coverage of the NO molecules. Aside from the fact that the nature of the doped TM atom can influence the activation of the N–O bond of NO molecule, the geometry and electronic structure of the utilized support would have a significant impact on the catalytic activity and selectivity of the SACs.29 Generally, the defect-free supports are assumed to be intact to stabilize the deposited TM atoms. However, introducing various defect sites or chemical doping with heteroatoms might be a helpful approach for improving support-metal interaction and regulating the positive charge on the TM atom.30,31
Carbon nanostructures like fullerenes, nanotubes, and graphene have gained a lot of interest in the recent decade due to their unique chemical and physical characteristics.32–37 Buckminsterfullerene (C60) is an important member of the carbon fullerenes, composed of twenty six-membered and twelve five-membered carbon atom rings with sp2 hybridization. Because of its outstanding physicochemical characteristics and highly symmetrical structure, C60 and its derivatives are used in a number of applications, including hydrogen storage,38,39 solar cells,40,41 light emitting diodes42 and drug delivery.43–45 C60 may serve as both an electron donor and acceptor, and it can be used to detect and recognize dangerous gas molecules.46–48 Furthermore, chemical doping of heteroatoms like N, B, and Si into the C60 can result in significant structural and electronic deformation, causing to significant changes in its charge distribution, thermal stability, Fermi level, and band gap.49–51 For example, carbon-π electrons can be effectively activated by the insertion of a B atom into C60 because of charge transfer between B and its surrounding C atoms.52,53 Consequently, C59B may adsorb small gas molecules such as O2, CO, and N2O due to the buildup of high spin density and relatively large positive charges over the B atom.53–55 Likewise, the metal-free C59B is expected to be a very active catalyst for NO adsorption and electrochemical reduction. However, no theoretical or experimental studies on the catalytic reactivity of C59B for the NOER process have been conducted.
The aim of this investigation is to provide theoretical insights into the NOER mechanism over C59B fullerene. This study particularly addresses the following questions based on the DFT calculations: (1) how feasible is the using of the metal-free C59B electrocatalyst to reduce NO electrochemically? (2) What role does the B atom play in the catalytic activity of C59B? (3) Is it possible to use this electrocatalyst for NOER at room temperature?, and (4) Is the proposed C59B electrocatalyst selective for the NOER in the presence of the competing HER process? The findings of this work might help in the design and manufacture of highly active and low-cost NOER electrocatalysts based on carbon fullerenes.
2. Theoretical simulations
All geometry optimizations and electronic structure calculations were conducted by the DMol.3,56,57 The exchange-correlation effects were taken into account by the Perdew–Burke–Ernzerhof (PBE)58,59 density functional. The weak van der Waals interactions between adsorbates and C59B electrocatalyst were included using the Grimme's DFT+D2 scheme.59 A double numerical plus polarization function (DNP) basis set and the smearing value of 0.005 Ha were then specified in all calculations. The global orbital cut-off was determined to be 4.6 Å. The convergence thresholds were set to 10−5 Ha for energy, 0.001 Ha Å−1 for maximum force, and 0.005 for maximum displacement during the geometry optimization. To investigate the charge transfer in various species, the Hirshfeld charge population analysis60 was performed. There were no symmetry constraints during the structural optimization.For the DFT computations, a cubic box with dimensions a = b = c = 25 Å was utilized. To prepare the C59B electrocatalyst, a C atom was replaced with a B atom in the C60 structure. The formation energy (Eform) of C59B was computed to evaluate its stability according to the following equation:
| Eform = EC59B + μC − EC60 − μB | (1) |
| Eads = EX/C59B − EC59B − EX | (2) |
Here, EX/C59B, EC59B and EX refer to the energies of the adsorbate/substrate complex, isolated C59B and adsorbate molecules, respectively.
The computational hydrogen electrode (CHE) model developed by Nørskov and coworkers61 was used to investigate the electrochemical process. According to this approach, the Gibbs free energy (G) of a proton–electron pair (H+/e−) is equivalent to one-half of the free energy of an H2 molecule. The change in the Gibbs free energy (ΔG) was calculated for each reduction step using
| ΔG = ΔE + ΔEZPE − TΔS + ΔGpH + ΔGU | (3) |
Here, ΔE refers to the reaction energy, which is directly obtained from the DFT total energies at 0 K. For instance, the ΔE of NO adsorption over C59B could be characterized as
| ΔE = ENO/C59B − EC59B − ENO | (4) |
![[thin space (1/6-em)]](https://www.rsc.org/images/entities/char_2009.gif) 10, is the pH free energy correction. In the latter equation, kB is the Boltzmann constant and pH = 0 is considered for the acidic medium. The ΔGU term denotes the effect of the potential U on the system. The limiting potential (UL) for each pathway was calculated from the maximum free energy change (ΔGmax) using the equation UL = −ΔGmax/e. All DFT computations were carried out in a water solvent using the conductor-like screening model (COSMO)63 as implemented in DMol.3
10, is the pH free energy correction. In the latter equation, kB is the Boltzmann constant and pH = 0 is considered for the acidic medium. The ΔGU term denotes the effect of the potential U on the system. The limiting potential (UL) for each pathway was calculated from the maximum free energy change (ΔGmax) using the equation UL = −ΔGmax/e. All DFT computations were carried out in a water solvent using the conductor-like screening model (COSMO)63 as implemented in DMol.3
The ΔG value of the competing HER process was obtained by the following equation:64
| ΔG = ΔEH + 0.24 (in eV) | (5) |
| ΔEH = EC59BH − EC59B − ½(EH2) | (6) |
3. Results and discussion
3.1 C59B electrocatalyst
To understand the NOER mechanism over the C59B electrocatalyst, the geometry and electronic structure of C59B must first be addressed. The relaxed structures of pristine and B-doped C60 fullerenes as well as their density of states (DOS) plots are shown in Fig. 1. Because all of the carbon atoms in the C60 structure are symmetrically equivalent, there is only one way to incorporate a B atom into C60 to create the C59B structure. Doping of the B atom resulted in a small distortion around the dopant atom, which is consistent with the prior studies.55,65,66 As seen in Fig. 1, the C–C bond lengths surrounding the dopant atom are nearly equal to those of pure C60. This is due to the fact that the B atomic radius is nearly identical to that of the C atom. Furthermore, the triple-coordination feature of the B atom enables it to be readily inserted in the C60 structure. The B–C bond distances in C59B shared by two neighboring hexagons and the hexagon and pentagon rings are calculated to be 1.53 and 1.55 Å, respectively, which agree well with the other findings.53,54 According to eqn (1), C59B has a negative formation energy (−5.23 eV), suggesting that the B atom is well integrated into the C60 network. This negative value is also consistent with those found in previous DFT investigations,67–69 thus indicating that the C59B is thermodynamically stable. The insertion of the B atom into the C60 can result in electron density redistribution, particularly near the dopant atom. The B atom in C59B is positively charged by 0.10|e|, whereas each surrounding carbon atom has a negative charge of 0.06|e|. The DOS plots of the C60 and C59B fullerenes are shown in Fig. 1. The significant hybridization between the 2p orbitals of the B atom and those of adjacent C atoms should be the origin of the covalent B–C bonds in C59B. These findings, along with the substantial negative formation energy, ensure that C59B is very stable and may thus be utilized as a robust electrocatalyst for NO molecule reduction.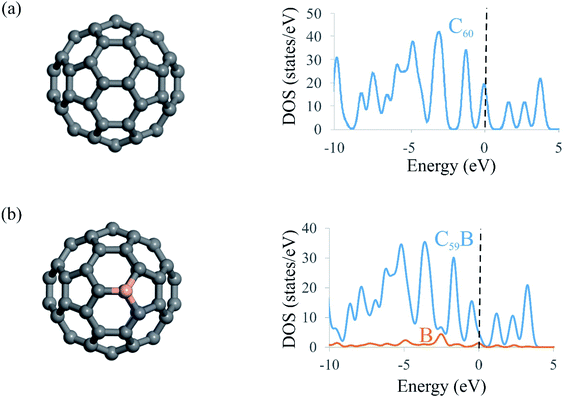 | ||
| Fig. 1 Optimized structures and DOS plots of (a) C60 and (b) C59B. The dashed line at E = 0 in DOS plots shows the Fermi level. | ||
3.2 Adsorption of NO over C59B
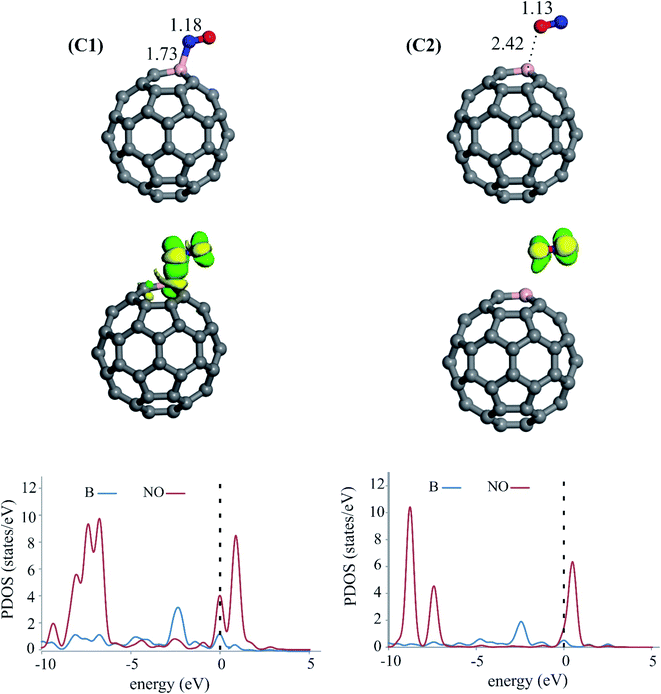
Since NO adsorption is regarded as a critical step in the NOER process, we then consider the adsorption behavior of this molecule on C59B. To this end, several initial adsorption configurations are thoroughly investigated, including those in which NO approaches the B or C atoms of C59B from its N or O sites (end-on) as well as from the N–O bond (side-on). The optimized adsorption structures, as well as the partial DOS (PDOS) plots and electron density difference (Δρ) maps, are depicted in Fig. 2. As can be observed, the NO molecule can be adsorbed onto the B atom of C59B through its N (complex C1) or O atoms (complex C2). The NO molecule is tilted over the C59B substrate in both configurations, with B–N and B–O bonding lengths of 1.73 and 2.42 Å, respectively. The calculated adsorption energy (Eads) values for the attachment of NO from its N atom is −0.93 eV, which is 0.71 eV more negative than that of from the O atom (Table 1). This indicates that the NO molecule is preferentially bonded to the B atom through the N atom. The charge analysis based on the Hirshfeld method shows that the formation of C1 and C2 complexes is associated with a shift of 0.13 and 0.35 electrons from the C59B surface into NO, respectively. In the adsorbed structures, the N–O bond distance is calculated to be 1.18 (C1) and 1.13 Å (C2), deviating slightly from the N–O bond of the isolated NO (1.16 Å). According to Table 1, the changes in the Gibbs free energy (ΔGads) due to the adsorption of the NO via its N and O sites are −0.21 and 0.50 eV, respectively. This means that, unlike C1, the formation of C2 is not possible at room temperature due to entropic effects. The PDOS analysis of C1 and C2 complexes reveals a remarkable mixing of the singly-occupied 2π* states of NO and the empty 2p state of the B. It can be also observed that the amount of such orbital hybridization in the complex C1 is more significant than C2, which is compatible with the Eads values previously stated. Furthermore, the Δρ maps in Fig. 2 show that there is a substantial buildup of electron density over the NO, whereas an electron density depletion region appears over the B atom. Clearly, the degree of electron density redistribution correlates well with the adsorption strength of NO molecule in C1 and C2 complexes. In other words, Δρ is more pronounced for C1 than in C2. According to these results, NO adsorption from its N-site is more energetically favorable than its O-site. This indicates that when exposed to C59B, the N atom of NO easily attaches to the B atom, activating the N–O bond for the subsequent NOER process.| Adsorbate | Eads (eV) | ΔGads (eV) | qCT (e) |
|---|---|---|---|
| NO (N-site) | −0.93 | −0.21 | 0.13 |
| NO (O-site) | −0.22 | 0.50 | 0.35 |
The adsorption of NO on the carbon atoms of C59B is also investigated, and it is revealed that NO is preferentially adsorbed through its N site. Fig. S1 of the ESI† displays the optimized structure of the two most stable configurations (complexes C3 and C4). As can be seen, the Eads value is modest in both cases, suggesting that NO adsorption over the C atoms of C59 is less likely. Furthermore, for these adsorption configurations, the ΔGads is positive. The PDOS analysis also confirms the physisorption of NO over the C atoms of C59B, where there exist weak hybridizations between the electronic states of NO and C59B. As a result, the B atom of C59 is the most favorable site for NO molecule adsorption.
3.3 NOER process
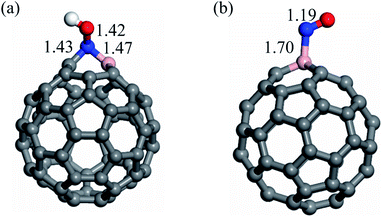
Previous studies13,70 have found that the concentration of NO molecules determines the most energetically favorable route and the final products of the NOER process. While NH3 is the major product at low NO coverage, N2O is the most favorable product at high NO coverage. As a result, we investigate the NOER process at both low and high NO coverages. However, before discussing the NOER process, the addition of H+ and e− to pre-adsorbed NO molecule must be examined separately, since recent studies have revealed that they may play a key role in the NO activation on photocatalysts.9,10 Fig. 3a and b show the optimized structure of the NOH+ and NO− adsorption configurations, respectively. According to our findings, the Eads value of NOH+ is −5.31 eV, which is considerably higher (more negative) than that of NO− (−4.62 eV). It should be noted that protonation of NO causes the B–C bond of C59B to be broken and the N atom of NO to be inserted between the B and C atoms. Furthermore, the Eads value for the adsorption of NOH+ and NO− species is substantially larger than that of neutral NO. This can be ascribed to the stability of the 5σ and 2π* states of NO, facilitating charge transfer between this molecule and C59B.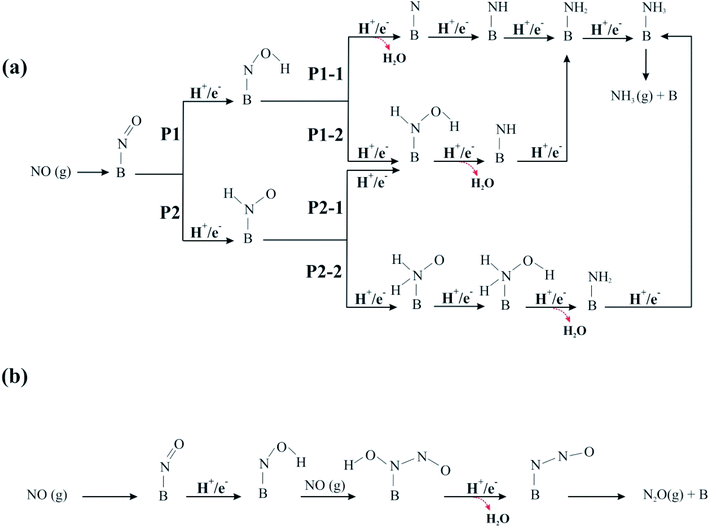 | ||
| Fig. 4 Schematic representation of possible reaction pathways for NOER process over C59B at (a) low and (b) high NO coverage. | ||
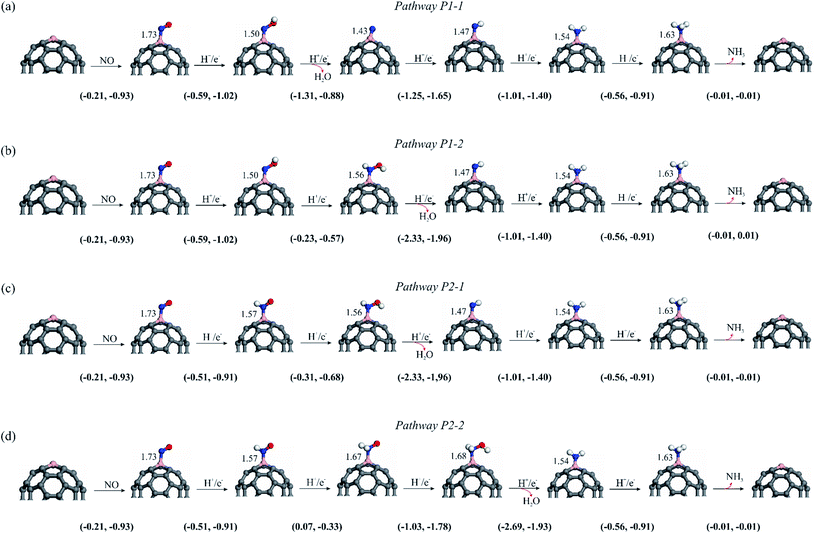
3.3.1.1 P1-1 pathway. The ΔG and ΔE values for each hydrogenation step of P1-1 pathway are shown in Fig. 5. Fig. S2 and S3† also depict the variation of ΔG and ΔE values during the NO reduction process, respectively. The N–O bond distance in the *NOH intermediate is calculated to be 1.42 Å, which is 0.26 Å larger than that of isolated NO. Furthermore, the binding distance between the B atom and *NOH is 1.50 Å, which is less than that found for *NO. The ΔE and ΔG values for obtaining *NOH are −1.02 and −0.59 eV, respectively, suggesting that this process is exothermic and thermodynamically feasible. In step 2, the O atom of *NOH is further hydrogenated to yield the H2O molecule, while the *N species remains over the B atom of the electrocatalyst with a *N–B bond distance of 1.43 Å. The reaction energy for this step is −0.88 eV, whereas the Gibbs free energy of the system is lowered by 1.31 eV owing to the detachment of the H2O molecule. After the H2O molecule is released, the third hydrogen is added to the remaining *N moiety, forming the *NH intermediate with ΔG and ΔE values of −1.25 and −1.65 eV, respectively. Continuous hydrogenation yields a *NH2 intermediate with the ΔE value of −1.40 eV. The associated free energy change of this step is −1.01 eV, according to Fig. 5. In the next step, *NH2 is hydrogenated to *NH3 molecule on top of the C59B substrate. This ΔE and ΔG values of this step are −0.91 and −0.56 eV, respectively. Lastly, because of its low free energy (−0.01 eV), the produced NH3 can be easily separated from the B atom.
3.3.1.2 P1-2 pathway. In pathway P1-2, the second hydrogen attaches the N atom of the *NOH and forms the *HNOH moiety. As indicated in Fig. 5, ΔG and ΔE values for this step are −0.23 and −0.57 eV, respectively. Note that the ΔG value for *HNOH formation is 1.08 eV smaller than that of *N species (−1.31 eV), making *HNOH formation less favorable. The addition of hydrogen atom to *NOH also causes the B–N bond elongate from 1.50 to 1.56 Å. The introduction of the third H+/e− pair then converts *HNOH into *NH and H2O species with a large negative ΔG value (−2.33 eV). The calculated ΔE of this step is −1.96 eV. Upon the attachment of the fourth hydrogen to the *NH intermediate, the *NH2 moiety is produced. The calculated ΔG and ΔE values for step 4 of the pathway are −1.01 and −0.91 eV, respectively. The hydrogenation process is continued in Fig. 4a in a way similar to that of pathway P1-1, and ΔG and ΔE have the same values (Fig. 5). Overall, comparing the free energy values acquired via the P1-1 and P1-2 clearly demonstrates that the former route is favored over the latter. This might be owing to the fact that the formation of the *N + H2O species (−1.31 eV) is more energetically favorable than the formation of *HNOH (−0.23 eV).
For the NOER through the P2 pathway, the N atom of the *NO species is hydrogenated by adding an H+/e− pair, and *HNO is produced over the C59B electrocatalyst. The B–N, N–O, and N–H bond lengths in the *HNO are 1.55, 1.24, and 1.04 Å, respectively, which are comparable to the B–N (1.50 Å), N–O (1.42 Å), and O–H (0.98 Å) bond lengths in the *NOH moiety. This step has a reaction energy of −0.91 eV and a free energy change of −0.51 eV. From a thermodynamic standpoint, the *NOH intermediate is preferable to the *HNO; hence, the *NOH is an important intermediate in the NOER process (Fig. S2 and S3 of ESI†). As shown in Fig. 4a, the *HNO intermediate can be hydrogenated via its O-site or N-site, and NOER can proceed by two distinct routes, P2-1 and P2-2.
3.3.1.3 P2-1 pathway. When the NOER proceeds through the P2-1 pathway, the second H+/e− pair is attached to the O atom of *HNO, giving the *HNOH with a ΔG value of −0.31 eV. In addition, the ΔE value corresponding to this step is −0.68 eV. The N–O and B–N bonds distances are calculated to be 1.38 and 1.57 Å, respectively. By continuing the reaction and reaching step 3, the O atom is hydrogenated with the third hydrogen, resulting in the formation of the H2O molecule. This corresponds to a release of 1.96 eV energy, whereas the Gibbs free energy of the system is lowered by 2.33 eV. As shown in Fig. 4a, the NH3 molecule is formed by successive hydrogenation of the remaining *NH moiety, with these steps being similar to those in the P1-2 route. The corresponding ΔG and ΔE values are shown in Fig. 5.
3.3.1.4 P2-2 pathway. In pathway P2-2, the N atom of *HNO is first hydrogenated to form *H2NO species. The free energy of the system increases by 0.07 eV, whereas about 0.30 eV energy releases in this step. The hydrogenation of the *H2NO in the next step results in the formation of the *H2NOH moiety with a free energy change of −1.03 eV. This reaction step is also exothermic, with ΔE = −1.78 eV. The addition of another H atom to *H2NOH can then lead to formation of *NH2 and H2O species. This step releases a significant amount of energy (1.93 eV), with the associated large free energy change (−2.69 eV). Finally, hydrogenation of the *NH2 yields the *NH3 molecule, whose ΔG and ΔE values are similar to those of the other three previously described routes (Fig. 5). The second hydrogenation in the P2-2 route is endothermic, whereas the other elementary steps are exothermic. As a result, *H2NO formation might be considered as the potential-limiting step. The corresponding UL value is much lower than that of the NOER on the B-graphene,71 Si–N4/graphene,28 Co–N4/graphene70 and Cu decorated g-C3N4.72 Furthermore, a comparison of the P2-1 and P2-2 routes indicates that the ΔG and ΔE values due to the formation of *H2NO (+0.07 and −0.33 eV) are significantly smaller than those of *HNOH (−0.31 and −0.68 eV); hence, formation of the *HNOH is more favorable from an energy viewpoint.
As shown in Fig. 5, the ΔG value for all reaction steps involved in the P1 pathway is negative. Also, the formation of the water molecule in the P1-2 channel is associated with the largest (more negative) ΔG. Except for the *H2NO formation in P2-2, the ΔG value for each reaction step in the P2 pathway is negative. This indicates that the latter step cannot take place under normal conditions. Furthermore, because the first hydrogenation step of *NO is crucial in initiating the NO reduction, the ΔG values of both processes are compared. The ΔG value for the first hydrogenation step of *NO via the P1 route is found to be slightly more negative than that of P2. This indicates that the formation of the *HNO moiety is more thermodynamically favorable than that of the *NOH. As a result, the NOER should proceed through *HNO formation, and the P1 would be the primary reaction route to generate NH3 molecules over the C59B catalyst.
3.4 HER process
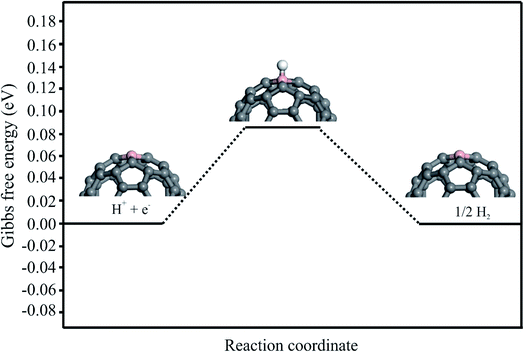
The HER process is also investigated to evaluate the selectivity of the proposed electrocatalyst. The HER involves the reduction of H+ ions on the cathode, which results in the formation and evaluation of H2 molecules (H+ + e− → ½H2). The Gibbs free energy diagram for the H+ + e− → ½H2 over the C59B is shown in Fig. 7. The adsorption energy of the H atom adsorbed on the B atom of C59B is calculated to be −0.15 eV, which is significantly lower than that of the NO molecule. This shows that the B atom of C59B has a higher affinity for NO molecule adsorption than the H atom. Moreover, the calculated ΔG value derived by the eqn (5) is positive (+0.09 eV), suggesting that the HER process cannot be completed at normal temperature. As a result, in addition to having a high catalytic activity, our proposed electrocatalyst is also selective for the NOER process.4. Conclusions
To conclude, we evaluated the potential of C59B as an active metal-free electrocatalyst for the NOER process using the DFT methodology. According to the calculated formation energy, a B atom may be stably inserted into the C60 fullerene, forming three covalent B–C bonds with the adjacent C atoms. The computed free energy values of each elementary step revealed that *NOH is a major species at low NO molecule coverages and NH3 is the main product, with the P1-1 route being the favored one with no limiting potential. Furthermore, the efficient interaction of *NOH and NO species can result in the production of the N2O molecule, which is thermodynamically favored under mild conditions. C59B might be a viable candidate for the NOER based on a set of factors such as high stability, exceptional catalytic activity, free limiting potential, and high performance. Hence, the findings of the current study can be used to design fullerene-based SACs for the electrochemical reduction of NO pollutants.Conflicts of interest
There are no conflicts to declare.References
- J. Lancaster Jr, Nitric Oxide: Principles and Actions, Elsevier, 1996 Search PubMed.
- D. A. Vallero, Air Pollution: Atmospheric Wastes, in Waste, Academic Press, 2019, pp. 453–475 Search PubMed.
- S. Roy and A. Baiker, Chem. Rev., 2009, 109, 4054–4091 CrossRef CAS PubMed.
- V. Rosca, M. Duca, M. T. de Groot and M. T. Koper, Chem. Rev., 2009, 109, 2209–2244 CrossRef CAS PubMed.
- M. Duca and M. T. Koper, Energy Environ. Sci., 2012, 5, 9726–9742 RSC.
- M. F. Irfan, J. H. Goo and S. D. Kim, Appl. Catal., B, 2008, 78, 267–274 CrossRef CAS.
- A. A. Verma, S. A. Bates, T. Anggara, C. Paolucci, A. A. Parekh, K. Kamasamudram, A. Yezerets, J. T. Miller, W. N. Delgass and W. F. Schneider, J. Catal., 2014, 312, 179–190 CrossRef CAS.
- M. D. Esrafili and N. Saeidi, Superlattices Microstruct., 2015, 81, 7–15 CrossRef CAS.
- G. Cheng, X. Liu, X. Song, X. Chen, W. Dai, R. Yuan and X. Fu, Appl. Catal., B, 2020, 277, 119196 CrossRef CAS.
- X. Song, G. Qin, G. Cheng, W. Jiang, X. Chen, W. Dai and X. Fu, Appl. Catal., B, 2021, 284, 119761 CrossRef CAS.
- Z. W. Seh, J. Kibsgaard, C. F. Dickens, I. Chorkendorff, J. K. Nørskov and T. F. Jaramillo, Science, 2017, 355, 6321 CrossRef PubMed.
- A. De Vooys, M. Koper, R. Van Santen and J. Van Veen, J. Catal., 2001, 202, 387–394 CrossRef CAS.
- I. Katsounaros, M. C. Figueiredo, X. Chen, F. Calle-Vallejo and M. T. Koper, ACS Catal., 2017, 7, 4660–4667 CrossRef CAS.
- J. Long, S. Chen, Y. Zhang, C. Guo, X. Fu, D. Deng and J. Xiao, Angew. Chem., 2020, 132, 9798–9805 CrossRef.
- S. Yang, J. Kim, Y. J. Tak, A. Soon and H. Lee, Angew. Chem., 2016, 55, 2058–2062 CrossRef CAS PubMed.
- Y. Qu, Z. Li, W. Chen, Y. Lin, T. Yuan, Z. Yang, C. Zhao, J. Wang, C. Zhao and X. Wang, Nat. Catal., 2018, 1, 781 CrossRef CAS.
- J. Gu, C.-S. Hsu, L. Bai, H. M. Chen and X. Hu, Science, 2019, 364, 1091–1094 CrossRef CAS PubMed.
- X. Li, H. Rong, J. Zhang, D. Wang and Y. Li, Nano Res., 2020, 13, 1842–1855 CrossRef CAS.
- C. Ling, X. Bai, Y. Ouyang, A. Du and J. Wang, J. Phys. Chem. C, 2018, 122, 16842–16847 CrossRef CAS.
- D. Ma, Z. Zeng, L. Liu, X. Huang and Y. Jia, J. Phys. Chem. C, 2019, 123, 19066–19076 CrossRef CAS.
- L. Wang, H. Dong, Z. Guo, L. Zhang, T. Hou and Y. Li, J. Phys. Chem. C, 2016, 120, 17427–17434 CrossRef CAS.
- Z. Wang, J. Zhao and Q. Cai, Phys. Chem. Chem. Phys., 2017, 19, 23113–23121 RSC.
- H. He and Y. Jagvaral, Phys. Chem. Chem. Phys., 2017, 19, 11436–11446 RSC.
- H. Wu, X. Li, R. Zhang and J. Yang, J. Mater. Chem. A, 2019, 7, 3752–3756 RSC.
- X. Lv, W. Wei, P. Zhao, D. Er, B. Huang, Y. Dai and T. Jacob, J. Catal., 2019, 378, 97–103 CrossRef CAS.
- Z. Wang, J. Zhao, J. Wang, C. R. Cabrera and Z. Chen, J. Mater. Chem. A, 2018, 6, 7547–7556 RSC.
- Q. Wu, W. Wei, X. Lv, Y. Wang, B. Huang and Y. Dai, J. Phys. Chem. C, 2019, 123, 31043–31049 CrossRef CAS.
- N. Saeidi, M. D. Esrafili and J. J. Sardroodi, Appl. Surf. Sci., 2021, 544, 148869 CrossRef CAS.
- J. Zhang, H. Yang and B. Liu, Adv. Energy Mater., 2021, 11, 2002473 CrossRef CAS.
- M. D. Esrafili and P. Mousavian, Int. J. Quantum Chem., 2019, 119, e25857 CrossRef.
- D. A. Bulushev, A. D. Nishchakova, S. V. Trubina, O. A. Stonkus, I. P. Asanov, A. V. Okotrub and L. G. Bulusheva, J. Catal., 2021, 402, 264–274 CrossRef CAS.
- J. Li and Y. Lu, Nano Lett., 2003, 3, 929 CrossRef CAS.
- L. A. Ponomarenko, F. Schedin, M. I. Katsnelson, R. Yang, E. W. Hill, K. S. Novoselov and A. K. Geim, Science, 2008, 320, 356–358 CrossRef CAS PubMed.
- G. Otero, G. Biddau, C. Sánchez-Sánchez, R. Caillard, M. F. López, C. Rogero, F. J. Palomares, N. Cabello, M. A. Basanta and J. Ortega, Nature, 2008, 454, 865 CrossRef CAS PubMed.
- L. Dai, D. W. Chang, J. B. Baek and W. Lu, Small, 2012, 8, 1130–1166 CrossRef CAS PubMed.
- Y. Fujimoto and S. Saito, J. Appl. Phys., 2014, 115, 153701 CrossRef.
- Y. Tang, X. Dai, Z. Yang, Z. Liu, L. Pan, D. Ma and Z. Lu, Carbon, 2014, 71, 139–149 CrossRef CAS.
- D. S. De, J. A. Flores-Livas, S. Saha, L. Genovese and S. Goedecker, Carbon, 2018, 129, 847–853 CrossRef CAS.
- Y. Zhao, Y.-H. Kim, A. Dillon, M. Heben and S. Zhang, Phys. Rev. Lett., 2005, 94, 155504 CrossRef PubMed.
- C. H. Woo, B. C. Thompson, B. J. Kim, M. F. Toney and J. M. Fréchet, J. Am. Chem. Soc., 2008, 130, 16324–16329 CrossRef CAS PubMed.
- Y. He, H.-Y. Chen, J. Hou and Y. Li, J. Am. Chem. Soc., 2010, 132, 1377–1382 CrossRef CAS PubMed.
- Y. Yuan, S. Han, D. Grozea and Z. H. Lu, Appl. Phys. Lett., 2006, 88, 093503 CrossRef.
- J. Shi, H. Zhang, L. Wang, L. Li, H. Wang, Z. Wang, Z. Li, C. Chen, L. Hou and C. Zhang, Biomaterials, 2013, 34, 251–261 CrossRef CAS PubMed.
- Y. Liu, Y. Pu, L. Sun, H. Yao, B. Zhao, R. Zhang and Y. Zhang, J. Biomed. Nanotechnol., 2016, 12, 1393–1403 CrossRef CAS PubMed.
- S. Bashiri, E. Vessally, A. Bekhradnia, A. Hosseinian and L. Edjlali, Vacuum, 2017, 136, 156–162 CrossRef CAS.
- J. A. Rather and K. De Wael, Sens. Actuators, B, 2013, 176, 110–117 CrossRef CAS.
- S. Sutradhar and A. Patnaik, Sens. Actuators, B, 2017, 241, 681–689 CrossRef CAS.
- M. D. Esrafili and N. Mohammadirad, Mol. Phys., 2017, 115, 1633–1641 CrossRef CAS.
- M. K. Hazrati and N. L. Hadipour, Phys. Lett. A, 2016, 380, 937–941 CrossRef CAS.
- M. Moradi, M. Nouraliei and R. Moradi, Phys. E, 2017, 87, 186–191 CrossRef CAS.
- R. Bagheri, M. Babazadeh, E. Vessally, M. Es'haghi and A. Bekhradnia, Inorg. Chem. Commun., 2018, 90, 8–14 CrossRef CAS.
- M. Ganji and H. Yazdani, Chin. Phys. Lett., 2010, 27, 043102 CrossRef.
- C. Ramachandran, J. Phys. Chem. A, 2017, 121, 1708–1714 CrossRef PubMed.
- M. D. Esrafili and S. Heidari, Comput. Theor. Chem., 2019, 1151, 50–57 CrossRef CAS.
- M. D. Esrafili and S. Heydari, ChemistrySelect, 2019, 4, 2267–2274 CrossRef CAS.
- B. Delley, J. Chem. Phys., 1990, 92, 508–517 CrossRef CAS.
- B. Delley, J. Chem. Phys., 2000, 113, 7756–7764 CrossRef CAS.
- J. P. Perdew, K. Burke and M. Ernzerhof, Phys. Rev. Lett., 1996, 77, 3865–3868 CrossRef CAS PubMed.
- S. Grimme, J. Comput. Chem., 2006, 27, 1787–1799 CrossRef CAS PubMed.
- C. Fonseca Guerra, J. W. Handgraaf, E. J. Baerends and F. M. Bickelhaupt, J. Comput. Chem., 2004, 25, 189–210 CrossRef PubMed.
- J. K. Nørskov, J. Rossmeisl, A. Logadottir, L. Lindqvist, J. R. Kitchin, T. Bligaard and H. Jonsson, J. Phys. Chem. B, 2004, 108, 17886–17892 CrossRef.
- R. D. Johnson, http://srdata.nist.gov/cccbdb, 2006.
- A. Klamt and G. Schüürmann, J. Chem. Soc., Perkin Trans. 2, 1993, 2, 799–805 RSC.
- J. K. Nørskov, T. Bligaard, A. Logadottir, J. Kitchin, J. G. Chen, S. Pandelov and U. Stimming, J. Electrochem. Soc., 2005, 152, J23 CrossRef.
- Q. Z. Li, J. J. Zheng, J. S. Dang and X. Zhao, ChemPhysChem, 2015, 16, 390–395 CrossRef CAS PubMed.
- Y. Wang, M. Jiao, W. Song and Z. Wu, Carbon, 2017, 114, 393–401 CrossRef CAS.
- X. Chen, J. Chang and Q. Ke, Carbon, 2018, 126, 53–57 CrossRef CAS.
- M. D. Esrafili and H. Janebi, Mol. Phys., 2020, 118, e1631495 CrossRef.
- M. D. Esrafili, A. A. Khan and P. Mousavian, RSC Adv., 2021, 11, 22598–22610 RSC.
- Z. Wang, J. Zhao, J. Wang, C. R. Cabrera and Z. Chen, J. Mater. Chem. A, 2018, 6, 7547–7556 RSC.
- S. Ji and J. Zhao, New J. Chem., 2018, 42, 16346–16353 RSC.
- Q. Wu, W. Wei, X. Lv, Y. Wang, B. Huang and Y. Dai, J. Phys. Chem. C, 2019, 123, 31043–31049 CrossRef CAS.
Footnote |
| † Electronic supplementary information (ESI) available. See DOI: 10.1039/d1ra07403b |
| This journal is © The Royal Society of Chemistry 2022 |

