DOI:
10.1039/D1RA07351F
(Paper)
RSC Adv., 2022,
12, 4536-4542
A highly selective and sensitive spectrofluorimetric method for the assessment of 3-nitrotyrosine in serum using (Eu(TTA)3Phen) photo probe
Received
2nd October 2021
, Accepted 22nd January 2022
First published on 3rd February 2022
Abstract
A simple, accurate and fast method was developed for the assessment of 3-nitrotyrosine as a biomarker for the early diagnosis of liver cirrhosis with minimal hepatic encephalopathy (MHE) using a (Eu(TTA)3Phen) photo probe. 3-Nitrotyrosine can remarkably quench the luminescence intensity of the (Eu(TTA)3Phen) complex in DMSO at pH = 9 and λem = 617 nm. The quenching of the luminescence intensity of (Eu(TTA)3Phen) complex particularly the electrical emission band at λem = 617 nm is used for the assessment of 3-nitrotyrosine in different serum samples of patients with liver cirrhosis.
1. Introduction
3-Nitrotyrosine has an IUPAC name ((2S)-2-amino-3-(4-hydroxy-nitrophenyl)propanoic acid), Fig. 1a. Hepatic encephalopathy is a brain dysfunction caused by acute or chronic liver disease. It is of two types: overt and covert type. The overt type is characterized by bedside characteristic clinical features and does not need sophisticated investigations for diagnosis.1 Covert or minimal hepatic encephalopathy (MHE) is characterized by an examination of normal mental and neurological status. It can be diagnosed by sophisticated psychometric tests, e.g., paper-and-pencil psychometric tests, inhibitory control test, critical flicker frequency and the stroop smartphone application.2,3 Up to 80% of patients with cirrhosis have MHE. Its presence is associated with poor quality of life, inability to drive, traffic violation and accidents. Within 3 years, ∼50% may develop overt hepatic encephalopathy.1,4 MHE is commonly found with advanced liver disease, history of overt hepatic encephalopathy, esophageal varices and alcohol abuse as etiology of liver cirrhosis.5
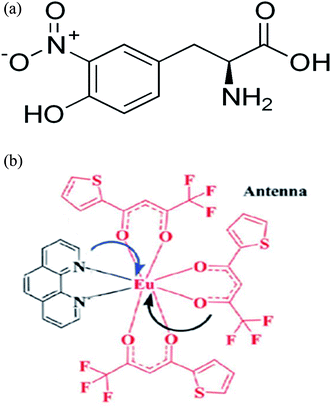 |
| | Fig. 1 (a) Structure of 3-nitrotyrosine. (b) Structure of Eu (TTA)3phen. (TTA = thenoyl trifluoro acetone, phen = 1,10-phenanthroline). | |
It is probable that MHE is a marker of advanced liver failure because it is associated with a shorter survival time, particularly among patients with high concentrations of ammonia after oral glutamine load.6,7 For this reason, MHE has been proposed as an indication for liver transplantation. Currently, the “gold standard” for the diagnosis of MHE is the psychometric hepatic encephalopathy score (PHES).8 However, “gold standard” method is time consuming and needs adjusting for time. Therefore, MHE is not routinely diagnosed in most clinical settings because of lack of simple procedures, and most patients with MHE remain undiagnosed and untreated. Hence, there is a need for a simple diagnostic test that can be performed routinely in the laboratory to detect MHE in patients with liver cirrhosis. It would be useful to have some peripheral biomarkers that could be measured in blood samples and reflect the presence of MHE in cirrhotic patients in clinical practice. In the last decade, 3-nitrotyrosine has been used as a marker for MHE.7 There are many different methods for the determination of 3-nitrotyrosine such as, gas chromatography-mass spectrometry (GC-MS)9–12 or LC-MS13–18 analysis or on affinity approaches (immunoassays).19,20 For a non-derivative analysis, either LC-MS or affinity approaches can be used. However, both techniques have their limitations as well. Most LC-MS methods have an additional step of purifying obtained extracts using a solid-phase extraction (SPE) technique,13–16 hence increasing costs and time required for sample preparation. Regarding immunoassays, the biggest concern is their insufficient selectivity and specificity due to cross-reactivity with 3-nitrotyrosine and other structurally similar metabolites,21,22 but the immunoassay sensitivity is not optimal either.23 These shortcomings make it difficult to compare the immunoassay results obtained in different studies.23 In this study, 3-nitrotyrosine was determined by the quenching of the luminescence intensity of the Eu(TTA)3Phen photo probe at λem = 617 nm in the presence of different concentrations of 3-nitrotyrosine in the blood serum samples of patients with MHE.
2. Experimental
2.1. Apparatus
The absorption spectra were recorded on a double beam PerkinElmer Lambda 25 UV-visible spectrophotometer fitted with a tungsten halogen lamp for operation in the visible range and a deuterium lamp for operation in the UV range. All luminescence measurements were recorded on a Meslo-PN (222-263000) Thermo Scientific Lumina fluorescence spectrometer in the range of 190–900 nm. The pH was measured using a pHs-JAN-WAY 3040 research pH meter. The separation of serum samples was carried out by centrifuging the sample for 15 min at 4000 rpm.
2.2. Materials
Pure standards, 3-nitrotyrosine, phenylalanine, valine, tyrosine, tryptophan, citrulline, albumin, glucose, urea and methionine were purchased from Sigma Aldrich. Human serum samples were collected from two hospitals, namely Al-Kasr-EL-Aini new teaching hospital (Cairo, Egypt) and Ain Shams Specialized Hospital (Cairo, Egypt). Sample collection was performed in accordance with WHO (World Health Organization) approved protocol for human specimen collection. All experiments were performed in accordance with the Guidelines “Ministry of Health and Population, Egypt” and approved by the ethics committee at “Ain Shams” university. Informed consents were obtained from the human participants of this study.
2.3. Preparation of standard solutions
A stock solution of 3-nitrotyrosine (1.0 × 10⁻³ mol L−1) was freshly prepared by dissolving 5.60 mg in 25 mL pure DMSO. A more diluted solution (1.0 × 10⁻⁵, 1.0 × 10⁻⁷ mol L−1) was prepared by appropriate dilution with DMSO. Stock and working solutions are stored at 4 °C when not in use. An Eu3+ ion stock solution (1.0 × 10⁻⁴ mol L−1) was prepared by dissolving 2.47 mg Eu(TTA)3Phen in a small amount of deionized water and the volume was completed to the mark in a 25.0 mL measuring flask. The pH was adjusted to 8.24 using a phosphate buffer solution. The above-mentioned working solutions were used for the subsequent measurements of absorption spectra, emission spectra, effect of pH and solvents. The fluorescence intensity was measured at λex/λem = 375/617 nm.
2.4. Calibration curve
After the preparation of the solution of 3-nitrotyrosine in DMSO as described above, 1.0 mL of the photo probe Eu(TTA)3Phen was put in the cell and different concentrations of 3-nitrotyrosine were added to the cell of the spectrofluorimetric device, followed by recording the luminescence spectra at the selected excitation wavelength λem = 617 nm.
2.5. Proposed method
The blood was allowed to clot by leaving it 20 min undisturbed at room temperature. The clot was removed by centrifugation at 4000 rpm for 15 min and then the supernatant was decanted, which was designated as serum. The serum was transferred into a clean tube and then kept at −20 C. Furthermore, 100 μL of the serum was added to 1.00 mL of Eu3+ stock solution (1.0 × 10⁻⁵ mol L−1) in DMSO and the pH was adjusted to 8.24 in the cell of the spectrofluorimetric device. The luminescence intensity of the Eu3+ photo probe was measured before and after the addition of the serum solution. The change in the luminescence intensity was used for the determination of 3-nitrotyrosine in the serum sample.
2.6. Standard method
2.6.1 Assay principle. A 3-nitrotyrosine quantitation kit used was a competitive ELISA. The unknown protein nitrotyrosine sample or nitrated BSA standards were first added to a nitrated BSA preabsorbed EIA plate. After a brief incubation, an anti-nitrotyrosine antibody was added, followed by an HRP conjugated secondary antibody. The protein nitrotyrosine content in an unknown sample was determined by comparing with a standard curve that was prepared from predetermined nitrated BSA standards.
2.6.2 Assay protocol. All reagents were prepared and mixed thoroughly before use. Each protein sample including nitrated BSA and blank were assayed in duplicate. 50.0 μL of the unknown protein sample or nitrated BSA standard were added to the wells of the EIA plate. The samples were incubated at room temperature for 10 min on an orbital shaker. 50 μL of the diluted anti-nitrotyrosine antibody was added to each well and incubated at room temperature for 1.0 hours on an orbital shaker. Micro well strips were washed 3 times with 250 μL Wash Buffer per well with thorough aspiration between each wash. After the last wash, the wells were emptied and tapped micro well strips on an absorbent pad or paper towel to remove excess Wash Buffer. 100 μL of the diluted secondary antibody–enzyme conjugate was added to all the wells. The wells were incubated at room temperature for 1 h on an orbital shaker. Micro well strips were washed 3 times according to step 4 above, and we proceeded immediately to the next step. The substrate solution should be warmed to 30 °C. 100 μL of the substrate solution was added to each well, including the blank wells. The wells were incubated at room temperature on an orbital shaker. Actual incubation time varied from 2.0–30 min. The enzyme reaction was stopped by adding 100 μL of the Stop Solution into each well, including the blank wells. Results were read immediately (color will fade over time). The absorbance of each micro well was read on a spectrophotometer using 450 nm as the primary wavelength.
3. Results and discussion
3.1. Absorption and emission spectra
The absorption spectra of Eu(TTA)3Phen complex, 3-nitrotyrosine and 3-nitrotyrosine in the presence of the photo probe are shown in Fig. 2. The absorption spectrum of (1.0 × 10⁻⁵mol L−1) [Eu(TTA)3Phen] shows (π → π*) transition band at 345 nm. Upon the addition of (1.0 × 10⁻⁵ mol L−1) of 3-nitrotyrosine, no shift was observed in the band. This indicates that no complexation between the photo probe and 3-nitrotyrosine in the ground state occurred. The characteristic peaks of Eu3+ ion appear at (5D0 → 7F0 = 580 nm, 5D0 → 7F1 = 590 nm, 5D0 → 7F2 = 617 nm, 5D0 → 7F3 = 650 nm, 5D0 → 7F4 = 690 nm and 5D0 → 7F5 = 710), as shown in Fig. 3.24–29 The effect of the solvent on the luminescence intensity of the photo probe [Eu(TTA)3Phen] was studied under the conditions optimized above. The high luminescence intensity of the photo probe was observed in aprotic solvents such as DMSO and DMF than in protic solvents such as ethanol. This could be attributed to the efficient quenching of the excited state of the photo probe by interactions with high-energy vibration oscillators such as O–H groups, as shown in Fig. 3.30–36 The pH of the medium has a great effect on the luminescence intensity of the [Eu(TTA)3Phen] complex. The pH meter has been adjusted using the phosphate buffer solution (Na2HPO4). The pH has been adjusted using NH4OH and HCl solutions. The optimum pH value where the peak at λem = 617 nm has the highest intensity was obtained at pH = 8.24, as presented in Fig. 4. The validity and selectivity photo probe Eu(TTA)3Phen to 3-nitrotyrosine was tested by studying the influence of a series of interfering species such as, NaCl, KCl (2.0 × 10⁻³ mol L−1), albumin (0.7 g L−1), uric acid (0.08 g L−1), urea (0.06 g L−1), total protein (0.01 g L−1), (0.06 g L−1) triglyceride, glucose (0.08 g L−1) and (1.0 × 10⁻⁴ mol L−1) of each amino acids such as, tyrosine, tryptophan, phenylalanine, valine, citrulline and methionine on the luminescence spectrum of Eu(TTA)3Phen in the presence of (1.0 × 10⁻⁵ mol L−1) 3-nitrotyrosine. The tolerable limit was defined as the concentration of the individually added species causing a deviation less than 5.0% of the luminescence intensity of the Eu(TTA)3Phen photo probe at the optimum conditions. The results indicated no significant change in the luminescence intensity of the Eu(TTA)3Phen photo probe, as shown in Fig. 5. The luminescence emission spectrum of the photo probe exhibits a strong luminescence intensity band at 617 nm with a broad and structureless shape. The emission spectra of [Eu(TTA)3Phen] complex in different concentrations of 3-nitrotyrosine is shown in Fig. 6. After the addition of different concentrations of 3-nitrotyrosine to [Eu(TTA)3Phen] in DMSO, the intensity of the characteristic peak at λem = 617 nm of Eu3+ was quenched, which indicates that 3-nitrotyrosine is a good quencher of the luminescent Eu3+ complex. A correlation between the emission intensity of the photo probe [Eu(TTA)3Phen] complex at λem 617 nm and 3-nitrotyrosin was obtained by applying the Stern–Völmer plot in with (FO/F − 1) versus [3-nitrotyrosine];37 where, κsv is the Stern–Völmer constant, which is determined from the slope of the fitted data and equals to 0.0148 L mol−1. One over κsv equals to C1/2 (half quenching concentration), C1/2 = 1/κsv = 67.56 mol L−1. R0 is the critical transfer distance, which is the average distance between the donor and the acceptor at which the probability of fluorescence quenching is just equal to 0.5 excited state, R0 = 7.35/(C1/2)1/3 = 1.81 Å, indicating the electron transfer mechanism of quenching (Fig. 7). A linear correlation was found between (FO/F − 1) at λem = 617 nm, and the concentration of 3-nitrotyrosine in the ranges given in Table 1 and the regression parameters are summarized in Table 1. The limit of detection (LOD) and quantitation (LOQ) were also calculated according to ICH guidelines38–42] and presented in Table 1.
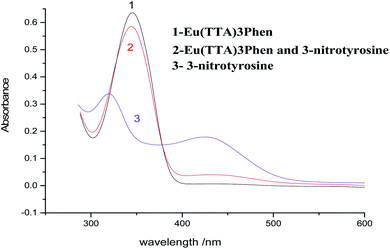 |
| | Fig. 2 Absorption spectra of (1.0 × 10⁻⁵ mol L−1) photo probe and 3-nitrotyrosine. | |
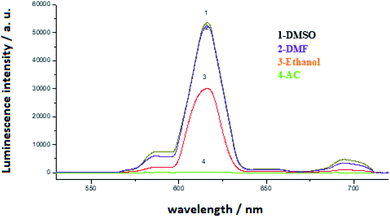 |
| | Fig. 3 Luminescence emission spectra of (1.0 × 10⁻⁵ mol L−1) Eu(TTA)3phen in different solvents. | |
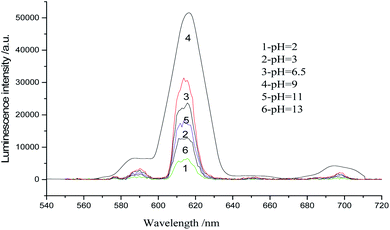 |
| | Fig. 4 Luminescence emission spectra of (1.0 × 10⁻⁵ mol L−1) Eu(TTA)3phen in DMSO at different pH values. | |
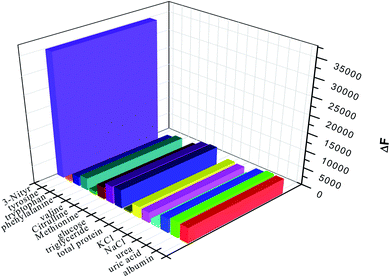 |
| | Fig. 5 Effect of foreign species on the selectivity of the photo probe Eu(TTA)3Phen to 3-nitrotyrosine. | |
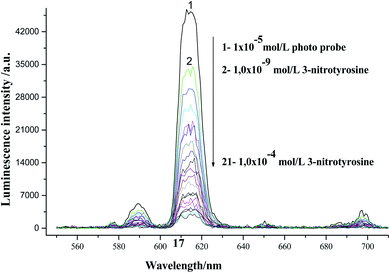 |
| | Fig. 6 Luminescence emission spectra of the [Eu(TTA)3Phen] complex in the presence of different concentrations of 3-nitrotyrosine in DMSO at λex = 375 nm and pH = 9.0. | |
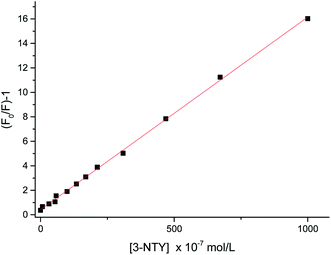 |
| | Fig. 7 Linear relationship between (FO/F) − 1 and the concentration of 3-nitrotyrosine λem = 617 nm. | |
Table 1 Sensitivity and regression parameters for the photo probe
| Parameter |
Values |
| λem nm |
617 |
| Linear range, mol L−1 |
2.3 × 10⁻⁴ to 1.0 × 10⁻⁹ |
| Limit of detection (LOD), mol L−1 |
2.6 × 10⁻¹⁰ |
| Limit of quantification (LOQ), mol L−1 |
7.8 × 10⁻¹⁰ |
| Intercept (a) |
0.626 ± 0.071 |
| Slope (b) × 10−7 |
0.0152 ± 1.84742 × 10⁻⁴ |
| Standard deviation |
0.431 |
| Variance (sa2) |
0.186 |
| Regression coefficient (r2) |
0.998 |
4. Accuracy and precision
To compute the accuracy and precision, the assays described under general procedures were repeated three times within a day to determine the repeatability (intraday precision) and three times on different days to determine the intermediate precision (inter day precision) of the method. These assays were performed for three levels of the analyte. The results of this study are summarized in Table 2. The percentage relative standard deviation (% RSD) values were ≤0.056–0.1% (intraday) and ≤0.054–0.097% (inter day) for patients. The inter day values indicated high precision of the method. Accuracy was evaluated as percentage relative error (RE) between the measured mean concentrations and the taken concentrations of 3-nitrotyrosine. Bias {bias%} was calculated at each concentration, as presented in Table 2. Percent relative error (% RE) values of ≤0.29–4.60 (intraday) and 0.18–2.80% (inter day) for the patient states demonstrate the high accuracy of the proposed method. The obtained results are summarized in Table 2. The proposed spectrofluorimetric method was applied for the determination of 3-nitrotyrosine in 5 serum samples of heathy volunteers and 5 serum samples of patients with MHE. The results obtained are summarized in Table 2. There was good agreement between the average values obtained by the developed procedure (8.534 ± 0.0089) and the standard spectrophotometric method (8.57 ± 0.004) without recording any significant differences between the two methods for samples of healthy volunteers. Furthermore, there was a good agreement between the average values obtained by the developed procedure (158.5 ± 0.89) and the standard spectrophotometric method (156.4 ± 0.4) in case of the serum samples of patients with MHE. The average recovery and R.S.D for serum samples in our method were found to be (100.2 ± 1.43%). The data obtained for the average recovery by the British Pharmacopoeia method were (99.99% and 99.75%) for healthy and patient samples, respectively. The RSD values for healthy and patient samples were 0.07% and 0.12%, respectively. These data have been shown for comparison and show good correlation with those obtained with the proposed method. The results obtained by the proposed method are agreed with the results of the reference method. The comparison of the proposed photo probe for the determination of 3-nitrotyrosine with other published methods43–49 is summarized in Table 3. It was revealed that the developed method exhibited good stability, lower limit of detection (8.6 × 10⁻¹⁰ mol L−1) and wide linear range (2.3 × 10⁻⁴ to 1.0 × 10⁻⁹ mol L−1).
Table 2 Evaluation of intra-day and inter-day accuracy and precision
| Sample |
Standard method average nM |
Propose method |
| Intra-day accuracy and precision (n = 3) |
Inter-day accuracy and precision (n = 3) |
| Average found nMa ± CL |
% RE |
% RSD |
Average found nMa ± CL |
% RE |
% RSD |
| CL, confidence limits: CL = ± tS/(n)1/2, the tabulated value of t is 4.303, at the 95% confidence level. S, standard deviation. N, number of measurements. % RE, percent relative error. % RE = [(concentration proposed − concentration known)/(concentration known)] × 100. % RSD, relative standard deviation. % RSD = [S/(average measurements)] × 100. |
| Health (1) |
8.3 |
8.39 ± 0.89 |
1.08 |
0.072 |
8.3 ± 0.90 |
1.33 |
0.073 |
| Health (2) |
7.9 |
7.84 ± 0.92 |
0.76 |
0.077 |
7.9 ± 0.92 |
0.25 |
0.076 |
| Health (3) |
7.5 |
7.54 ± 0.94 |
0.53 |
0.08 |
7.5 ± 0.96 |
2.80 |
0.082 |
| Health (4) |
9.1 |
9.24 ± 0.85 |
1.54 |
0.065 |
9.1 ± 0.86 |
1.21 |
0.067 |
| Health (5) |
6.8 |
6.82 ± 0.99 |
0.29 |
0.088 |
6.8 ± 0.98 |
2.06 |
0.086 |
| Patient (1) |
177.8 |
177.66 ± 0.93 |
−0.07 |
1.78 |
178.8 ± 0.94 |
0.56 |
1.79 |
| Patient (2) |
109.9 |
109.74 ± 0.79 |
−0.14 |
1.56 |
110.9 ± 0.78 |
0.90 |
1.55 |
| Patient (3) |
206.3 |
206.01 ± 0.105 |
−0.14 |
1.1 |
207.3 ± 0.104 |
0.48 |
1.97 |
| Patient (4) |
111.1 |
111.8 ± 0.79 |
0.63 |
1.56 |
112.0 ± 0.77 |
0.81 |
1.54 |
| Patient (5) |
170.1 |
170.9 ± 0.80 |
0.47 |
1.05 |
171.1 ± 0.80 |
0.58 |
1.58 |
Table 3 Comparison of the spectrofluorimetric technique with some existing methods for the determination of 3-nitrotyrosine
| Method |
Detection limit |
Reference |
| (GC/MS) |
(1.73) nM |
25 |
| Isotope dilution liquid, chromatography-electro spray, ionization tandem, mass spectrometry |
(1.83) nM |
26 |
| HPLC-UV method, combined with pre-column, cloud point extraction (CPE) |
(5–15) nM |
27 |
| GC tandem MS |
2.677 ± 1.540 v nM |
28 |
| GC-MS |
4.46 ± 4.49 nM |
29 |
| HPLC-fluorescence detector, 470 nm |
4.4 ± 1.8 nM |
30 |
| ELISA based on the sandwich |
573.54 ± 142.86 nM |
31 |
| Photo probe method, 3-nitrotyrosine-Eu(TTA)3Phen |
1.6 ± 0.19 nM |
The present work |
5. Conclusion
3-Nitrotyrosine has been determined by the quenching of the electric band of the [Eu(TTA)3Phen] complex at 617 nm. This method is very accurate and more sensitive compared with ELISA. The electron transfer mechanism of the quenching has been identified from the Stern–Volmer plot. This method has been validated for health and patient sample of MHE.
Conflicts of interest
There are no conflicts to declare.
Acknowledgements
Authors extend their appreciation to the Deputyship for Research & Innovation, Ministry of Education in Saudi Arabia for funding this research work through the project number "IF_2020_NBU_204". Authors thanks Taif University Researchers Supporting Project (TURSP-2020/200), Taif University, Taif, Saudi Arabia, for supporting this work.
References
- H. Vilstrup, P. Amodio, J. Bajaj, J. Cordoba, P. Ferenci and K. D. Mullen, et al., Hepatic encephalopathy in chronic liver disease: 2014 Practice Guideline by the American Association for the Study Of Liver Diseases and the European Association for the Study of the Liver, Hepatology, 2014, 60, 715–735 CrossRef PubMed.
- K. Weissenborn, Diagnosis of minimal hepatic encephalopathy, J. Clin. Exp. Hepatol., 2015, 5, S54–SS93 CrossRef PubMed.
- S. L. Flamm, Covert hepatic encephalopathy, Clin. Liver Dis., 2015, 19, 473–485 CrossRef PubMed.
- S. Agrawal, S. Umapathy and R. K. Dhiman, Minimal hepatic encephalopathy impairs quality of life, J. Clin. Exp. Hepatol., 2015, 5, S42 CrossRef PubMed.
- M. Groeneweg, W. Moerland, J. C. Quero, W. C. Hop, P. F. Krabbe and S. W. Schalm, Screening of subclinical hepatic encephalopathy, J. Hepatol., 2000, 32, 748–753 CrossRef CAS PubMed.
- H. Ischiropoulos, L. Zhu, J. Chen, M. Tsai, J. Martin, C. Smith and J. S. Beckman, Peroxynitrite-mediated tyrosine nitration catalyzed by superoxide dismutase, Arch. Biochem. Biophys., 1992, 298, 431–437 CrossRef CAS PubMed.
- M. Romero-Goemez, L. Grande, I. Camacho, S. Benitez and J. Irles, Altered response to oral glutamine challenge as prognostic factor for overt episodes in patients with minimal hepatic encephalopathy, J. Hepatol., 2002, 37, 781–787 CrossRef.
- M. Attia and N. Al-Radadi, Nano photo probe binuclear Pt-2 pyrazinecarboxylic acid–bipyridine for enhancement of the efficiency of 3-nitrotyrosine biomarker for early diagnosis of liver cirrhosis with minimal hepatic encephalopathy, Biosens. Bioelectron., 2016, 86, 406–412 CrossRef CAS PubMed.
- J. P. Gaut, J. Byun, H. D. Tran and J. W. Heinecke, Artifact-free quantification of free 3-chlorotyrosine, 3-bromotyrosine, and 3-nitrotyrosine in human plasma by electron capture-negative chemical ionization gas chromatography mass spectrometry and liquid chromatography-electrospray ionization tandem mass, Anal. Biochem., 2002, 300, 252–259 CrossRef CAS PubMed.
- L. F. Gamon, C. Guo, J. He, P. Hägglund, C. L. Hawkins and M. J. Davies, Absolute quantitative analysis of intact and oxidized amino acids by LC-MS without prior derivatization, Redox Biol., 2020, 36, 101586 CrossRef CAS PubMed.
- Y. Kato, N. Dozaki, T. Nakamura, N. Kitamoto, A. Yoshida, M. Naito, M. Kitamura and T. Osawa, Quantification of modified tyrosines in healthy and diabetic human urine using liquid chromatography/tandem mass spectrometry, J. Clin. Biochem. Nutr., 2009, 44, 67–78 CrossRef CAS PubMed.
- H. J. C. Chen and W. L. Chiu, Simultaneous detection and quantification of 3-nitrotyrosine and 3-bromotyrosine in human urine by stable isotope dilution liquid chromatography tandem mass spectrometry, Toxicol. Lett., 2008, 181, 31–39 CrossRef CAS PubMed.
- A. R. Mani, A. S. Pannala, N. N. Orie, R. Ollosson, D. Harry, C. A. Rice-Evans and K. P. Moore, Nitration of endogenous para-hydroxyphenylacetic acid and the metabolism of nitrotyrosine, Biochem. J., 2003, 374, 521–527 CrossRef CAS PubMed.
- D. Tsikas, E. Schwedhelm, F. K. Stutzer, F. M. Gutzki, I. Rode, C. Mehls and J. C. Frolich, Accurate quantification of basal plasma levels of 3-nitrotyrosine and 3-nitrotyrosinoalbumin by gas chromatography—Tandem mass spectrometry, J. Chromatogr. B: Anal. Technol. Biomed. Life Sci., 2003, 784, 77–90 CrossRef CAS.
- H. Ohshima, M. Friesen, I. Brouet and H. Bartsch, Nitrotyrosine As A New Marker For Endogenous Nitrosation and Nitration Of Proteins, Food Chem. Toxicol., 1990, 28, 647–652 CrossRef CAS PubMed.
- Y. Hui, M. Wong, S. S. Zhao, J. A. Love, D. M. Ansley and D. D. Y. Chen, A simple and robust LC-MS/MS method for quantification of free 3-nitrotyrosine in human plasma from patients receiving on-pump CABG surgery, Electrophoresis, 2012, 33, 697–704 CrossRef CAS PubMed.
- D. Yi, B. A. Ingelse, M. W. Duncan and G. A. Smythe, Quantification of 3-nitrotyrosine in biological tissues and fluids: Generating valid results by eliminating artifactual formation, J. Am. Soc. Mass Spectrom., 2000, 11, 578–586 CrossRef CAS PubMed.
- I. Verrastro, S. Pasha, K. T. Jensen, A. R. Pitt and C. M. Spickett, Mass spectrometry-based methods for identifying oxidized proteins in disease: advances and challenges, Biomolecules, 2015, 5, 378–411 CrossRef CAS PubMed.
- Y. C. Sun, P. Y. Chang, K. C. Tsao, T. L. Wu, C. F. Sun, L. L. Wu and J. T. Wu, Establishment of a sandwich ELISA using commercial antibody for plasma or serum 3-nitrotyrosine (3NT). Elevation in inflammatory diseases and complementary between 3NT and myeloperoxidase, Clin. Chim. Acta, 2007, 378, 175–180 CrossRef CAS PubMed.
- F. Khan, A. A. Siddiqui and R. Ali, Measurement and significance of 3-nitrotyrosine in systemic lupus erythematosus, Scand. J. Immunol., 2006, 64, 507–514 CrossRef CAS PubMed.
- A. J. Gow, C. R. Farkouh, D. A. Munson, M. A. Posencheg and H. Ischiropoulos, Biological significance of nitric oxide-mediated protein modifications, Am. J. Physiol.: Lung Cell. Mol. Physiol., 2004, 287, 262–268 CrossRef PubMed.
- D. Tsikas and M. W. Duncan, Mass spectrometry and 3-nitrotyrosine: Strategies, controversies, and our current perspective, Mass Spectrom. Rev., 2014, 33, 237–276 CrossRef CAS PubMed.
- D. Teixeira, R. Fernandes, C. Prudêncio and M. Vieira, 3-Nitrotyrosine quantification methods: Current concepts and future challenges, Biochimie, 2016, 125, 1–11 CrossRef CAS PubMed.
- M. S. Attia, M. H. Khalil, M. S. A. Abdel-Mottaleb, M. B. Lukyanova, Yu. A. Alekseenko and B. Lukyanov, Effect of Complexation with Lanthanide Metal Ions on the Photochromism of (1, 3, 3-Trimethyl-5_-Hydroxy-6_-Formyl- Indoline-Spiro2, 2-[2H] chromene) in Different Media, Int. J. Photoenergy, 2006, 1–9 CrossRef.
- M. S. Attia, A. A. Essawy, A. O. Youssef and M. S. Mostafa, Determination of Ofloxacin using a Highly Selective Photo Probe Based on the Enhancement of the Luminescence Intensity of Eu3+ - Ofloxacin Complex in Pharmaceutical and Serum Samples, J. Fluoresc., 2012, 2, 557–564 CrossRef PubMed.
- M. S. Attia, A. M. Othman, A. O. Youssef and E. El-Raghi, Excited state interaction between Hydrochlorothiazide and Europium ion in PMMA polyme, and its application as photo probe for Hydrochlorothiazide in tablet and serum samples, J. Lumin., 2012, 132, 2049–2053 CrossRef CAS.
- M. S. Attia, A. O. Youssef and A. A. Essawy, A novel method for tyrosine assessment in vitro by using fluorescence enhancement of the ion-pair tyrosine-neutral red dye photo probe, Anal. Methods, 2012, 4, 2323–2328 RSC.
- M. S. Attia, A. O. Youssef and R. H. El-Sherif, Durable diagnosis of seminal vesicle and sexual gland diseases using the nano photo probe thin film sm-doxycycline complex, Anal. Chim. Acta, 2014, 835, 56–64 CrossRef CAS PubMed.
- M. S. Attia, M. Diab and M. F. El-Shahat, Diagnosis of some diseases related to the histidine level in human serum by using the nano photo probe Eu–Norfloxacine complex, Sens. Actuators, B, 2015, 207, 756–763 CrossRef CAS.
- M. S. Attia, A. O. Youssef, Z. A. Khan and M. N. Abou-Omar, Alpha fetoprotein assessment by using a nano photo probe thin film binuclear Pt-2-aminobenzimidazole-Bipyridine for early diagnosis of liver cancer, Talanta, 2018, 186, 36–43 CrossRef CAS PubMed.
- M. S. Attia and N. S. Al-Radadi, Progress of pancreatitis disease biomarker alpha amylase enzyme by new nano photo probe, Biosens. Bioelectron., 2016, 86, 413–419 CrossRef CAS PubMed.
- M. S. Attia and N. S. Al-Radadi, Nano photo probe binuclear Pt-2-pyrazinecarboxylic acid-bipyridine for enhancement of the efficiency of 3-nitrotyrosine biomarker for early diagnosis of liver cirrhosis with minimal hepatic encephalopathy, Biosens. Bioelectron., 2016, 86, 406–412 CrossRef CAS PubMed.
- M. S. Attia, Nano optical probe samarium tetracycline complex for early diagnosis of histidinemia in new born children, Biosens. Bioelectron., 2017, 94, 81–86 CrossRef CAS PubMed.
- M. S. Attia, K. Ali, M. El-Kemary and W. M. Darwish, Phthalocyanine-doped polystyrene fluorescent nanocomposite as a highly selective biosensor for quantitative determination of cancer antigen 125, Talanta, 2019, 201, 185–193 CrossRef CAS PubMed.
- M. S. Attia, W. H. Mahmoud, A. O. Youssef and M. S. Mostafa, Cilostazol Determination by the Enhancement of the Green Emission of Tb3+ Photo probe, J. Fluoresc., 2011, 21, 2229–2235 CrossRef CAS PubMed.
- M. S. Attia, M. N. Ramsis, L. H. Khalil and S. G. Hashem, Spectrofluorimetric assessment of chlorzoxazone and Ibuprofen in pharmaceutical formulations by using Eu-tetracycline HCl photo probe doped in sol–gel matrix, J. Fluoresc., 2012, 22, 779–788 CrossRef CAS PubMed.
- O. Stern and M. Völmer, Decay time of the fluorescence, Z. Phys., 1919, 20, 183–188 CAS.
- A. A. Elabd and M. S. Attia, A new thin film photo probe for assessment of UO22+ based on the fluorescence quenching of Trimetazidine doped in sol gel matrix, J. Lumin., 2015, 165, 179–184 CrossRef CAS.
- A. A. Elabd and M. S. Attia, Spectroflourimetric assessment of UO22+ by the quenching of the fluorescence intensity of Clopidogrel embedded in PMMA matrix, J. Lumin., 2016, 87, 165–172 Search PubMed.
- A. A. Essawy and M. S. Attia, Novel application of pyronin Y fluorophore as high sensitive photo probe of glucose in human serum, Talanta, 2013, 107, 18–24 CrossRef CAS PubMed.
- E. Hamed, M. S. Attia and K. Bassiony, Synthesis, spectroscopic and thermal characterization of Copper (II) complexes of folic acid and their absorption efficiency in the blood, Bioinorg. Chem. Appl., 2009, 1–7 Search PubMed.
- International conference on harmonisation of technical requirements for registration of pharmaceuticals for human use, (ICH) Q2 (R1) validation of analytical procedures: text and methodology 2005, vol. 1, pp. 1–15 Search PubMed.
- C. Leeuwenburgh, M. Hardy, S. Hazen, P. Wagner, S. Oh-ishi, U. Steinbrecher and J. Heinecke, Reactive nitrogen intermediates promote low density lipoprotein oxidation in human atherosclerotic intima, J. Biol. Chem., 1997, 272, 1433–1436 CrossRef CAS PubMed.
- G. Romer, et al., Value of the critical flicker frequency in patients with minimal hepatic encephalopathy, J. Hepatol., 2007, 45, 879–885 CrossRef PubMed.
- E. Schwedhelm, D. Tsikas, F. Gutzki and J. Frölich, Gas chromatographic-tandem mass spectrometric quantification of free 3-nitrotyrosine in human plasma at the basal state, Anal. Biochem., 1999, 276, 195–203 CrossRef CAS PubMed.
- D. Tsikas, E. Schwedhelm, F. K. Stutzer, F. M. Gutzki, I. Rode, C. Mehls and J. C. Fr€olich, Accurate quantification of basal plasma levels of 3-nitrotyrosine and 3-nitrotyrosinoalbumin by gas chromatography-tandem mass spectrometry, J. Chromatogr. B: Anal. Technol. Biomed. Life Sci., 2003, 784, 77e90 Search PubMed.
- W.-Z. Zhang, C. Lang and D. M. Kaye, Determination of plasma free 3-nitrotyrosine and tyrosine by reversed-phase liquid chromatography with 4-fluoro-7-nitrobenzofurazan derivatization, Biomed. Chromatogr., 2007, 21, 273e278 Search PubMed.
- M. Pourfarzam, A. Movahedian, N. Sarrafzadegan, G. Basati and S. Z. Samsamshariat, Association between plasma myeloperoxidase and free 3-nitrotyrosine levels in patients with coronary artery disease, Int. J. Clin. Med., 2013, 158e164 Search PubMed.
- A. Seven, M. Aslan, S. Incir and A. Altintas, Evaluation of oxidative and nitrosative stress in relapsing remitting multiple sclerosis: effect of corticosteroid therapy, Folia neuropathologica/Association of Polish Neuropathologists and Medical Research Centre, Pol. Acad. Sci., 2013, 51, 58e64 Search PubMed.
|
| This journal is © The Royal Society of Chemistry 2022 |
Click here to see how this site uses Cookies. View our privacy policy here.  Open Access Article
 *a,
Ahmed O. Youssefa,
Nour A. Abdel-Sattara,
Mohammed A. Amin
 b,
Sarah Alharthi
 b,
Ekram H. Mohamed
 c,
Safwat A. Mahmoud*d and
Mona N. Abou-Omar*e


