 Open Access Article
Synthesis, characterization, and sorption activity of novel azo-colorants derived from phloroglucinol and antipyrine and their metal complexes†
Anh Van Nguyen *a,
Anh Thi Ngoc Vubi,
Liya V. Bazanc,
Ravil T. Galeevc,
Andrey N. Utenyshevd,
Ekaterina B. Markovae,
Van Thuan Le
 gh and
Olga V. Kovalchukovaef
aFaculty of Food Science and Technology, Ho Chi Minh City University of Food Industry, 140 Le Trong Tan Street, Tan Phu District, Ho Chi Minh City, 72000, Vietnam. E-mail: anhnv@hufi.edu.vn
bPharmaceutical Department of Buon Ma Thuot University, 298 Ha Huy Tap, Buon Ma Thuot, Daklak 630000, Vietnam
cE. K. Zavoisky Physical-Technical Institute, FRC Kazan Scientific Center of RAS, Kazan 420029, Russia
dSemenov Institute of Problems of Chemical Physics RAS, 1, Academician Semenov Avenue, Chernogolovka, Moscow Region, 142432, Russia
eKosygin Russian State University (Technology, Design, Art), 33, Sadovnicheskaya Street, Moscow, 117997, Russia
fPeoples' Friendship University of Russia (RUDN University), 6, Miklukho-Maklaya Street, Moscow, 117198, Russia
gCenter for Advanced Chemistry, Institute of Research and Development, Duy Tan University, 03 Quang Trung, Da Nang 55000, Vietnam
hThe Faculty of Natural Science, Duy Tan University, 03 Quang Trung, Da Nang 55000, Vietnam
iEnvironmental Analysis Laboratory, Southern Branch of Vietnam-Russia, Tropical Center, 3/2 Street District 10, Ho Chi Minh City, 740500, Vietnam
First published on 4th January 2022
Abstract
Two novel azo-colorants derived from phloroglucinol and antipyrine as well as 10 metal complexes with Co(II), Ni(II), Zn(II), Cu(II), and Cd(II) were isolated and studied by a set of methods (1H, 13C NMR, IR, UV-VIS, EPR, X-ray structure determination). The azo-coupling of phloroglucinol with a 5-pyrazolone amino-derivative led to the isolation of a colorant H3L1 which was presented in the hydroxy-azo tautomeric form. At nitrosation of H3L1, the product H3L2 was isolated, which can be described as tri-oxo di-hydroxylamino hydrazone. According to the X-ray structure determination, the Cd-complex of H3L1 exhibited the dimeric form with two unionized organic ligands in the inner sphere. It was also found that chloride anions bridge two cadmium cations to form dimers. According to EPR spectra, the Cu-complex with H3L1 exhibited distorted tetragonal symmetry associated with the dx2−y2 ground state rather than dz2, and the corresponding Cu–H3L2 complex was described by a cubic symmetry of the coordination medium. Both H3L1, H3L2, and their metal complexes show coloristic activity towards wool, polyamide, and polyacetate fibers, which are strongly resistant towards UV-irradiation. The H3L2 compound possessed good sorption activity towards heavy metal cations from aqueous solutions of trace concentrations both under static and dynamic conditions.
Introduction
An important condition of modern materials is the requirement for multifunctionality. For example, a dye, in addition to its coloristic properties, must have other valuable properties, such as biological, electrophysical, and sorption activities.Among many different types of colorants, azo compounds based on 5-pyrazolone and antipyrine are of great attraction due to their low cost and the simplicity of their isolation technology coloristic characteristics,1–7 and a variety of additional activities, including pharmaceutical,8–10 antimicrobial,11,12 and intracellular regulatory properties.13,14 In particular, the photoconductor and optical properties of these dyes are widely applied in toners and ink-jet printing,15,16 optical recording media, and data storage devices.17
The presence of phloroglucinol (1,3,5-trihydroxybenzene) in the composition of azopyrazolone dyes brings new potential for their properties. The introduction of additional electron donating fragments can increase the complexation ability of the organic molecules. Therefore, the attractive synthetic potential of H-atoms of the phloroglucinol ring allows their substitution not only by azo-group but by other electron donating fragments such as nitroso- or hydroxylamino moieties. The additional chelating centers in the azo-dyes increase organic molecules' ability to remove metal cations from the solutions. These properties can be beneficial for the environmental chemistry as toxic metal pollutants are global problems nowadays.18,19
Among different approaches of cleaning wastewater containing heavy metals,20 chemical precipitation methods are mostly used. These methods are based on the precipitation of heavy metals from the solutions either in the forms of hydroxides or their complex compounds with the organic ligands.
Recently, S-containing compounds have been considered to be the most effective metal chelators. Unfortunately, the high toxicity to the environment limits their practical application.21–23
Oximers containing chelating compounds have also received great attention for heavy metal treatment in wastewater owing to their high complexing abilities and environmental friendliness.24–30 However, monoquinone oximes metal complexes such as 3-Me-2-nitrosophenol, nitrosopyrogallol, nitrososalicylic acid, and nitrosogallic acid could not seem to be used as potential sorbents because of their high solubilities, while metal complexes of some polyquinone oximes are easily precipitated in solution.
In our laboratory, the coordinating behavior and spectral characteristic of some polyquinone oximes metal complexes have been studied recently. We reported the synthesis, crystal structure, and spectral characteristics of sodium and barium 3,5-bis(hydroxyimino)-1-methyl-2,4,6-trioxocyclohexanide.31,32 A series of bis- and trinitroso compounds derived from 1,3,5-trihydroxybenzene (phloroglucinol), 2,4,6-trihydroxy benzoic acid, and 2,4,6-trihydroxyacetophenone, their tautomeric and ionic equilibria as well as complex formation with transitional metal cations was reported.33 The results showed that the isolated organics could be used as potential ligands for removing metal cations from aqueous solutions in the pH interval 3–5.
In the present work, we report the synthesis of two novel azo-colorants derived from phloroglucinol and 5-pyrazolone as well as 10 metal complexes with Co(II), Ni(II), Zn(II), Cu(II), and Cd(II) and their characterizations were described. The ability of the isolated organics to remove metal cations from the aqueous solutions was also evaluated.
Results and discussion
Synthesis and characterization of the organic azo-compounds
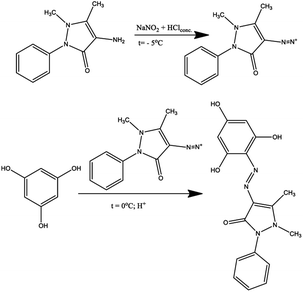
The introduction of several hydroxyl groups into the azo compound, on the one hand, increases the capacity for intermolecular interactions due to the formation of intermolecular hydrogen bonds, which makes them more attractive for use as dyes. On the other hand, the introduction of additional electron-donor fragments into the molecule can increase the complexation of organic molecules with metal cations. In connection with the above, in the present work, the azo coupling reaction of 1,3,5-trihydroxybenzene (phloroglucinol) with 4-amino antipyrine was carried out, which led to the isolation of the monoazo coupling product (H3L1) (Scheme 1).According to the instability of diazonium salt of pyrazolone with the ability to form rubazoic acid in the process of synthesis,34 the diazotization of 4-amino antipyrine was carried out at −5 °C by slowly drowsing the excess concentrated solution HCl to this mixture of 4-amino antipyrine and NaNO2 with stirring. After 60 minutes, the obtained diazonium salt was added to a phloroglucinol solution at 0 °C.
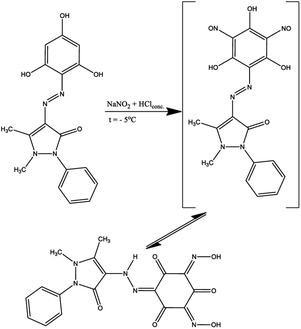
In previous work,33 some derived phloroglucinols were successfully nitrosated using HCl and NaNO2 to archive the nitroso compound, which exists as tautomeric oximes. These chelating oxime ligands could be used as eco-friendly sorbents for removing heavy metal cations from the environment. In this work, the ligand containing two active positions in ash ring synthesized according to Scheme 1 was nitrosated. For this, the resulting product was subjected to a nitrosation reaction at −5 °C, and after rearrangement of nitroso groups into hydroxylamine fragments, compound H3L2 was isolated (Scheme 2).
In the 1H NMR spectrum of H3L1 (Fig. 1S in ESI†), two unequal signals of the hydroxyl protons are observed at 10.12 (s, 1H, OH) and 11.49 (s, 2H, 2OH) ppm. This is probably due to the participation of one of the protons in the formation of an intramolecular hydrogen bond with the N atom of the azo group. In the 13C NMR spectrum of H3L1 (Fig. 1S in ESI†), the signal 159.86 ppm corresponds to the carbon atom of the carbonyl (C![[double bond, length as m-dash]](https://www.rsc.org/images/entities/char_e001.gif) O) group of the pyrazolone fragment. The assignment of all signals in the 1H and 13C spectra is confirmed by two-dimensional spectroscopy of COZY 1H–1H, HMQC 1H–13C, HMBC 1H–13C, and DEPT 135 13C (see in ESI†). An intense absorption band also evidences the presence of a carbonyl group in the molecule at 1651 cm−1 in the IR spectrum of H3L1. In addition, the O–H band at 3105–3358 cm−1 is also observed.
O) group of the pyrazolone fragment. The assignment of all signals in the 1H and 13C spectra is confirmed by two-dimensional spectroscopy of COZY 1H–1H, HMQC 1H–13C, HMBC 1H–13C, and DEPT 135 13C (see in ESI†). An intense absorption band also evidences the presence of a carbonyl group in the molecule at 1651 cm−1 in the IR spectrum of H3L1. In addition, the O–H band at 3105–3358 cm−1 is also observed.
In the 1H NMR spectrum of H3L2 (Fig. 2S in ESI†), there are no signals of protons of hydroxyl groups. Instead, two signals are observed in regions of 14.19 (s, 1H, NH, hydrazone) and 15.89 (s, 2H, 2OH, oxime) ppm. It can be assumed that at nitrosation of H3L1 the tri-oxo di-hydroxylamino hydrazone tautomer is released. One of the carbonyl groups of the initial phloroglucinol ring can form an intramolecular hydrogen bond with the hydrogen atom of the hydrazone fragment of the molecule. The 13C NMR spectrum of H3L2 contains free and bound carbonyl groups signals at 162.77, 171.95, 174.47, 176.12 ppm.
For H3L2 spectrum, a doublet of 1697 (C![[double bond, length as m-dash]](https://www.rsc.org/images/entities/char_e001.gif) O free) and 1662 (C
O free) and 1662 (C![[double bond, length as m-dash]](https://www.rsc.org/images/entities/char_e001.gif) O bound) cm−1 is observed. The presence of a band in the frequency range 3400–3610 cm−1 (oxime νOH) and two other bands at 3000–3160 and 2750–2860 cm−1 indicates that OH oximes are involved in hydrogen bonding. The ligand gave νN–OH at 978 cm−1 and νC
O bound) cm−1 is observed. The presence of a band in the frequency range 3400–3610 cm−1 (oxime νOH) and two other bands at 3000–3160 and 2750–2860 cm−1 indicates that OH oximes are involved in hydrogen bonding. The ligand gave νN–OH at 978 cm−1 and νC![[double bond, length as m-dash]](https://www.rsc.org/images/entities/char_e001.gif) N at (1500–15
N at (1500–15![[thin space (1/6-em)]](https://www.rsc.org/images/entities/char_2009.gif) 022) cm−1, evidencing the presence of keto oxime groups (see IR spectra of the two ligands in ESI†).
022) cm−1, evidencing the presence of keto oxime groups (see IR spectra of the two ligands in ESI†).
Based on the potentiometric titration data, the dissociation constants of both ligands at three different temperatures (298 K, 308 K, and 318 K) were calculated and presented in Table 1. The calculated values of the dissociation constants for the ligands at various temperatures were operated to calculate the thermodynamic functions for the dissociation process.
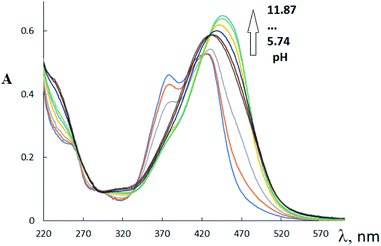
Different tautomeric forms of H3L1 and H3L2 lead to different changes in the electronic absorption spectra of their ethanol solutions with the pH change. The electronic absorption spectrum of an ethanol solution of H3L1 in the pH range from 5.74 to 11.87 is shown in Fig. 1.
The ethanolic H3L1 solution is characterized by absorption bands at 257 nm (log![[thin space (1/6-em)]](https://www.rsc.org/images/entities/char_2009.gif) ε 4.04), 378 nm (log
ε 4.04), 378 nm (log![[thin space (1/6-em)]](https://www.rsc.org/images/entities/char_2009.gif) ε 4.33), and 425 nm (log
ε 4.33), and 425 nm (log![[thin space (1/6-em)]](https://www.rsc.org/images/entities/char_2009.gif) ε 4.39). The gradual addition of alkali leads to a decrease in intensity and a bathochromic shift of the 257 nm band. The 378 nm band disappears, and the intensity of the longwave band increases while it shifts to 465 nm. This change in the electronic spectrum is consistent with changes in the electronic spectra of organic azo dyes existing in the azo-tautomeric form. The calculated value of the dissociation constant (pKa) is 7.81 ± 0.04, correlating with the first dissociation constant calculated potentiometrically (Table 1).
ε 4.39). The gradual addition of alkali leads to a decrease in intensity and a bathochromic shift of the 257 nm band. The 378 nm band disappears, and the intensity of the longwave band increases while it shifts to 465 nm. This change in the electronic spectrum is consistent with changes in the electronic spectra of organic azo dyes existing in the azo-tautomeric form. The calculated value of the dissociation constant (pKa) is 7.81 ± 0.04, correlating with the first dissociation constant calculated potentiometrically (Table 1).
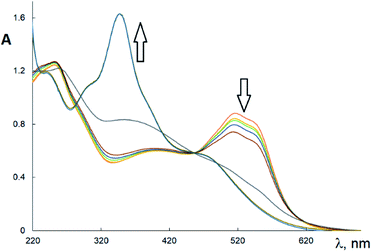
In the H3L2 UV-VIS spectrum (Fig. 2), three main absorption bands with λmax at 253 nm (log![[thin space (1/6-em)]](https://www.rsc.org/images/entities/char_2009.gif) ε 4.36); 390 nm (log
ε 4.36); 390 nm (log![[thin space (1/6-em)]](https://www.rsc.org/images/entities/char_2009.gif) ε 4.05), and 518 nm (log
ε 4.05), and 518 nm (log![[thin space (1/6-em)]](https://www.rsc.org/images/entities/char_2009.gif) ε 4.21) were observed. Two first absorbance bands (at λ = 250–290 nm; and 320–400 nm) assign to π–π* transitions and n–π* transitions of N
ε 4.21) were observed. Two first absorbance bands (at λ = 250–290 nm; and 320–400 nm) assign to π–π* transitions and n–π* transitions of N![[double bond, length as m-dash]](https://www.rsc.org/images/entities/char_e001.gif) O, C
O, C![[double bond, length as m-dash]](https://www.rsc.org/images/entities/char_e001.gif) O, C
O, C![[double bond, length as m-dash]](https://www.rsc.org/images/entities/char_e001.gif) C, and C
C, and C![[double bond, length as m-dash]](https://www.rsc.org/images/entities/char_e001.gif) N moieties. The most extended absorbance band at 450–600 nm is probably assigned to the formation of polymer form of this ligand H3L2 in solution. The addition of sodium hydroxide solutions to the solution of this ligand in the pH range 4–13 induces the change in intensities of π–π* transitions and shifting of the absorption bands of n–π* transitions to lower wavelengths. As a result, the bands at 253 and 518 nm tend to disappear, and one intense absorption band appears at 349 nm (log
N moieties. The most extended absorbance band at 450–600 nm is probably assigned to the formation of polymer form of this ligand H3L2 in solution. The addition of sodium hydroxide solutions to the solution of this ligand in the pH range 4–13 induces the change in intensities of π–π* transitions and shifting of the absorption bands of n–π* transitions to lower wavelengths. As a result, the bands at 253 and 518 nm tend to disappear, and one intense absorption band appears at 349 nm (log![[thin space (1/6-em)]](https://www.rsc.org/images/entities/char_2009.gif) ε 4.47). The change of tautomerism could explain the change of UV spectrum at gradual addition of NaOH from oxime form to nitroso form. A similar change in the electronic absorption spectrum on going to alkaline solutions was previously discussed for the dinitrosation product of methyl phloroglucinol.31
ε 4.47). The change of tautomerism could explain the change of UV spectrum at gradual addition of NaOH from oxime form to nitroso form. A similar change in the electronic absorption spectrum on going to alkaline solutions was previously discussed for the dinitrosation product of methyl phloroglucinol.31
Synthesis and characterization of the metal complexes
The synthesis of metal complexes H3L1 and H3L2 was carried out in neutral ethanol solutions using bivalent nickel, cobalt, copper, zinc, and cadmium chlorides. Ten complexes of both H3L1 and H3L2 were isolated in the crystalline state. The complexes of H3L1 can be divided into two groups. Complex compounds of cadmium and cobalt, based on the principle of electroneutrality of molecules, contain non-ionized H3L1 moieties, which are consistent with the X-ray diffraction data for the cadmium complex. In contrast, there are monoanionic (H2L1)− moieties in the composition of Ni, Cu, and Zn complexes. The H3L2 ligand enters the composition of the complex compounds in a dianionic form. The general formulae of the complexes may be presented as M(H2L1)Cl·nH2O (n = 0, 2; M = Cu, Ni, Zn), M(H3L1)Cl2·nH2O (n: 0, 3; M: Cd, Co), and M(HL2)·nH2O (n: 3–6; M: Co, Ni, Cu, Zn, Cd). In the 1H NMR spectra of the compounds containing the neutral H3L1, there are signals in the region of 10.09 and 11.48 ppm, in total corresponding to three protons. The signal at 10.09 ppm (1H) is significantly (by 0.03 ppm) shifted to the corresponding signal for uncoordinated H3L1 (10.12 ppm), which may correspond to the coordination of the oxygen atom of the unionized hydroxyl group with metal cations. The 1H NMR spectra of complex compounds of Zn and Ni contain two proton signals at 12.13 (1H) and 9.85 (1H) ppm.The presence of water molecules in the composition of the complexes was proved by the thermal gravimetric analysis (removal of lattice and coordinated water molecules is observed in the temperature ranges 70–110 and 120–150 °C, respectively).
The involvement of the carbonyl group of the pyrazolone rings of H3L1 and H3L2 in coordination with metal cations was judged from the low-frequency shift of C![[double bond, length as m-dash]](https://www.rsc.org/images/entities/char_e001.gif) O stretching vibration modes of the ligands upon complexation with metals. According to the IR spectra of complexes of H3L1 ligand, the displacement ΔνC
O stretching vibration modes of the ligands upon complexation with metals. According to the IR spectra of complexes of H3L1 ligand, the displacement ΔνC![[double bond, length as m-dash]](https://www.rsc.org/images/entities/char_e001.gif) O changes in the following order: Cd2Cl4(H3L1)2 (5) < Co(H3L1)Cl2·3H2O (1) < Zn(H2L1)Cl·2H2O (4) < Cu(H2L1)Cl (3) < Ni(H2L1)Cl (2), which may indicate an increase in the degree of covalence of the M–O bond. As can be seen, the strongest interaction of the carbonyl group of the pyrazolone fragment of H3L1 with metal cations was observed for complex compounds in which the ligand is present in a deprotonated form (complexes (3) and (2)). The bands of the N
O changes in the following order: Cd2Cl4(H3L1)2 (5) < Co(H3L1)Cl2·3H2O (1) < Zn(H2L1)Cl·2H2O (4) < Cu(H2L1)Cl (3) < Ni(H2L1)Cl (2), which may indicate an increase in the degree of covalence of the M–O bond. As can be seen, the strongest interaction of the carbonyl group of the pyrazolone fragment of H3L1 with metal cations was observed for complex compounds in which the ligand is present in a deprotonated form (complexes (3) and (2)). The bands of the N![[double bond, length as m-dash]](https://www.rsc.org/images/entities/char_e001.gif) N group at 1485–1499 cm−1 of both ligands shift towards a higher wavenumber upon complexation, which can be taken as evidence of the participation of the N
N group at 1485–1499 cm−1 of both ligands shift towards a higher wavenumber upon complexation, which can be taken as evidence of the participation of the N![[double bond, length as m-dash]](https://www.rsc.org/images/entities/char_e001.gif) N group in coordination. The complexation of the azo group was also confirmed by the appearance of a new absorption band in the range of 430–470 cm−1 (νM–N) and 496–517 cm−1 (νM–O).
N group in coordination. The complexation of the azo group was also confirmed by the appearance of a new absorption band in the range of 430–470 cm−1 (νM–N) and 496–517 cm−1 (νM–O).
The EPR measurements were performed on the polycrystalline Co, Ni, and Cu complex samples to describe the multiplicity of the central ion and the type of their coordination polyhedra. No signals were observed in the EPR spectra of Ni(H2L1)Cl (2) and Ni(HL2)·6H2O (7). This is apparently due to the low-spin state (S = 0) of Ni(II) ions. However, it is also possible that the high-spin state (S = 1) of Ni(II) ions is strongly split by the crystal field, so that hv ≪ D, E. In this case, the EPR spectra will also not be observed.
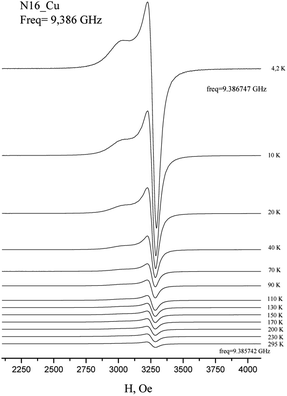
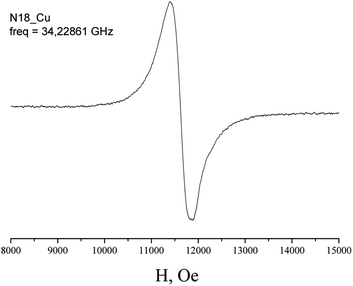
The EPR spectra of Cu(H2L1)Cl (3) are presented in Fig. 3. They were described by spin-Hamiltonian with S = 1/2 and g-factors gz = 2.22, gx,y = 2.045. The value g∥ > g⊥ > 2 indicates distorted tetragonal symmetry associated with the dx2−y2 ground state rather than dz2. Moreover, Kivelson and Neiman noted that g∥ < 2.3 corresponds to the covalent type of interaction between Cu(II) ions and the ligand.35 The temperature dependence of the integrated intensity is well fitted by the Curie–Weiss law with the Weiss constant θ = 1.7 K (here positive sign corresponds to antiferromagnetic interaction). This constant can be used to determine the value of the average field on Cu2+ ions and thus estimates the value of intermolecular interactions. According to the molecular field theory,36 the average interaction can be estimated by the expression J = (1/2)(3kb)θ/(S(S + 1)). In temperature units, J = 3.6 K. Despite the interaction between the ions, no exchange narrowing of the lines is observed in the EPR spectra. This suggests that the axes of the g-tensors of the interacting ions coincide.
In the EPR spectra of Cu(HL2)·4H2O (8), a single line was observed at g 2.098 ± 0.001, reflecting the cubic symmetry of the coordination medium. The lines widths change from 240 G at T = 4.2 K to 300 Oe at T = 295 K. The temperature dependence of integrated intensity (Fig. 2b) is well described by CW law with Weiss constant θ = −0.8 K. It corresponds to ferromagnetic intermolecular interaction J = −1.6 K. Notably, in contrast to Cu(H2L1)Cl (3), a single line is observed in the spectrum of Cu(HL2)·4H2O (8), which may indicate the exchange averaging of the EPR line. It means that the g-tensors of interacting ions are rotated relative to each other by some angle (Fig. 4).
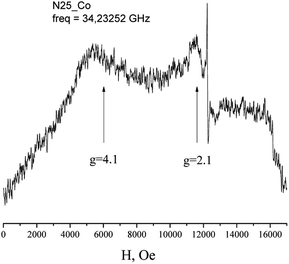
The EPR spectra of Co(HL2)·4H2O (6) at low temperatures are observed on gx = gy = 4.1, gz = 2.05 and correspond to effective spin S = 1/2 (Fig. 5). The spectrum at Q-band confirms these values (Fig. 6). With the temperature increasing, the EPR lines broaden, and their intensities strongly decrease. At the same time, at temperatures of 5–20 K, the intensity of the spectrum lines decreases according to the Curie law. As it was reported,37 Co2+ cations can relax fast at high temperatures. Therefore, the temperature changes in intensity are associated with relaxation effects. Such changes in the EPR spectrum of Co(HL2)·4H2O (8) allow conclude that the compound is formed by monomeric Co2+ complex moieties.
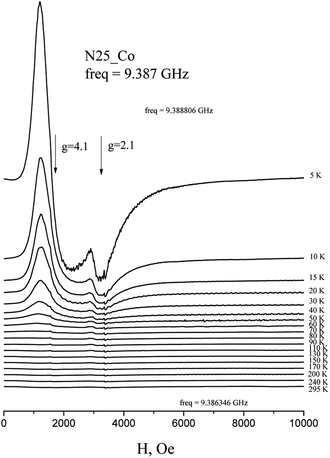 | ||
| Fig. 5 Temperature dependence of the X-band EPR spectrum of polycrystalline Co(HL2)·4H2O (6) at room temperature. | ||
At the addition of solutions of metal salts to the solutions of H3L1 and H3L2, shifts of the ligand absorption bands are observed, and the isosbestic points appear, which corresponds to the equilibrium complexation processes in solutions. Based on spectrophotometric titration, the compositions and formation constants of the complexes were calculated (Table 2).
| M | λmax, nm | n in MLn | log![[thin space (1/6-em)]](https://www.rsc.org/images/entities/char_2009.gif) ε ε |
log![[thin space (1/6-em)]](https://www.rsc.org/images/entities/char_2009.gif) β β |
log![[thin space (1/6-em)]](https://www.rsc.org/images/entities/char_2009.gif) β/n β/n |
|
|---|---|---|---|---|---|---|
| H3L2 | Cu(II) | 380 | 1 | 4.24 | 7.72 ± 0.10 | 7.71 |
| 415 | 0.5 | 4.17 | 3.80 ± 0.12 | |||
| Ni(II) | 368 | 1 | 4.25 | 7.65 ± 0.15 | 7.65 | |
| Co(II) | 409 | 1 | 4.27 | 7.63 ± 0.08 | 7.63 | |
| Zn(II) | 401 | 1 | 4.15 | 6.40 ± 0.12 | 6.40 | |
| Cd(II) | 410 | 1 | 4.18 | 6.24 ± 0.13 | 6.24 | |
| H3L1 | Cu(II) | 442 | 1 | 4.06 | 10.53 ± 0.14 | 10.53 |
| 532 | 3.29 | |||||
| Ni(II) | 428 | 1 | 4.24 | 5.41 ± 0.13 | 5.41 | |
| 480 | 4.07 | |||||
| Co(II) | 429 | 2 | 4.29 | 8.84 ± 0.12 | 4.42 | |
| 471 | 4.11 | |||||
| Zn(II) | 401 | 1 | 3.34 | 6.73 ± 0.13 | 6.73 | |
| 477 | 4.15 | |||||
| Cd(II) | 410 | 2 | 4.00 | 14.57 ± 0.12 | 7.29 |
As shown in Table 2, the bathochromic shift in Cu(II) complexes is more significant than other metal complexes of each ligand. It probably is related to charge-transfer from a π-bonding level to an antibonding metal.
At recrystallization, the complex compound of Cd with H3L1 was obtained in the form of single crystals, and its molecular structure was determined (Fig. 7).
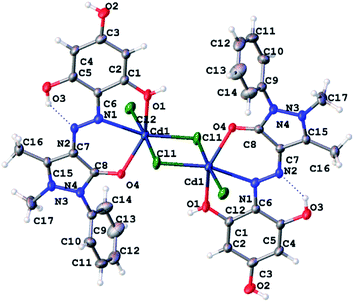 | ||
| Fig. 7 ORTEP diagram of Cd2Cl4(H3L1)2 with atom labeling scheme (displacement ellipsoids are drawn at the 50% probability level for non-hydrogen atoms). | ||
As shown in Fig. 7, the cadmium complex exists as a dimer. Each cadmium atom in the plane is surrounded by three chloride anions, two of which are bridging (the CdCl bond lengths are 2.5071(10) and 2.6523(10) Å), and one is terminal (the CdCl distance is 2.5748(11) Å). The fourth coordination bond in the azimuthal plane of the cadmium environment is formed with the participation of one of the nitrogen atoms of the azo group of the organic ligand (the CdN bond length is 2.422(3) Å). Two axial bonds surrounded by cadmium are occupied by oxygen atoms of the carbonyl group of the pyrazolone fragment and one non-ionized hydroxyl group of the phloroglucinol fragment (CdO distances 2.265(2) and 2.336(3) Å, respectively). The interconnection angles in the coordination polyhedron of cadmium lie within 68.00(10)–111.49(7) degrees, with the greatest deviation from 90° observed for axial bonds. Overall, the coordination polyhedron of cadmium atoms can be described as a distorted, compressed octahedron.
The organic ligand is included in the complex in a neutral form. The bond length between the N1 and N2 atoms is 1.274(4) Å, which corresponds to a double bond and confirms the azo-tautomeric form of H3L1 predicted from the NMR spectra. The C4O4 bond length in the pyrazolone ring (1.2649(40) Å) corresponds to the double C![[double bond, length as m-dash]](https://www.rsc.org/images/entities/char_e001.gif) O bond. An intramolecular hydrogen bond exists between the hydrogen atom of the hydroxyl group adjacent to the azo group and the nitrogen atom not participating in coordination.
O bond. An intramolecular hydrogen bond exists between the hydrogen atom of the hydroxyl group adjacent to the azo group and the nitrogen atom not participating in coordination.
In the crystal, molecules of dimeric complexes are packed in parallel rows linked by intermolecular hydrogen bonds Cl⋯HO leading to the formation of coordination 2D polymer structures.
Based on the above and taking into account the most characteristic coordination numbers of central ions, the structure diagrams of the isolated complex compounds can be represented as the following scheme of hypothesized structures of the metal complexes, which appear as three different types of systems, M(H3L1)Cl2, M(H2L1)Cl and M(HL2)Cl (Scheme 3).
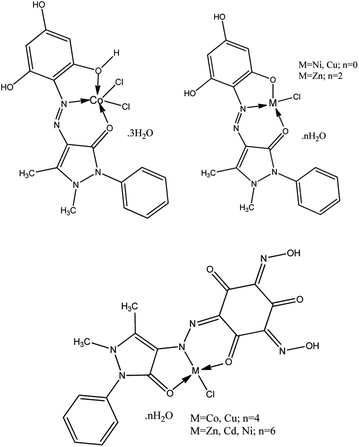 | ||
| Scheme 3 Scheme of hypothesized structures of the metal complexes M(H2L1)Cl·nH2O, M(H3L1)Cl2·nH2O, and M(HL2)·nH2O. | ||
Coloristic and sorption activity studies
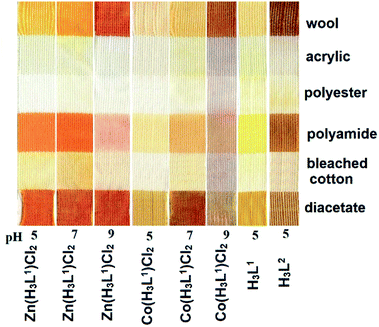
The coloristic properties of the isolated organics and their metal complexes were tested by a cold dyeing test under different acidity of the dyeing medium for six main types of fabrics used in the textile industry (Fig. 8).The application parameters of the metal complexes as dyes for wool at pH = 5 were the following: light fastness 5, rubber fastness 4–5, washing fastness 4–5. The corresponding values for H3L1 and H3L2 ligands were detected as 5, 4–5, and 3–4, respectively. The H3L1 dye was strongly removed from the textile by washing in the solutions containing metal cations. The textiles colored by H3L2 were resistant to metal-containing solutions.
The metal complexes of H3L2 did not express affinity to any type of fabric which may be due to their poor solubility. Previously we reported strong sorption properties of some bis- and trinitroso compounds derived from 1,3,5-trihydroxybenzene (phloroglucinol), 2,4,6-trihydroxy benzoic acid, and 2,4,6-trihydroxyacetophenone.30 In this regard, the H3L2 azo-colorant was tested as a potential chemisorbent for removing heavy metal cations from dilute aqueous solutions (a model of polluted industrial wastewater after primary treatment). The experiment was based on the technique described by Ying and Fang38 and was performed under static and dynamic conditions. By the method of successive dilutions of the initial 1% aqueous solutions containing nitrate of Cu(II), Zn(II), Ni(II), Co(II), and Cd(II) solutions of salts of a 100 ppm concentration with respect to metal cations were prepared. Due to the poor solubility of H3L2 in water, an aqueous solution of the H3L2 ligand was prepared in NaOH solution at pH = 8. Under a static regime, the 1 ml prepared above solution H3L2 was added to aliquot volumes of solutions (20 ml) in an amount corresponding to a 20% excess of the organic sorbent relative to the stoichiometric ratio. In various samples, the pH of the solutions was adjusted to 3, 4, 5, and 6 and stirred at room temperature with a magnetic stirrer for 60 minutes. After the end of the experiment, the precipitates were filtered through a paper filter. Under a dynamic regime, the 100 ppm CuCl2 solution was slowly dropped through a glacial column filled with wool fibres coloured by H3L2. The initial and residual concentration of metal cations was determined by atomic absorption spectroscopy (F-AAS). The procedure was repeated until three measurements were obtained, differing by less than 1%. The results are presented in Table 3 and Fig. 9 and 10.
| M2+ | pH | Initial concentration of metal (ppm) | Final concentration of metal (ppm) | Removal degree of metal (%) |
|---|---|---|---|---|
| Cu2+ | 3 | 100 | 3.25 | 97 |
| 4 | 100 | 2.12 | 98 | |
| 5 | 100 | 1.05 | 99 | |
| 6 | 100 | 0.6 | 99 | |
| Cd2+ | 3 | 100 | 7.88 | 92 |
| 4 | 100 | 6.21 | 94 | |
| 5 | 100 | 5.33 | 95 | |
| 6 | 100 | 3.1 | 97 | |
| Co2+ | 3 | 100 | 15.22 | 85 |
| 4 | 100 | 11.2 | 89 | |
| 5 | 100 | 8.01 | 92 | |
| 6 | 100 | 5.22 | 95 | |
| Zn2+ | 3 | 100 | 18.4 | 82 |
| 4 | 100 | 10.2 | 90 | |
| 5 | 100 | 7.89 | 92 | |
| 6 | 100 | 4.22 | 96 | |
| Ni2+ | 3 | 100 | 12.33 | 88 |
| 4 | 100 | 8.51 | 91 | |
| 5 | 100 | 4.90 | 95 | |
| 6 | 100 | 3.65 | 96 |
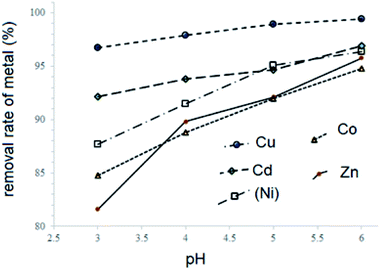 | ||
| Fig. 9 Effects caused by pH value on treatment effectiveness of H3L2 on the solutions containing: CuCl2; CdCl2; CoCl2; ZnCl2, and NiCl2 under static conditions. | ||
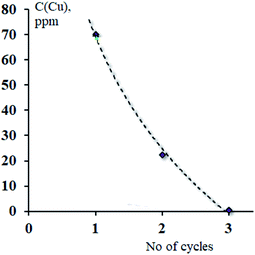 | ||
| Fig. 10 Effects caused by the number of cycles of treatment on sorption effectiveness of wool fibres coloured by H3L2 towards CuCl2 solution under dynamic conditions. | ||
As it follows from the experiment, under static conditions the degrees of metal ions removal increase in the ranges Cu2+ > Cd2+ > Ni2+ > Co2+ > Zn2+ (99–82% of removal, respectively). The increase in pH also increases the rates of metal ions removal. The maximal efficiency is observed for the removal of Cu2+ ions from the solution at pH 5–6 (99% of removal).
Under a dynamic regime, the efficiency of removal of Cu2+ cations reaches its maximum after three cycles of treatment (the rest concentration of Cu2+ 0.56 ppm, removal rate 99%).
Conclusions
The paper reports the synthesis and sorption study of two novel azo-colorants derived from phloroglucinol and antipyrine as well as 10 metal complexes with Co(II), Ni(II), Zn(II), Cu(II), and Cd(II). The azo-coupling reaction leads to the isolation of an azo-compound H3L1, which exists in the hydroxy-azo tautomeric form. At nitrosation of H3L1, the product H3L2 is isolated. X-Ray and spectroscopic studies indicate that H3L1 exists in the azo-tautomeric form, and at nitrozation it turns in H3L2 which can be described as tri-oxo di-hydroxylamino hydrazone.The dissociation constants of both ligands at three different temperatures (298 K, 308 K, and 318 K) were calculated, and thermodynamic functions for the dissociation process were determined.
Different tautomeric forms of H3L1 and H3L2 lead to different changes in electronic absorption spectra of the compounds at pH changes. The gradual addition of alkali to the ethanol solutions of H3L1 leads to a bathochromic shift of the longwave absorption band from 425 nm to 465 nm. This is consistent with changes in the electronic spectra of organic azo dyes existing in the azo-tautomeric form. Three absorption bands are observed in the UV-VIS spectrum of H3L2 at 253, 390, and 518 nm. When added to a solution of sodium hydroxide in the pH range 4–13, the bands at 258 and 518 nm tend to disappear, and one intense absorption band appears at 349 nm. A similar change in the electronic absorption spectrum on going to alkaline solutions was previously discussed for the dinitrosation product of methyl phloroglucinol and indicates the tautomeric transformation of tri-oxo di-hydroxylamino hydrazone to trinitroso trihydroxy-tautomeric form of the anions.
The organic species possess a strong affinity towards metallic cations, and 10 novel complex compounds are isolated and studied by a set of instrumental methods (1H, 13C NMR, IR, UV-VIS, EPR, X-ray structure determination). The compositions of the complexes can be presented as M(H2L1)Cl·nH2O (n = 0, 2; M = Cu, Ni, Zn), M(H3L1)Cl2·nH2O (n: 0, 3; M: Cd, Co), and M(HL2)·nH2O (n: 3–6; M: Co, Ni, Cu, Zn, Cd). According to the X-ray structure determination, the Cd-complex of H3L1 exists in the dimeric form with two unionized organic ligands in the inner sphere. Chloride anions bridge two cadmium cations to form dimers. The Co-complex of H3L1 also contains a unionized organic ligand. Oppositely to a dimeric Cd-complex, the Co-compound is monomeric. According to EPR spectra, the Cu-complex with H3L1 indicates distorted tetragonal symmetry associated with the dx2−y2 ground state rather than dz2, and the corresponding Cu–H3L2 complex is described by a cubic symmetry of the coordination medium.
Both H3L1, H3L2, and their metal complexes show coloristic activity towards wool, polyamide, and polyacetate fibres. The application parameters such as light fastness, rubber fastness, washing fastness of the metal complexes and ligands as dyes for wood were evaluated. The results showed that the H3L1 dye was strongly removed from the textile by washing in the solutions containing metal cations, while the textiles colored by H3L2 were resistant to metal-containing solutions.
The H3L2 compound possesses good sorption activity towards heavy metal cations from aqueous solutions of trace concentrations both under static and dynamic conditions. The removal degree of heavy metal cations at trace concentrations under static conditions is 82–99%. The metal ions removal increases in the ranges of Cu2+ > Cd2+ > Ni2+ > Co2+ > Zn2+ (99–82% of removal, respectively). The increase in pH also leads to an increased the rate of metal ions removal. The maximal efficiency is observed for removing Cu2+ ions from the solution at pH 5–6 (removal of 99%). Under a dynamic regime, the efficiency of removal of Cu2+ cations reaches its maximum after three cycles of treatment (the rest concentration of Cu2+ is 0.56 ppm, removal rate of 99%).
Experimental
General methods
All commercially available reagents and solvents were used without further purification.1H NMR, 13C NMR, COSY 1H–1H NMR, HMBC 1H–13C NMR, HMQC 1H–13C NMR spectra were recorded with the JEOL JNM-ECA 600 spectrophotometer. Chemical shifts (δ) in ppm were referenced to an internal standard of tetramethylsilane (1H) or residual nondeuterated solvent.
Infrared (IR, 400–4000 cm−1) spectra were measured on a KBr pellet with a Shimadzu IR Prestige FT-IR spectrometer with a resolution of 4 cm−1.
UV-Vis spectra (200–700 nm) were measured in ethanol with the Varian Cary-50 spectrophotometer.
The EPR spectra were measured at Q-band in the temperature 300 K and at X-band in the temperature range of 4–300 K. The measurements were carried out on a Bruker ELEXSYS E580 spectrometer at Q-band and on a Bruker EMX plus spectrometer at X-band.
Elemental analysis of C, H, and N was carried out on a Varian 735-OES elemental analyzer for C, H, N. Metal content was determined by AAS (novAA 400P).
The X-ray diffraction data for Cd2Cl4(H3L1)2 single crystals were collected on the Bruker D8 QUEST diffractometer equipped with a CMOS detector, using MoKα radiation (λ = 0.71073 Å) at 100.01(2) K, with the APEX3 suite of programs.39 The data were processed and corrected for Lorentz and polarization effects with SAINT40 and for absorption effects with SADABS.41 The structure was solved with the ShelXT42 structure solution program using Intrinsic Phasing and refined with the ShelXL43 using the full-matrix least-square technique on F2 in anisotropic approximation for non-hydrogen atoms. The hydrogen atoms of the water molecules were objectively localized in the difference-Fourier map and included in the refinement within the riding model with isotropic displacement parameters [Uiso(H) = 1.5Ueq(O)]. Other hydrogen atoms were placed in calculated positions and refined within the riding model with fixed isotropic displacement parameters [Uiso(H) = 1.5Ueq(C) for the methyl groups and 1.2Ueq(C) for other groups]. All calculations were carried out using the Olex2 program suite.44 The single crystal of Cd2Cl4(H3L1)2 suitable for single crystal structure analysis (light yellow blocks) was isolated at recrystallization from ethanol. Crystal data. Monoclinic. P121/c1. a 10.8022(18); b 14.266(2); c 14.671(2) Å; α 90; β 101.960 (5); γ 90 deg. Cell volume 2211.7(6) Å3. Z 4. Independent reflections 4307. R 0.0468. The deposition number CCDC 2061914† contains the supplementary crystallographic data. These data are provided free of charge by the joint Cambridge Crystallographic Data Centre and Fachinformationszentrum Karlsruhe Access Structures service www.ccdc.cam.ac.uk/structures.
The determination of the dissociation constants and thermodynamic functions of H3L1 and H3L2 was archived by pH metric titration in aqueous solutions. The ionic strength was controlled constant at 0.1 M by adding a calculated amount of KCl, and the Schwarzenbach algebraic method was used.45
The sorption activity of H3L2 under static conditions has been observed in an aqueous solution. Due to the poor solubility of H3L2 in water, the aqueous solution of H3L2 ligand was prepared in NaOH solution at pH = 8. 1 ml of the prepared above solution of H3L2 was added to aliquot volumes of solutions of metal salts (20 ml) in an amount corresponding to a 20% excess of the organic sorbent relative to the stoichiometric ratio. In various samples, the pH of the solutions was adjusted to 3, 4, 5, and 6 and stirred at room temperature with a magnetic stirrer for 60 minutes.
The sorption under dynamic conditions was studied by passing a flow of Cu(II) containing aqueous solution (10 ml min−1) through a glacial column (1 cm in diameter) filled with wool fibres colored by H2L3 (10 cm in height).
Synthetic section
0.0079 mol of phloroglucinol was dissolved in a small amount of water, and the solution was cooled to 0 °C. The formed solution was slowly mixed (within 25 min) with the diazonium salt solution. The reactional mass was stirred for 1.5 hours. The formed precipitate was filtered off, then washed with 10 ml of cold water, and dried in air. The isolated orange powder was recrystallized from ethanol. Yield 80%.
Mp 272–273 °C; 1H NMR (600 MHz, DMSO-d6): 11.49 (s, 2H), 10.12 (s, 1H), 7.35–7.53 (m, 5H), 5.83 (m, 2H), 3.26 (s, 3H), 2.58 (s, 3H). 13C NMR (151 MHz, DMSO-d6): 162.8, 159.9, 156.9, 146.0, 134.6, 129.8, 128.3, 126.4, 122.8, 120.8, 95.3, 34.8, 12.1. UV-VIS (nm/log![[thin space (1/6-em)]](https://www.rsc.org/images/entities/char_2009.gif) ε): 426/4.32. IR: 3400–3100, 2939, 1651, 1609, 1578, 1533, 1491, 1412, 1362, 1329, 1290, 1207, 1153, 1053, 906, 770 cm−1. MS (EI) calcd for 341.12 [M + H]+; found: 341.1. Anal. Calcd for C17H16N4O4: C, 59.99; H, 4.74; N, 16.46; found: C, 60.01; H, 4.81; N, 16.36.
ε): 426/4.32. IR: 3400–3100, 2939, 1651, 1609, 1578, 1533, 1491, 1412, 1362, 1329, 1290, 1207, 1153, 1053, 906, 770 cm−1. MS (EI) calcd for 341.12 [M + H]+; found: 341.1. Anal. Calcd for C17H16N4O4: C, 59.99; H, 4.74; N, 16.46; found: C, 60.01; H, 4.81; N, 16.36.
Mp 228 °C; 1H NMR (600 MHz, DMSO-d6): 15.89 (s, 2H), 14.19 (s, 1H), 7.37–7.60 (m, 5H), 3.28 (s, 3H), 2.58 (s, 3H). 13C NMR (151 MHz, DMSO-d6): 176.1, 174.5, 172.0, 162.8, 156.8, 146.3, 134.4, 130.4, 129.9, 126.6, 120.7, 95.3, 134.8, 12.0. UV-VIS (nm/log![[thin space (1/6-em)]](https://www.rsc.org/images/entities/char_2009.gif) ε): 359/4.07. IR: 3550–3440, 3098, 2929, 1697, 1663, 1624, 1591, 1522, 1489, 1441, 1408, 1369, 1335, 1306, 1140, 1082, 1042, 978, 883, 829, 781, 704, 600 cm−1. MS (EI) calcd 399.1 [M + H]+; found: 399.6. Anal. Calcd for C17H14N6O6: C, 51.26; H, 3.54; N, 21.10; found: C, 51.11; H, 3.58; N 21.16.
ε): 359/4.07. IR: 3550–3440, 3098, 2929, 1697, 1663, 1624, 1591, 1522, 1489, 1441, 1408, 1369, 1335, 1306, 1140, 1082, 1042, 978, 883, 829, 781, 704, 600 cm−1. MS (EI) calcd 399.1 [M + H]+; found: 399.6. Anal. Calcd for C17H14N6O6: C, 51.26; H, 3.54; N, 21.10; found: C, 51.11; H, 3.58; N 21.16.
Co(H3L1)Cl2·3H2O (1). Mp 221–222 °C, 1H NMR (600 MHz, DMSO-d6): 10.48 (s, 2H), 10.15 (s, 1H), 7.41–7.04 (m, 5H), 5.62 (s, 2H), 3.30 (s, 3H), 2.61 (s, 3H). 13C NMR (151 MHz, DMSO-d6): 164.1, 158.0, 154.3, 149.9, 146.4, 141.0, 134.0, 131.1, 129.3, 127.5, 116.3, 97.3, 70.5, 35.56, 12.1. UV-VIS (nm/log
![[thin space (1/6-em)]](https://www.rsc.org/images/entities/char_2009.gif) ε): 429/4.33; 471/4.11. IR: 1632, 1599, 1578, 1522, 1493, 1458, 1425, 1352, 1288, 1240, 1161, 1051, 1022, 826, 698, 505, 459 cm−1. Anal. Calcd for C17H22Cl2CoN4O7: C, 38.95; H, 4.23; N, 10.69; found: C, 38.95; H, 4.33; N, 10.76.
ε): 429/4.33; 471/4.11. IR: 1632, 1599, 1578, 1522, 1493, 1458, 1425, 1352, 1288, 1240, 1161, 1051, 1022, 826, 698, 505, 459 cm−1. Anal. Calcd for C17H22Cl2CoN4O7: C, 38.95; H, 4.23; N, 10.69; found: C, 38.95; H, 4.33; N, 10.76.
Ni(H2L1)Cl (2). Mp 250–251 °C; 1H NMR (600 MHz, DMSO-d6): 10.27 (s, 1H), 9.60 (s, 1H), 7.60–7.17 (m, 5H), 5.35 (s, 2H), 3.11 (s, 3H), 2.46 (s, 3H). 13C NMR (151 MHz, DMSO-d6): 165.1, 162.2, 153.8, 146.6, 141.7, 137.5, 135.8, 132.8, 132.4, 130.2, 127.4, 96.4, 57.5, 34.6, 12.3. UV-VIS (nm/log
![[thin space (1/6-em)]](https://www.rsc.org/images/entities/char_2009.gif) ε): 428/4.33; 480/4.07. IR: 1624, 1605, 1585, 1558, 1522, 1491, 1419, 1373, 1290, 1240, 1161, 1049, 768, 669, 503, 470 cm−1. Anal. Calcd for C17H15ClN4NiO4: C, 47.10; H, 3.49; N, 12.93; found: C, 47.21; H, 3.32; N, 12.85.
ε): 428/4.33; 480/4.07. IR: 1624, 1605, 1585, 1558, 1522, 1491, 1419, 1373, 1290, 1240, 1161, 1049, 768, 669, 503, 470 cm−1. Anal. Calcd for C17H15ClN4NiO4: C, 47.10; H, 3.49; N, 12.93; found: C, 47.21; H, 3.32; N, 12.85.
Cu(H2L1)Cl (3). Mp 247–248 °C; 1H NMR (600 MHz, DMSO-d6): 11.58 (s, 1H), 10.15 (s, 1H), 7.57–7.14 (m, 5H), 5.88 (s, 2H), 3.31 (s, 3H), 2.62 (s, 3H). 13C NMR (151 MHz, DMSO-d6): 164.9, 160.8, 153.8, 146.3, 140.7, 136.5, 133.8, 132.5, 132.0, 129.9, 126.4, 95.4, 56.5, 34.5, 12.0. UV-VIS (nm/log
![[thin space (1/6-em)]](https://www.rsc.org/images/entities/char_2009.gif) ε): 442/4.38; 532/3.29. IR: 1628, 1591, 1585, 1522, 1497, 1456, 1437, 1418, 1381, 1360, 1344, 1290, 1198, 1152, 1051, 1028, 962, 866, 777, 702, 615, 507, 472 cm−1. Anal. Calcd for C17H15ClCuN4O4: C, 70.12; H, 4.55; N, 7.43; found: C, 70.20; H, 4.55; N, 7.16.
ε): 442/4.38; 532/3.29. IR: 1628, 1591, 1585, 1522, 1497, 1456, 1437, 1418, 1381, 1360, 1344, 1290, 1198, 1152, 1051, 1028, 962, 866, 777, 702, 615, 507, 472 cm−1. Anal. Calcd for C17H15ClCuN4O4: C, 70.12; H, 4.55; N, 7.43; found: C, 70.20; H, 4.55; N, 7.16.
Zn(H2L1)Cl·2H2O (4). Mp 301–302 °C 1H NMR (600 MHz, DMSO-d6): 12.13 (s, 1H), 9.85 (s, 1H), 7.63–7.46 (s, 5H), 5.51 (s, 2H), 3.41 (s, 3H), 2.49 (s, 3H). 13C NMR (151 MHz, DMSO-d6): 169.3, 166.2, 156.3, 145.6, 131.9, 130.7, 130.4, 128.8, 125.0, 122.9, 117.7, 100.0, 96.8, 90.91, 56.6, 34.3, 19.1. UV-VIS (nm/log
![[thin space (1/6-em)]](https://www.rsc.org/images/entities/char_2009.gif) ε): 433/4.35; 477/4.15. IR: 1630, 1599, 1584, 1581, 1528, 1493, 1427, 1379, 1350, 1296, 1244, 1195, 1178, 1163, 1103, 1051, 1039, 957, 773, 698, 501, 476 cm−1. Anal. Calcd for C17H19ClN4O6Zn: C, 42.88; H, 4.02; N, 11.77; found: C, 42.67; H, 4.05; N, 11.66.
ε): 433/4.35; 477/4.15. IR: 1630, 1599, 1584, 1581, 1528, 1493, 1427, 1379, 1350, 1296, 1244, 1195, 1178, 1163, 1103, 1051, 1039, 957, 773, 698, 501, 476 cm−1. Anal. Calcd for C17H19ClN4O6Zn: C, 42.88; H, 4.02; N, 11.77; found: C, 42.67; H, 4.05; N, 11.66.
Cd2(H3L1)2Cl4 (5). Mp 245–246 °C; 1H NMR (600 MHz, DMSO-d6): 11.48 (s, 1H), 10.09 (s, 1H), 7.51–7.31 (s, 5H), 5.82 (s, 2H), 3.26 (s, 3H), 2.58 (s, 3H). 13C NMR (151 MHz, DMSO-d6): 162.8, 159.8, 156.9, 146.2, 134.6, 129.8, 128.4, 126.4, 122.9, 120.8, 95.3, 34.8, 12.1. UV-VIS (nm/log
![[thin space (1/6-em)]](https://www.rsc.org/images/entities/char_2009.gif) ε): 433/4.39. IR: 1635, 1607, 1533, 1491, 1466, 1410, 1360, 1327, 1290, 1207, 1152, 1051, 1026, 907, 818, 767, 696, 598, 494, 472 cm−1. Anal. Calcd for C34H32Cd2Cl4N8O8: C, 38.99; H, 3.08; N, 10.07; found: C, 38.91; H, 3.10; N, 10.16.
ε): 433/4.39. IR: 1635, 1607, 1533, 1491, 1466, 1410, 1360, 1327, 1290, 1207, 1152, 1051, 1026, 907, 818, 767, 696, 598, 494, 472 cm−1. Anal. Calcd for C34H32Cd2Cl4N8O8: C, 38.99; H, 3.08; N, 10.07; found: C, 38.91; H, 3.10; N, 10.16.
Co(HL2)·4H2O (6). Mp 226–227 °C; UV-VIS (nm/log
![[thin space (1/6-em)]](https://www.rsc.org/images/entities/char_2009.gif) ε): 409/4.27. IR: 1667, 1640, 1606, 1577, 1561, 1526, 1509, 1495, 1402, 1311, 1250, 1147, 1048, 1024, 873, 766, 694, 511, 459 cm−1. Anal. Calcd for C17H20CoN6O10: C, 38.72; H, 3.79; N, 15.94; Co, 11.17; found: C, 38.56; H, 3.88; N, 15.69; Co, 11.01.
ε): 409/4.27. IR: 1667, 1640, 1606, 1577, 1561, 1526, 1509, 1495, 1402, 1311, 1250, 1147, 1048, 1024, 873, 766, 694, 511, 459 cm−1. Anal. Calcd for C17H20CoN6O10: C, 38.72; H, 3.79; N, 15.94; Co, 11.17; found: C, 38.56; H, 3.88; N, 15.69; Co, 11.01.
Ni(HL2)·6H2O (7). Mp 234–235 °C; UV-VIS (nm/log
![[thin space (1/6-em)]](https://www.rsc.org/images/entities/char_2009.gif) ε): 368/4.25. IR: 1611, 1556, 1533, 1506, 1456, 1422, 1371, 1306, 1144, 1053, 1024, 862, 770, 702, 515, 453 cm−1. Anal. Calcd for C17H24N6O12Ni: C, 43.30; H, 4.03; N, 14.12; Ni, 10.94; found: C, 43.50; H, 4.15; N, 14.16; Co, 11.06.
ε): 368/4.25. IR: 1611, 1556, 1533, 1506, 1456, 1422, 1371, 1306, 1144, 1053, 1024, 862, 770, 702, 515, 453 cm−1. Anal. Calcd for C17H24N6O12Ni: C, 43.30; H, 4.03; N, 14.12; Ni, 10.94; found: C, 43.50; H, 4.15; N, 14.16; Co, 11.06.
Cu(HL2)·4H2O (8). Mp 221–222 °C; UV-VIS (nm/log
![[thin space (1/6-em)]](https://www.rsc.org/images/entities/char_2009.gif) ε): 314/4.25; 485/4.17. IR: 1653, 1636, 1601, 1582, 1543, 1508, 1481, 1456, 1420, 1339, 1217, 1170, 1036, 984, 871, 700, 592, 510, 484 cm−1. Anal. Calcd for C17H20CuN6O10: C, 38.34; H, 3.76; N, 15.79; Cu, 12.03; found: C, 38.11; H, 3.55; N, 15.36; Cu, 11.91.
ε): 314/4.25; 485/4.17. IR: 1653, 1636, 1601, 1582, 1543, 1508, 1481, 1456, 1420, 1339, 1217, 1170, 1036, 984, 871, 700, 592, 510, 484 cm−1. Anal. Calcd for C17H20CuN6O10: C, 38.34; H, 3.76; N, 15.79; Cu, 12.03; found: C, 38.11; H, 3.55; N, 15.36; Cu, 11.91.
Zn(HL2)·6H2O (9). Mp 210–211 °C; UV-VIS (nm/log
![[thin space (1/6-em)]](https://www.rsc.org/images/entities/char_2009.gif) ε): 401/4.15. IR: 1697, 1666, 1662, 1607, 1585, 1545, 1516, 1437, 1420, 1369, 1335, 1306, 1134, 1104, 978, 943, 885, 700, 515, 457 cm−1. Anal. Calcd for C17H24N6O12Zn: C, 35.84; H, 4.25; N, 14.75; Zn, 11.47; found: C, 35.99; H, 4.55; N, 14.56; Zn, 11.52.
ε): 401/4.15. IR: 1697, 1666, 1662, 1607, 1585, 1545, 1516, 1437, 1420, 1369, 1335, 1306, 1134, 1104, 978, 943, 885, 700, 515, 457 cm−1. Anal. Calcd for C17H24N6O12Zn: C, 35.84; H, 4.25; N, 14.75; Zn, 11.47; found: C, 35.99; H, 4.55; N, 14.56; Zn, 11.52.
Cd(HL2)·6H2O (10). Mp 223–224 °C. UV-VIS (nm/log
![[thin space (1/6-em)]](https://www.rsc.org/images/entities/char_2009.gif) ε): 410/4.18. IR: 1658, 1615, 1587, 1549, 1493, 1422, 1375, 1287, 1159, 1074, 991, 804, 771, 698, 514, 450 cm−1. Anal. Calcd for C17H24CdN6O12: C, 33.10; H, 3.92; N, 13.62; Cd, 18.22; found: C, 33.30; H, 3.95; N, 13.16, Cd, 18.15.
ε): 410/4.18. IR: 1658, 1615, 1587, 1549, 1493, 1422, 1375, 1287, 1159, 1074, 991, 804, 771, 698, 514, 450 cm−1. Anal. Calcd for C17H24CdN6O12: C, 33.10; H, 3.92; N, 13.62; Cd, 18.22; found: C, 33.30; H, 3.95; N, 13.16, Cd, 18.15.
Author contributions
Anh Van Nguyen: data curation; writing – review & editing. Anh Thi Ngoc Vu: investigation; methodology; writing – original draft. Liya V. Bazan: investigation; formal analysis of EPR. Ravil T. Galeev: investigation; formal analysis of EPR. Andrey N. Utenyshev: visualization; software. Ekaterina B. Markova: investigation; validation. Olga V. Kovalchukova: supervision; project administration. Van Thuan Le: data curation; software.Conflicts of interest
There are no conflicts to declare.Acknowledgements
This paper has been supported by the RUDN University Strategic Academic Leadership Program. The study has been performed within the framework of the State Assignment (No. AAAA-A19-119092390076-7).References
- G. E. H. Elgemeie, H. H. Maher and M. Heba, Pigm. Resin Technol., 2001, 30, 210–228 CrossRef CAS
.
- C. S. Nadim, S. Zumbuehl, F. Delavy, A. Fritsch and R. Kuehnen, Spectrochim. Acta, Part A, 2009, 73, 505–524 CrossRef PubMed
.
- F. Marchetti, C. Pettinari and R. Pettinari, Coord. Chem. Rev., 2005, 249, 2909–2945 CrossRef CAS
.
- N. Ertan and F. Eyduran, Dyes Pigm., 1995, 27, 313–320 CrossRef CAS
.
- F. Marchetti, C. Pettinari, C. di Nicola, A. Tombesi and R. Pettinari, Coord. Chem. Rev., 2019, 401, 213069 CrossRef CAS
.
- Z. Zhao, X. Dai, C. Li, X. Wang, J. Tian, Y. Feng and J. Xie, Eur. J. Med. Chem., 2020, 186, 111893 CrossRef CAS PubMed
.
- S. José Casas, S. G. María, S. Agustín, S. José and T. Ángeles, Coord. Chem. Rev., 2007, 251, 1561 CrossRef
.
- M. N. Al-Jibouri, Eur. Chem. Bull., 2014, 3(5), 447–451 Search PubMed
.
- S. P. Hiremath, K. Rudresh and A. R. Saundane, Indian J. Chem., Sect. B: Org. Chem. Incl. Med. Chem., 2002, 41, 394–399 Search PubMed
.
- F. R. Souza, V. T. Souza, V. Ratzlaff, L. P. Borges, M. R. Oliveira, H. G. Bonacorso, N. Zanatta, M. A. P. Martins and C. F. Mello, Eur. J. Pharmacol., 2002, 451, 141–147 CrossRef CAS PubMed
.
- S. Gupta, S. Gupta and H. Kulshrashtha, J. Chem. Pharm. Res., 2012, 4(1), 75–77 CAS
.
- I. M. Banat, P. Nigam, D. Singh and R. Marchant, Bioresour. Technol., 1996, 58, 217–227 CrossRef CAS
.
- S. Okonek, Br. J. Clin. Pharmacol., 1980, 10, 385S–390S CrossRef PubMed
.
- A. Kimata, H. Nakagawa, R. Ohyama, T. Fukuuchi, S. Ohta, K. Dohura, T. Suzuki and N. Miyata, J. Med. Chem., 2007, 50(21), 5053–5056 CrossRef CAS PubMed
.
- J. O. Otutu, Int. J. Res. Rev. Appl. Sci., 2013, 15(2), 292–296 Search PubMed
.
- A. M. MacMillan and G. L. Verdine, J. Org. Chem., 1990, 55(24), 5931–5933 CrossRef CAS
.
- F. Samieh, M. T. Ahmad, H. Hooshang and K. Hojatollah, ARKIVOC, 2008, XIV, 115–123 Search PubMed
.
- M. M. Matlock, K. R. Henke and D. A. Atwood, J. Hazard. Mater., 2002, 92, 129–142 CrossRef CAS PubMed
.
- Heavy Metals in Soils, ed. B. J. Alloway, Chapman and Hall, Glasgow, UK, 2nd edn, 1995, ch. 6, 8, 9, and 11 Search PubMed
.
- X. Ying and Z. Fang, J. Hazard. Mater., 2006, 137, 1636–1642 CrossRef CAS PubMed
.
- K. R. Henke, Water Environ. Res., 1998, 70(6), 1178–1185 CrossRef CAS
.
- K. R. Henke, D. Robertson, M. Krepps and D. A. Atwood, Water Res., 2000, 34(11), 3005–3013 CrossRef CAS
.
- M. M. Matlock, K. R. Henke, D. A. Atwood and J. D. Robertson, Water Res., 2001, 35(15), 3649–3655 CrossRef CAS PubMed
.
- A. I. Mikhaleva, A. B. Zaitsev and B. A. Trofimov, Russ. Chem. Rev., 2006, 75(9), 797–823 CrossRef CAS
.
- S. M. Mamdouh, M. K. Hesham and E. A. Alaa, Spectrochim. Acta, Part A, 2015, 137(25), 1417–1425 Search PubMed
.
- K. Norris and S. Sternhe, Aust. J. Chem., 1966, 19, 841–860 CrossRef
.
- A. Chakravorty, Coord. Chem. Rev., 1974, 13, 1–46 CrossRef CAS
.
- J. Charalambous, D. V. Raghvani, O. Carugo, C. B. Castallani and N. Sardone, Polyhedron, 1996, 15, 803–808 CrossRef CAS
.
- K. Djinovic, O. Carugo and C. B. Castellani, Inorg. Chim. Acta, 1992, 202, 59–65 CrossRef CAS
.
- Y.-N. Liu, W.-Z. Liang, X.-G. Sang, Y.-Q. Huo, S.-T. Lap, K.-F. Yung and X.-X. Liu, Inorg. Chim. Acta, 2010, 363, 949–956 CrossRef CAS
.
- O. Kovalchukova, D. D. Nguyen, S. Adam, B. Vitaly, S. Paul, A. Alafinov, O. Volyansky, S. Strashnova and K. Kobrakov, Cryst. Struct. Theory Appl., 2012, 1, 46–51 Search PubMed
.
- D. D. Nguyen, O. Kovalchukova, A. Stash and S. Strashnova, Acta Crystallogr., Sect. E: Struct. Rep. Online, 2013, 69, m602–m603 CrossRef PubMed
.
- A. Van Nguyen, A. T. N. Vu, A. N. Utenyshev and O. V. Kovalchukova, ChemistrySelect, 2021, 6(14), 3461–3467 CrossRef CAS
.
- G. Shabir, G. Hussain, A. Saeed, T. Hussain, T. Hökelek, M. F. Erben and U. Flörke, J. Mol. Model., 2021, 27(10), 296 CrossRef CAS PubMed
.
- D. Kivelson and R. Neiman, J. Chem. Phys., 1961, 35, 149–155 CrossRef CAS
.
- O. Kahn, Molecular Magnets 1993, VCH Publishers, Inc., New York, 1993 Search PubMed
.
- A. Abragam and B. Bleaney, Electron Paramagnetic Resonance of Transition Ions, Clarendon, Oxford, 1970 Search PubMed
.
- X. Ying and Z. Fang, J. Hazard. Mater., 2006, 137, 1636–1642 CrossRef CAS PubMed
.
- APEX3 v2019.11-0, Bruker AXS Inc., Madison, WI, USA, 2019 Search PubMed
.
- SAINT v8.40a, Bruker AXS Inc., Madison, WI, USA, 2016 Search PubMed
.
- SADABS-2016/2, Bruker AXS Inc., Madison, WI, USA, 2016 Search PubMed
.
- G. M. Sheldrick, Acta Crystallogr., Sect. A: Found. Adv., 2015, 71, 3–8 CrossRef PubMed
.
- G. M. Sheldrick, Acta Crystallogr., Sect. C: Struct. Chem., 2015, 71, 3–8 Search PubMed
.
- O. V. Dolomanov, L. J. Bourhis, R. J. Gildea, J. A. K. Howard and H. Puschmann, J. Appl. Crystallogr., 2009, 42, 339–341 CrossRef CAS
.
- N. M. Dyatlova, V. Y. Temkina and I. D. Kolpakova, Kompleksony (Complexones), Khimiya, Moscow, 1970 Search PubMed
.
Footnote |
| † Electronic supplementary information (ESI) available. CCDC 2061914. For ESI and crystallographic data in CIF or other electronic format see DOI: 10.1039/d1ra07254d |
| This journal is © The Royal Society of Chemistry 2022 |

