 Open Access Article
Promotional mechanism of enhanced denitration activity with Cu modification in a Ce/TiO2–ZrO2 catalyst for a low temperature NH3-SCR system†
Wei Zhang *ab,
Yunhao Tangab,
Wei Xiaoab,
Min Ruanab,
Yanshan Yinab,
Quanbin Songab,
Kang Xieab,
Chuan Qinab,
Mengyao Dongab,
Yunhe Zhouab and
Jie Li*ab
aCollege of Energy and Power Engineering, Changsha University of Science & Technology, Changsha, 410114, China. E-mail: weizhang@csust.edu.cn
bKey Laboratory of Renewable Energy Electric-Technology of Hunan Province, Changsha, 410114, China
First published on 21st December 2021
Abstract
This study aims to investigate the enhanced low temperature denitration activity and promotional mechanism of a cerium-based catalyst through copper modification. In this paper, copper and cerium oxides were supported on TiO2–ZrO2 by an impregnation method, their catalytic activity tests of selective catalytic reduction (SCR) of NO with NH3 were carried out and their physicochemical properties were characterized. The CuCe/TiO2–ZrO2 catalyst shows obviously enhanced NH3-SCR activity at low temperature (<300 °C), which is associated with the well dispersed active ingredients and the synergistic effect between copper and cerium species (Cu2+ + Ce3+ ↔ Cu+ + Ce4+), and the increased ratios of surface chemisorbed oxygen and Cu+/Cu2+ lead to the enhanced low-temperature SCR activity. The denitration reaction mechanism over the CuCe/TiO2–ZrO2 catalyst was investigated by in situ DRIFTS and DFT studies. Results illustrate that the NH3 is inclined to adsorb on the Cu acidic sites (Lewis acid sites), and the NH2 and NH2NO species are the key intermediates in the low-temperature NH3-SCR process, which can explain the promotional effect of Cu modification on denitration activity of Ce/TiO2–ZrO2 at the molecular level. Finally, we have reasonably concluded a NH3-SCR catalytic cycle involving the Eley–Rideal mechanism and Langmuir–Hinshelwood mechanism, and the former mechanism dominates in the NH3-SCR reaction.
1. Introduction
Nitrogen oxides (NOx) from automobile exhaust emissions and industrial processes can cause harmful effects on the ecological environment, such as photochemical smog, ozone depletion, acid rain, and the greenhouse effect.1,2 The selective catalytic reduction of NOx with NH3 (NH3-SCR) is the most efficient and widely used technology for the control of NOx emission.3,4 Traditional commercial vanadium–titanium catalysts have been used in various industrial fields due to their stability and high efficiency, but industrial application is still restrained by their inevitable drawbacks, including high operation temperature window, poisoning and deactivation of catalyst by deposited alkaline metal, and vanadium poisoning.5–7 Therefore, it is necessary to develop NH3-SCR catalysts with excellent denitration activity in low temperature ranges.Due to its preferable oxygen storage and redox properties, cerium-based catalyst has been extensively investigated to eliminate NOx during the past several years.8 However, the NH3-SCR activity of pure ceria is still very low, it is necessary to dope other transitional metals to improve the denitration performance of CeO2. Copper containing materials have been commonly employed as catalysts due to the good low-temperature activity in NH3-SCR process. Among them catalysts modified with copper, such as Cu-ZSM-5,9 Cu-MCM-41,10 Cu/SAPO-34,11 and Cu/TiO2 (ref. 12) have presented a high catalytic activity in the low temperature range. Moreover, it is reported that the synergistic interaction between Cu with Ce species can contribute to the enhancement of low temperature catalytic activity.13 Understanding the reaction mechanism over the catalyst is one of the core interests for the development of the NH3-SCR catalyst with high catalytic activity. The generally accepted NH3-SCR reaction mechanism includes two mechanisms in low temperature section, Eley–Rideal mechanism (adsorbed NH3 reacts with gaseous NO and then decomposes to N2 and H2O) and Langmuir–Hinshelwood mechanism (adsorbed NO reacts with adsorbed NH3 on the adjacent sites and then decomposes to N2 and H2O).14,15 Previously, it has been shown that a mixed Eley–Rideal mechanism and Langmuir–Hinshelwood mechanism for NH3-SCR reaction over Cu/SSZ-39 catalyst at low temperature.16 Moreover, Lewis acid sites on the Cu–Ce-USY catalyst surface play a crucial role in its excellent low temperature SCR performance.17 Although there are many studies on reaction mechanism of copper and copper–cerium catalysts, details on reaction path and mechanism still need to be further investigated.
In addition to the experimental methods, the quantum chemical theoretical calculation methods of molecular simulation, especially the density functional theory (DFT), has been widely used to study the reaction mechanism in the field of catalyst denitration.18 On the one hand, the theoretical calculations can solve several problems difficultly dealt with the experimental study, such as active intermediates and molecular reaction details. On the other hand, the mutual verification with the experimental results improves the credibility of the experiment. As the first step and important part in the SCR reaction, the NH3 and NO adsorption are related to the active acid sites and can lead to the generation of highly active intermediaries, which can be well discussed with DFT calculations.
In this paper, we explored the promotional mechanism of enhanced denitration activity on the cerium-based catalyst with copper modification for low temperature NH3-SCR reaction. Textural, morphological and redox properties of the catalysts were researched with a few physicochemical characterized measurements, such as XRD, SEM, and XPS techniques. The active adsorbed species and intermediates were detected with in situ diffuse reflectance infrared Fourier transform spectroscopy (in situ DRIFTS), and the adsorptions of NH3 and NO molecules were calculated with DFT method. The NH3-SCR reaction mechanism over CuCe/TiO2–ZrO2 catalyst was systematically investigated by the in situ DRIFTS measurements combined with DFT calculations, and the catalytic cycle was deduced. Elucidating the NH3-SCR reaction mechanism over CuCe/TiO2–ZrO2 catalyst in the molecular level could provide theoretical guidance for the design and development of modification on denitration catalysts.
2. Experimental and computational details
2.1 Catalyst preparation
The CuCe/TiO2–ZrO2 catalyst was prepared by impregnation method, and the amount of copper and cerium loading on the TiO2–ZrO2 support were 20 wt% and 10 wt%, respectively. The TiO2–ZrO2 (molar ratio of 1![[thin space (1/6-em)]](https://www.rsc.org/images/entities/char_2009.gif) :
:![[thin space (1/6-em)]](https://www.rsc.org/images/entities/char_2009.gif) 1) support was synthesized by sol–gel method. Firstly, a certain quantity of Ti(OC4H9)4 and ZrOCl2·8H2O (Guoyao Group Chemical Reagent Co., Ltd.) were dissolved in ethanol absolute, followed by dropwise addition of pre-prepared solution (the deionized water
1) support was synthesized by sol–gel method. Firstly, a certain quantity of Ti(OC4H9)4 and ZrOCl2·8H2O (Guoyao Group Chemical Reagent Co., Ltd.) were dissolved in ethanol absolute, followed by dropwise addition of pre-prepared solution (the deionized water![[thin space (1/6-em)]](https://www.rsc.org/images/entities/char_2009.gif) :
:![[thin space (1/6-em)]](https://www.rsc.org/images/entities/char_2009.gif) acetic acid
acetic acid![[thin space (1/6-em)]](https://www.rsc.org/images/entities/char_2009.gif) :
:![[thin space (1/6-em)]](https://www.rsc.org/images/entities/char_2009.gif) ethanol absolute = 2
ethanol absolute = 2![[thin space (1/6-em)]](https://www.rsc.org/images/entities/char_2009.gif) :
:![[thin space (1/6-em)]](https://www.rsc.org/images/entities/char_2009.gif) 2
2![[thin space (1/6-em)]](https://www.rsc.org/images/entities/char_2009.gif) :
:![[thin space (1/6-em)]](https://www.rsc.org/images/entities/char_2009.gif) 1 volume ratio). As addition of pre-prepared solution progressed to a certain extent, the precursor solution gradually became transparent and the pH of the solution increased to around 2. Afterwards, the mixed solution was stirred magnetically at room temperature until transparent sol was formed. Next, the mixture heated in a thermostatic water bath at 50 °C for 1 h and aged at room temperature for 12 h till the hydrosol became transparent gel. Finally, the gel was incubated at 80 °C for 5 h and kept at 120 °C overnight in an oven. The obtained product was ground and calcined at 500 °C for 3 h in the muffle furnace. Certain amount of Ce(NO3)3·6H2O (Tianjin Guangfu Fine Chemical Research Institute) and TiO2–ZrO2 were dissolved in deionized water, then the solution with magnetic stirring at 80 °C for 1 h. The obtained product was aged at room temperature for 12 h. Then, the mixture dried at 105 °C overnight in the oven and calcined at 450 °C for 4 h in a muffle furnace to obtain the Ce/TiO2–ZrO2 catalyst. The Cu/TiO2–ZrO2 catalyst was prepared with Cu(NO3)2·3H2O (Tianjin Fuchen Chemical Reagents Company) and TiO2–ZrO2 as precursors followed the same method. The Ce/TiO2–ZrO2 sample and corresponding amount of Cu(NO3)2·3H2O were dissolved in deionized water, then through magnetic stirring, evaporation, and calcination as with the above preparation method, and the catalyst prepared was denoted as CuCe/TiO2–ZrO2.
1 volume ratio). As addition of pre-prepared solution progressed to a certain extent, the precursor solution gradually became transparent and the pH of the solution increased to around 2. Afterwards, the mixed solution was stirred magnetically at room temperature until transparent sol was formed. Next, the mixture heated in a thermostatic water bath at 50 °C for 1 h and aged at room temperature for 12 h till the hydrosol became transparent gel. Finally, the gel was incubated at 80 °C for 5 h and kept at 120 °C overnight in an oven. The obtained product was ground and calcined at 500 °C for 3 h in the muffle furnace. Certain amount of Ce(NO3)3·6H2O (Tianjin Guangfu Fine Chemical Research Institute) and TiO2–ZrO2 were dissolved in deionized water, then the solution with magnetic stirring at 80 °C for 1 h. The obtained product was aged at room temperature for 12 h. Then, the mixture dried at 105 °C overnight in the oven and calcined at 450 °C for 4 h in a muffle furnace to obtain the Ce/TiO2–ZrO2 catalyst. The Cu/TiO2–ZrO2 catalyst was prepared with Cu(NO3)2·3H2O (Tianjin Fuchen Chemical Reagents Company) and TiO2–ZrO2 as precursors followed the same method. The Ce/TiO2–ZrO2 sample and corresponding amount of Cu(NO3)2·3H2O were dissolved in deionized water, then through magnetic stirring, evaporation, and calcination as with the above preparation method, and the catalyst prepared was denoted as CuCe/TiO2–ZrO2.
2.2 Catalyst activity test
The catalyst activity tests were carried out in a bench-scale experimental system at the temperature range of 150–400 °C. During each test, 0.2 g catalyst was put in the quartz tube of tubular furnace filled with the simulated flue gas. The reactant gas mixture contained 500 ppm NO, 500 ppm NH3, 5% O2 and N2 balanced, and the total flow rate of the feeding gas was 500 mL min−1, corresponding to a gas hourly space velocity (GHSV) of 60![[thin space (1/6-em)]](https://www.rsc.org/images/entities/char_2009.gif) 000 h−1. During each catalytic test, the temperature reached around the preset value, then reaction continued for 10 min until the readings of temperature and NO concentration were stable. Afterwards, the temperature and NO concentration were recorded every 30 s in 5 min, the average value was calculated and used to obtain the NO conversion. NO concentrations in the inlet and outlet gas were collected with a professional flue gas analyzer (Madur Photon & PGD-100, Austria). The denitration activity was determined by NO conversion, which was calculated by the following equation:
000 h−1. During each catalytic test, the temperature reached around the preset value, then reaction continued for 10 min until the readings of temperature and NO concentration were stable. Afterwards, the temperature and NO concentration were recorded every 30 s in 5 min, the average value was calculated and used to obtain the NO conversion. NO concentrations in the inlet and outlet gas were collected with a professional flue gas analyzer (Madur Photon & PGD-100, Austria). The denitration activity was determined by NO conversion, which was calculated by the following equation:where NO (in) represented the NO concentration in the feed gas and NO (out) expressed the NO concentration in the effluent stream.
2.3 Catalyst characterization
The X-ray diffraction (XRD) patterns of the different catalysts were collected with a D8 Advanced diffractometer (Bruker, Germany) with Cu Kα radiation in the 2θ range from 10° to 80°. The working voltage was 40 kV, and the working current was 30 mA.The Scanning electron microscopy (SEM) images of the samples were taken with a Quanta 250 FEG scanning electron microscope (FEI, USA) at an accelerating voltage of 30 kV.
The X-ray photoelectron spectroscopy (XPS) measurements were recorded on an Axis Ultra DLD spectrometer (Kratos, UK), Al Kα radiation was used as the excitation source. The binding energies were corrected by C1s peak at 284.6 eV to compensate the charging effect.
In situ DRIFTS experiments were performed on a Nicolet iS 50 FTIR spectrometer (Thermo Fisher, USA) equipped with an MCT/A detector. The catalyst was pretreated in the cell at 400 °C for 1 hour to remove adsorbed impurities, and then cooled down to 200 °C in N2 gas flow. The background spectrum was recorded in a flow of pure N2 atmosphere and subtracted automatically from the catalyst sample at 200 °C.
2.4 DFT calculations
The structural optimization, intermediates, transition states search, and calculated energy were analyzed in the DMol3 module in Materials Studio 2019. The generalized gradient approximation (GGA) with the Perdew–Burke–Ernzerhof (PBE) functional was used to describe the electron exchange–correlation potential.19 The interaction between the valence and the core electrons was described by the projector augmented wave (PAW).20 Brillouin zone was sampled by employing the 2 × 2 × 1 Monkhorst–Pack k-point grid and the plane wave cutoff energy was 400 eV. The maximum force of geometry optimization to 0.05 eV Å−1. The convergence tolerance values of total energy, maximum atomic forces and maximum displacement were 1 × 10⁻⁵ Hartree, 4 × 10⁻³ Hartree Å−1 and 5 × 10⁻³ Å, respectively.21CeO2 (1 1 1) has been previously reported to be the most stable among low index CeO2 facets,22,23 which is also in harmony with the experimental result in this paper. Therefore, the low-doped copper–ceria surface model was obtained from a CeO2 (1 1 1) slab, with a p (3 × 3) expansion of the surface unit cell, by substituting one surface Ce atom by one Cu atom. The optimized lattice parameters of the three-layer model were a = b = 11.64 Å, c = 26.71 Å, containing a vacuum layer of 20 Å set in the vertical direction to minimize the interaction between neighboring slab surfaces.
The adsorption energy was evaluated to characterize the adsorption properties of catalysts, which was defined by the following equation:
| Eads = Eslab,molecule − Eslab − Emolecule |
3. Results and discussion
3.1 NH3-SCR activity of the catalysts
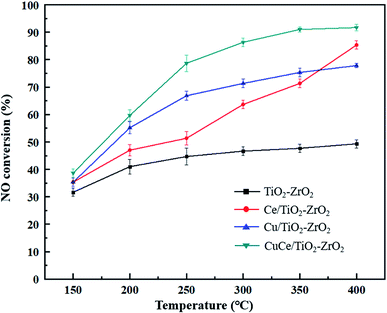
NO conversion over the different catalysts under the simulated flue gas conditions were performed to evaluate the denitration activity of the catalysts. As seen in Fig. 1, the NO conversion of TiO2–ZrO2 support was worst and below 50% during the whole reaction temperature range. The catalytic activity of Ce/TiO2–ZrO2 catalyst was obviously higher than TiO2–ZrO2 support at 300–400 °C, but still unsatisfactory at 150–250 °C. The Cu/TiO2–ZrO2 catalyst displayed a considerably enhanced activity at low temperature compared with TiO2–ZrO2 and Ce/TiO2–ZrO2 catalysts. NO conversion on CuCe/TiO2–ZrO2 catalyst exceeded 85% at the temperature above 300 °C. Moreover, the low-temperature NH3-SCR activity of CuCe/TiO2–ZrO2 catalyst was markedly higher than other catalysts. It can be observed that copper modification is beneficial to strengthen the low-temperature denitration activity of the cerium-based catalyst. In order to explain the reasons of high NO conversion over CuCe/TiO2–ZrO2 catalyst at low temperature interval, XRD, SEM and XPS characterization tests were carried to study textural, morphological and redox properties of the catalysts, and the DRIFTS studies combined with DFT calculations were developed to further explore the adsorption and reaction mechanism of NH3 and NO on CuCe/TiO2–ZrO2 catalyst.3.2 Textural and morphological analysis
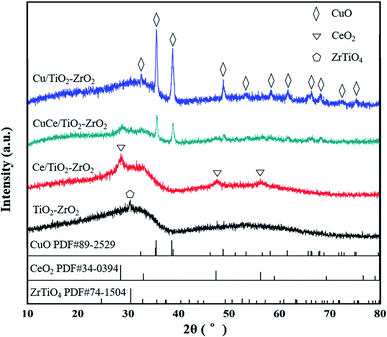
XRD measurement techniques were applied to determine the crystal structure of the catalysts and provide experimental foundation for the catalyst molecular model establishment in subsequent simulation calculation. As the results shown in Fig. 2, TiO2–ZrO2 support displays one characteristic peak at 2θ = 30.5°, the peak also shown in the XRD patterns of Ce/TiO2–ZrO2, Cu/TiO2–ZrO2 and CuCe/TiO2–ZrO2 catalysts, indicating the presence of ZrTiO4 phase (PDF# 74–1504). The characteristic peaks of (111), (220), (311) crystal faces can be observed in Ce loaded catalysts (PDF# 34-0394), and these diffraction peaks are situated at 28.5°, 47.4° and 56.3°, respectively.26 For Cu/TiO2–ZrO2 and CuCe/TiO2–ZrO2 catalysts, there are several diffraction peaks ascribed to CuO crystal structure locate at 32.5°, 35.6°, 38.7°, 48.8°, 53.4°, 58.2°, 61.6°, 66.3°, 68.0°, 72.3°, and 75.2° (PDF# 89-2529).27 Furthermore, the peak intensity of CuCe/TiO2–ZrO2 is weaker than that of Ce/TiO2–ZrO2 and Cu/TiO2–ZrO2. Thus, it can be concluded that there is strong interaction between CeO2 and CuO species, and the Cu and Ce active components are dispersed well on the CuCe/TiO2–ZrO2 catalyst surface.28SEM experiments were conducted to investigate the morphology of the catalysts, and Fig. 3 displays SEM images of various catalysts. It suggests that TiO2–ZrO2 presents a block structure loaded with several dense particles. For Ce/TiO2–ZrO2 catalyst, CeO2 particles agglomerate on the part region of the support. However, few particles deposit on the Cu/TiO2–ZrO2 catalyst surface. Both above cases will reduce the active surface area of the catalysts. Meanwhile, active components relative uniformly deposit on CuCe/TiO2–ZrO2, which is consistent with the XRD results. The high dispersibility is beneficial to increase the active surface area and low temperature denitration activity of the catalyst.
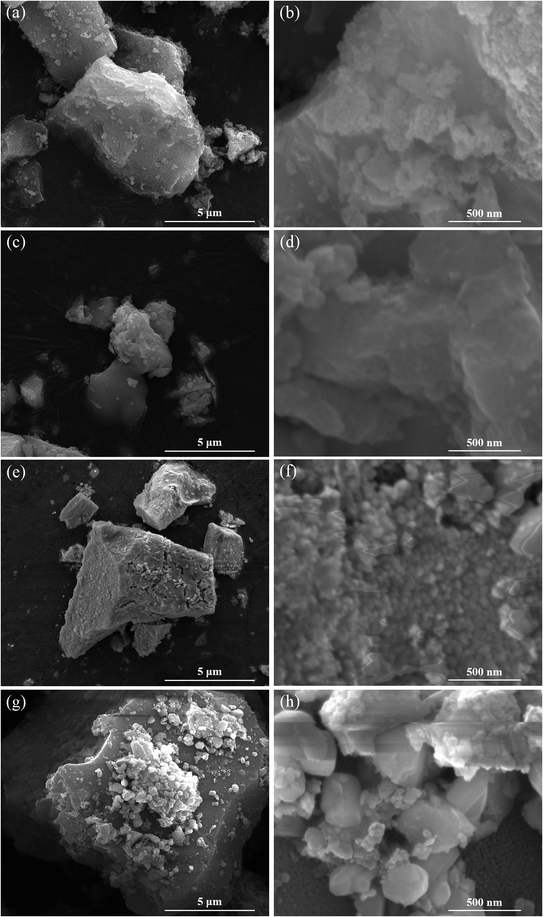 | ||
| Fig. 3 SEM images of (a and b) TiO2–ZrO2, (c and d) Ce/TiO2–ZrO2, (e and f) Cu/TiO2–ZrO2, (g and h) CuCe/TiO2–ZrO2 catalyst. | ||
3.3 Redox properties analysis
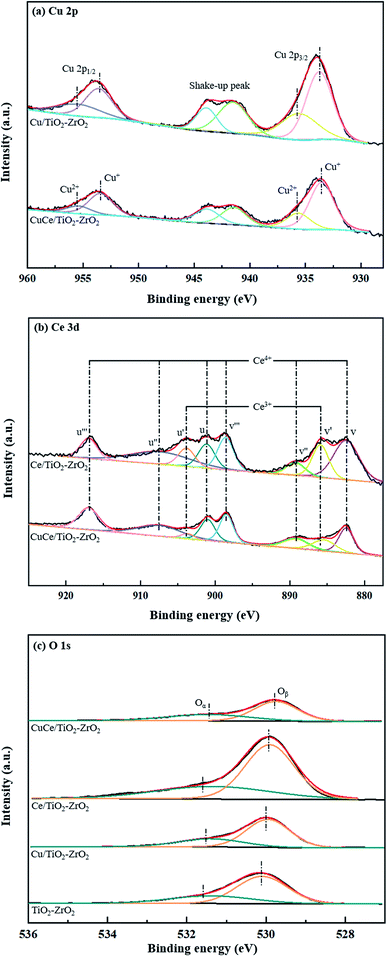
XPS analysis were performed to investigate the chemical element states of copper and cerium as well as active oxygen species on the raw and modified catalyst surfaces. In the Fig. 4(a), the peaks detected at about 933.8 and 953.6 eV are assigned to Cu 2p3/2 and Cu 2p1/2, and some shake-up satellite peaks within 940–945 eV are relevant to Cu2+ and polycrystalline Cu2O species.29 By the peak deconvolution, the Cu 2p3/2 splits into two peaks that are located at around 933.6 eV and 935.5 eV while the Cu 2p1/2 splits into two peaks that are detected at around 953.5 eV and 955.4 eV. The peaks at 933.6 eV and 953.5 eV can be contributed to the Cu+ species, while the peaks at 935.5 eV and 955.4 eV are corresponded to Cu2+ species. The result shows that both Cu+ and Cu2+ coexist in the CuCe/TiO2–ZrO2 catalyst, and Cu+ species may be generated from strong interface between copper oxide with cerium oxide.30 Fig. 4(b) shows the Ce 3d spectra for the catalysts, and the spectrum can be split into eight components. The peaks denoted as u' and v' are assigned to Ce3+, while the peaks denoted as u, u'', u''', v, v'' and v''' are attributed to Ce4+.31,32 The existence of Ce4+/Ce3+ redox couple contributes to the better NH3-SCR activity of the catalyst. Fig. 4(c) illustrates the O 1s spectra of different catalysts. The peak at low binding energy (529.8–530.1 eV) is assigned to the lattice oxygen (Oβ), and the other peak at high binding energy (531.2–531.6 eV) is regarded as the surface chemisorbed oxygen (Oα). It should be mentioned that Oα has been reported to play an important role in low-temperature NH3-SCR reaction due to its strong mobility.33Table 1 shows the surface chemical composition of the catalysts obtained from XPS spectra. It can be seen that the CuCe/TiO2–ZrO2 represents the highest ratio of surface chemisorbed oxygen, which is helpful to improve the low-temperature activity. Besides, the decrease of copper oxidation state and increase of cerium oxidation state coexist on CuCe/TiO2–ZrO2 catalyst compared to Ce/TiO2–ZrO2 and Cu/TiO2–ZrO2 catalysts. Therefore, the synergistic effect of copper and cerium occurs on catalyst surface, which is summarized as follows:
| Cu2+ + Ce3+ ↔ Cu+ + Ce4+ |
| Catalysts | Oα/(Oα+ Oβ) | Cu+/(Cu2+ + Cu+) | Ce3+/(Ce3+ + Ce4+) |
|---|---|---|---|
| TiO2–ZrO2 | 0.314 | — | — |
| Ce/TiO2–ZrO2 | 0.339 | — | 0.208 |
| Cu/TiO2–ZrO2 | 0.301 | 0.473 | — |
| CuCe/TiO2–ZrO2 | 0.376 | 0.554 | 0.127 |
It has been mentioned earlier that surface chemisorbed oxygen contributes to enhance the low-temperature activity, which also accord with the results from Fig. 1 and Table 1. Besides, Ce3+ has been confirmed to favor the generation of oxygen vacancies, resulting in a higher proportion of surface chemisorbed oxygen.34 However, Ce/TiO2–ZrO2 catalyst represents a higher ratio of Ce3+ and a lower ratio of Oα compared to CuCe/TiO2–ZrO2 catalyst. This may be due to the presence of Cu–Ce interface, which promotes the formation of oxygen vacancies and mobility of oxygen species.35 Therefore, the increased oxygen vacancies caused by the formation of Cu–Ce interface exceed the decreased oxygen vacancies resulted from the reduced Ce3+ concentration, causing more surface chemisorbed oxygen generated in CuCe/TiO2–ZrO2 catalyst.
The low-temperature activity is also related to the balanced populations of Cu+/Cu2+ sites and dominated by mobile NH3-solvated Cu species. In the low temperature range, Cu ions can form transient ion pairs and move through NH3 solvation, thus leading to the better denitration activity. Moreover, the increased ratio of Cu+/Cu2+ leads to the enhanced low-temperature SCR activity.36 The synergistic effect of copper and cerium also contributes to widen the operating temperature window for the SCR reaction below 300 °C,30 which leads to the good low-temperature NH3-SCR activity of the catalyst.
According to the above physicochemical characterization, it is reasonable to conclude that the well dispersed active species and the synergistic effect between Cu and Ce species assist to the improvement in low temperature NH3-SCR activity of CuCe/TiO2–ZrO2 catalyst.
3.4 In situ DRIFTS studies
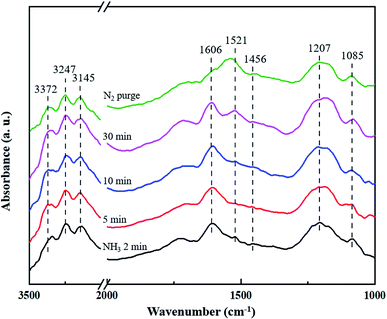
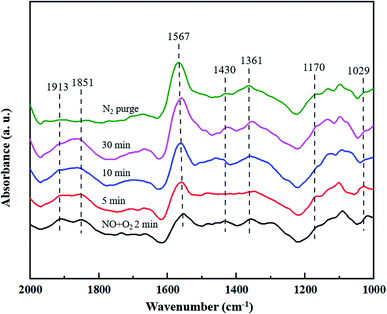
The CuCe/TiO2–ZrO2 catalyst with the best catalytic activity was selected for in situ DRIFTS characterization to identify the active sites, the adsorbed species and the intermediates on the catalyst surface, aiming at providing the experimental foundation for the adsorption of NH3 and NO as well as reaction pathways of intermediates in DFT calculations, thus figuring out the reaction mechanism of Cu modification on Ce/TiO2–ZrO2 catalyst in low temperature NH3-SCR system.3.5 DFT study
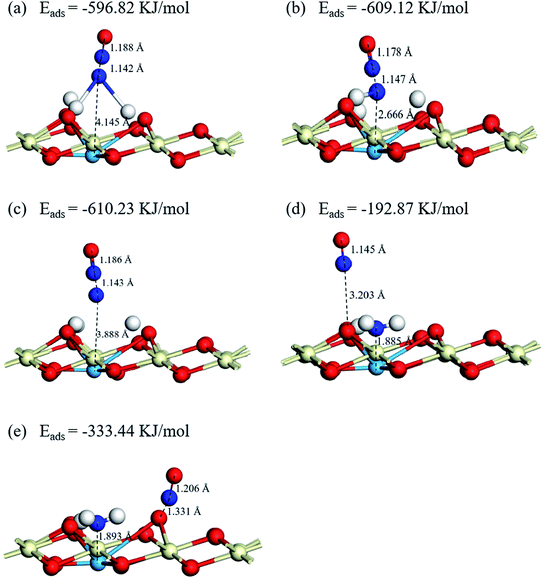
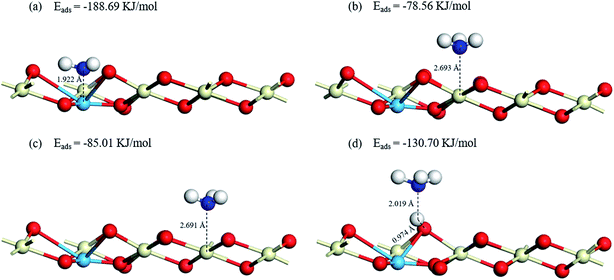 | ||
| Fig. 7 Optimized structures and energies of NH3 adsorptions on (a) Cu–O, (b) Ce1–O, (c) Ce2–O, (d) Cu–OH. | ||
Taking the above analysis results of NH3 adsorption into consideration, we focus our attention on NH3 dehydrogenation on the Cu atoms in this paper, the potential energy diagram and optimized structures of NH3 dehydrogenation reaction over catalysts are present in Fig. 8, S1,† and Table 2 presents the energy changes of each step involved in the dehydrogenation reaction. On the process, NH3 molecule firstly adsorbs on the top site of Cu atom with its nitrogen end (IM1). H-migration happens after the NH3 adsorption on the catalyst surface, one H atom (H1) of the intermediate Cu–NH3 migrates to the adjacent O atom to form a new Brønsted acid site, the reaction heat is 19.56 kJ mol−1 while the activation energy barrier is 49.05 kJ mol−1. Then the NH2 fragment (IM2) continues to lose H atom (H2) to generate NH, the reaction heat is 20.08 kJ mol−1 while the activation energy barrier can reach 39.38 kJ mol−1. Finally, NH (IM3) can also be continuously dehydrogenated, one H atom (H3) is transferred to bond with the O atom and only one N atom left on the copper atom (IM4), and the reaction heat is 6.66 kJ mol−1 while the activation energy barrier is 23.12 kJ mol−1. The result shows that the activation energy barrier gradually decreases in the NH3 dehydrogenation process, indicating the NH3 dissociation reaction is getting easier. According to the optimized structures of the intermediates and the transition states shown in Fig. S1,† there are symmetric and asymmetric N–H stretching vibrations of the coordinated NH3 on Lewis acid sites during the NH3 dehydrogenation reaction process, which can be verified by the NH3 adsorption results in in situ DRIFTS studies. Moreover, the reaction path shows that the NH2 fragment has the lowest energy in the dehydrogenation products, showing it can steadily adsorb on the catalyst surface, which also in harmony with the experimental results.
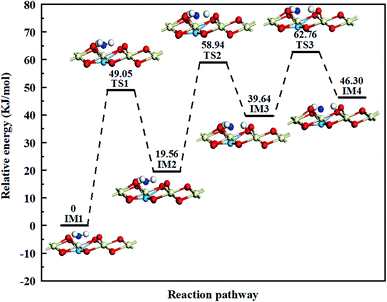 | ||
| Fig. 8 Potential energy diagram and optimized structures of NH3 dehydrogenation reaction on the Cu atoms. The energy of the reactant is taken as zero. | ||
| Reaction energy (kJ mol−1) | Energy barrier (kJ mol−1) | |
|---|---|---|
| IM1 → TS1 →I M2 | 19.56 | 49.05 |
| IM2 → TS2 → IM3 | 20.08 | 39.38 |
| IM3 → TS3 → IM4 | 6.66 | 23.12 |
3.6 Proposed reaction mechanism
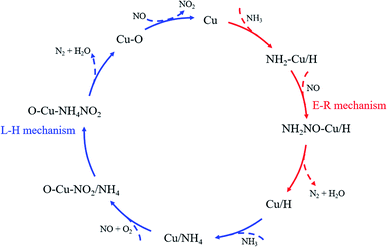
Combining the experimental and DFT results obtained in this paper and the results of previous studies,48–53 the NH3-SCR reaction mechanism on CuCe/TiO2–ZrO2 catalyst at low temperature is exhibited and the explanation follows.The foundational reaction involves the participation of NH3 and NO to generate N2 and H2O, the H atom remained will be connected with the O atom adjacent to Cu atom to form new Brønsted acid site. In detail, the adsorbed NH3 linked to the Lewis acid sites can be activated to form the amino group (–NH2). Then it will further react with gaseous NO to form NH2NO, which is the key intermediate product in the reaction process, and finally decomposes into gas phase N2 and H2O due to instability. The reaction follows Eley–Rideal reaction mechanism and the reaction steps are shown as reaction (1)–(4).
| NH3 (gas) → NH3 (ads) (on Lewis acid sites) | (1) |
| NH3 (ads) + O → NH2 + OH | (2) |
| NH2 + NO (gas) → NH2NO | (3) |
| NH2NO → N2 + H2O | (4) |
The regenerative reaction occurs on the Brønsted acid site formed from the foundational reaction, NH3 and NO participate in the reaction to produce N2 and H2O, and the remaining H atom is removed and the Lewis acid site is restored. In this process, gaseous NH3 adsorbs on the Brønsted acid site linked to the Cu atom to form NH4+ species. At the same time, gaseous NO bonds to the lattice oxygen atom to form monodentate nitrite (–NO2), creating an oxygen vacancy on the catalyst surface, which can be replenished by the active oxygen. Then NH4+ species migrates to the NO2 to form NH4NO2 intermediate product, and finally decomposes into gaseous N2 and H2O. The reaction follows Langmuir–Hinshelwood reaction mechanism and the reaction steps follow as reaction (5)–(8).
| NH3 (gas) → NH4+ (ads) (on Brønsted acid sites) | (5) |
| NO (gas) + O → NO2 (ads) | (6) |
| NH4+ (ads) + NO2 (ads) → NH4NO2 | (7) |
| NH4NO2 → N2 + 2H2O | (8) |
According to the in situ DRIFTS and DFT results obtained above, the NH3 adsorption on the Lewis acid sites should be far greater than that on the Brønsted acid sites, suggesting that the Eley–Rideal reaction mechanism dominates in the NH3-SCR reaction process.
As the final summarize comment, the multiple reaction mechanism herein proposed. It is developed from traditional lab-scale experiments and emerging quantum chemical simulations, involving in situ DRIFTS of NH3 adsorption and co-adsorption of NO and O2 as well as DFT calculations of NH3 adsorption, NH3 dehydrogenation and NO adsorption on the catalyst surface. The results can be reasonably extended to realistic operating conditions and provide support for the method of experiment combined with simulation in the NH3-SCR mechanism studies. The multiple reaction mechanism (shown in Fig. 10) includes Eley–Rideal reaction mechanism and Langmuir–Hinshelwood reaction mechanism. At low temperatures, the presence of gaseous NH3 ensures the continuous supply to the NH3 adsorption on the catalyst surface. Besides, the NH3 supplement can be divided into two parts to participate in the foundational reaction and regenerative reaction in the NH3-SCR catalytic cycle, and the amount of ammonia involved in the foundational reaction is much higher than that in the regenerative reaction. The NH3 feed will firstly result in the consumption of the Lewis acid sites, and then, to the activation of the newly generated Brønsted acid sites. Moreover, the Eley–Rideal reaction mechanism dominates in the denitration reaction and the oxidation of NO assists to close the catalytic cycle.
4. Conclusions
In this study, we investigated the improved denitration activity and promotional mechanism of cerium-based catalyst with copper modification in low temperature NH3-SCR denitration process. CuCe/TiO2–ZrO2 catalyst has enhanced catalytic activity in the low temperature range comparing to TiO2–ZrO2, Ce/TiO2–ZrO2 and Cu/TiO2–ZrO2 catalysts, which is mainly attributable to the well distributed particulates and synergistic effect of copper and cerium on catalyst surface. The high dispersion degree is helpful to increase the active surface area, and the synergistic effect between copper and cerium (Cu2+ + Ce3+ ↔ Cu+ + Ce4+) contributes to increase the ratios of surface chemisorbed oxygen and Cu+/Cu2+, thus leading to the better low-temperature SCR activity. In situ DRIFTS results and DFT calculations were used to study the adsorption and reaction mechanism of NH3 and NO on the CuCe/TiO2–ZrO2 catalyst for low-temperature NH3-SCR reaction. Results show that NH3 is inclined to adsorb on the Cu acidic sites and the NH2 and NH2NO species are the key intermediates in the denitration reaction process. Therefore, copper modification will markedly improve the low temperature denitration activity of cerium-based catalyst. We also reasonably conclude a NH3-SCR catalytic cycle involving the foundational reaction and regenerative reaction. The Eley–Rideal mechanism and Langmuir–Hinshelwood mechanism both occur in the cycle, and the former mechanism dominates in the denitration reaction.Author contributions
Wei Zhang: conceptualization, methodology, software, resources, data curation, supervision, project administration, funding acquisition. Yunhao Tang: formal analysis, writing-original draft, writing-review & editing, funding acquisition. Wei Xiao: investigation, visualization, validation. Min Ruan: writing-review & editing, funding acquisition. Yanshan Yin: writing-review & editing, funding acquisition. Quanbin Song: writing-review & editing, funding acquisition. Kang Xie: investigation, visualization. Chuan Qin: investigation, visualization. Mengyao Dong: investigation, validation. Yunhe Zhou: investigation, validation. Jie Li: investigation, validation.Conflicts of interest
There are no conflicts of interest to declare.Acknowledgements
This work was supported by the State Scholarship Fund awarded by China Scholarship Council (CSC) for Wei Zhang to pursue study in Canada as a visiting scholar (201808430112), Natural Science Foundation of Hunan Province (2020JJ4098, 2019JJ50665), Young Teacher Growth Plan Project of CSUST (2019QJCZ044), Key Laboratory of Renewable Energy Electric-Technology of Hunan Province (2020ZNDL001, 2020ZNDL002, 2018ZNDL004, 2016ZNDL005), 2021 Graduate Research and Innovation Project at Changsha University of Science and Technology (CX2021SS56), Excellent Youth Project of Hunan Provincial Department of Education (20B041), National Natural Science Foundation of China (51541601), Scientific Research Foundation of Hunan Provincial Education Department (18C0201).References
- M. Fu, C. Li, P. Lu, L. Qu, M. Zhang, Y. Zhou, M. Yu and Y. Fang, Catal. Sci. Technol., 2014, 4, 14–25, 10.1039/C3CY00414G.
- Y. Yang, Z. Hu, R. Mi, D. Li, X. Yong, H. Yang and K. Liu, RSC Adv., 2019, 9, 4682–4692, 10.1039/C8RA10077B.
- D. Wang, B. Huang, Z. Shi, H. Long, L. Li, Z. Yang and M. Dai, RSC Adv., 2021, 11, 18458–18467, 10.1039/d1ra02352g.
- X. Sun, Q. Liu, S. Liu, X. Zhang and S. Liu, RSC Adv., 2021, 11, 22780–22788, 10.1039/d1ra03845a.
- P. Wang, L. Yao, Y. Pu, L. Yang, X. Jiang and W. Jiang, RSC Adv., 2019, 9, 36658–36663, 10.1039/c9ra08640d.
- S. Xiong, Y. Peng, D. Wang, N. Huang, Q. Zhang, S. Yang, J. Chen and J. Li, Chem. Eng. J., 2020, 387, 124090, DOI:10.1016/j.cej.2020.124090.
- X. Wang, Q. Fang, J. Wang, K. Gui and H. R. Thomas, RSC Adv., 2020, 10, 44876–44883, 10.1039/d0ra07351b.
- H. Zhang, L. Ding, H. Long, J. Li, W. Tan, J. Ji, J. Sun, C. Tang and L. Dong, J. Rare Earths, 2020, 38, 883–890, DOI:10.1016/j.jre.2020.01.005.
- P. Nakhostin Panahi, D. Salari, A. Niaei and S. M. Mousavi, Chin. J. Chem. Eng., 2015, 23, 1647–1654, DOI:10.1016/j.cjche.2015.08.003.
- A. Jankowska, A. Chłopek, A. Kowalczyk, M. Rutkowska, W. Mozgawa, M. Michalik, S. Liu and L. Chmielarz, Microporous Mesoporous Mater., 2021, 315, 110920, DOI:10.1016/j.micromeso.2021.110920.
- J. Cheng, S. Han, Q. Ye, S. Cheng, T. Kang and H. Dai, Microporous Mesoporous Mater., 2019, 278, 423–434, DOI:10.1016/j.micromeso.2019.01.013.
- X. Wang, X. Chen, L. Ye, P. Lu, Y. Liu, J. You, W. Zeng, L. Lu, C. Hu and D. Chen, Mol. Catal., 2020, 497, 111225, DOI:10.1016/j.mcat.2020.111225.
- B. Guan, H. Jiang, X. Peng, Y. Wei, Z. Liu, T. Chen, H. Lin and Z. Huang, Appl. Catal., A, 2021, 617, 118110, DOI:10.1016/j.apcata.2021.118110.
- L. Li, Y. Wu, X. Hou, B. Chu, B. Nan, Q. Qin, M. Fan, C. Sun, B. Li, L. Dong and L. Dong, Ind. Eng. Chem. Res., 2018, 58, 849–862, DOI:10.1021/acs.iecr.8b05066.
- D. Wang, Y. Peng, S.-c. Xiong, B. Li, L.-n. Gan, C.-m. Lu, J.-j. Chen, Y.-l. Ma and J.-h. Li, Appl. Catal., B, 2018, 221, 556–564, DOI:10.1016/j.apcatb.2017.09.045.
- G. Fu, R. Yang, Y. Liang, X. Yi, R. Li, N. Yan, A. Zheng, L. Yu, X. Yang and J. Jiang, Microporous Mesoporous Mater., 2021, 320, 111060, DOI:10.1016/j.micromeso.2021.111060.
- J. Zhou, C. Zhao, J. Lin, H. Yang and R. Zhou, Catal. Commun., 2018, 114, 60–64, DOI:10.1016/j.catcom.2018.05.008.
- Z. Zhao, E. Li, Y. Qin, X. Liu, Y. Zou, H. Wu and T. Zhu, J. Environ. Sci., 2020, 90, 119–137, DOI:10.1016/j.jes.2019.11.008.
- X. Yan, J. Liu, Y. Yang, Z. Wang and Y. Zheng, Fuel Process. Technol., 2021, 216, 106798, DOI:10.1016/j.fuproc.2021.106798.
- S. Chen, M. A. Vasiliades, Q. Yan, G. Yang, X. Du, C. Zhang, Y. Li, T. Zhu, Q. Wang and A. M. Efstathiou, Appl. Catal., B, 2020, 277, 119186, DOI:10.1016/j.apcatb.2020.119186.
- Y. Jiang, T. Liu, C. Lai, Z. Yang, R. Lin, X. Wang and X. Zhu, Appl. Surf. Sci., 2021, 547, 149196, DOI:10.1016/j.apsusc.2021.149196.
- J. Wang and X. Gong, Appl. Surf. Sci., 2018, 428, 377–384, DOI:10.1016/j.apsusc.2017.09.120.
- S. Hassan, R. Kumar, A. Tiwari, W. Song, L. v. Haandel, J. K. Pandey, E. Hensen and B. Chowdhury, Mol. Catal., 2018, 451, 238–246, DOI:10.1016/j.mcat.2018.01.025.
- D. Ren, K. Gui and S. Gu, Appl. Surf. Sci., 2021, 561, 149847, DOI:10.1016/j.apsusc.2021.149847.
- D. Ren, K. Gui and S. Gu, Mol. Catal., 2021, 502, 111373, DOI:10.1016/j.mcat.2020.111373.
- Y. Zhou, S. Ren, J. Yang, W. Liu, Z. Su, Z. Chen, M. Wang and L. Chen, J. Energy Inst., 2021, 98, 199–205, DOI:10.1016/j.joei.2021.05.006.
- W. Zhang, Y. Tang, C. Lu, J. Zou, M. Ruan, Y. Yin, M. Qing and Q. Song, Ultrason. Sonochem., 2021, 72, 105466, DOI:10.1016/j.ultsonch.2021.105466.
- R. Guo, W. Zhen, W. Pan, Y. Zhou, J. Hong, H. Xu, Q. Jin, C. Ding and S. Guo, J. Ind. Eng. Chem., 2014, 20, 1577–1580, DOI:10.1016/j.jiec.2013.07.051.
- S. Ali, L. Chen, Z. Li, T. Zhang, R. Li, S. u. H. Bakhtiar, X. Leng, F. Yuan, X. Niu and Y. Zhu, Appl. Catal., B, 2018, 236, 25–35, DOI:10.1016/j.apcatb.2018.05.014.
- G. Chi, B. Shen, R. Yu, C. He and X. Zhang, J. Hazard. Mater., 2017, 330, 83–92, DOI:10.1016/j.jhazmat.2017.02.013.
- J. Fan, P. Ning, Z. Song, X. Liu, L. Wang, J. Wang, H. Wang, K. Long and Q. Zhang, Chem. Eng. J., 2018, 334, 855–863, DOI:10.1016/j.cej.2017.10.011.
- Y. Zhang, P. Wu, K. Zhuang, K. Shen, S. Wang and W. Guo, Materials, 2019, 12, 2534, DOI:10.3390/ma12162534.
- B. Shen, Y. Wang, F. Wang and T. Liu, Chem. Eng. J., 2014, 236, 171–180, DOI:10.1016/j.cej.2013.09.085.
- C. Santra, A. Auroux and B. Chowdhury, RSC Adv., 2016, 6, 45330–45342, 10.1039/C6RA05216A.
- J. Lu, J. Zhong, Q. Ren, J. Li, L. Song, S. Mo, M. Zhang, P. Chen, M. Fu and D. Ye, Chin. Chem. Lett., 2021 DOI:10.1016/j.cclet.2021.05.029.
- N. Zhu, Z. Lian, Y. Zhang, W. Shan and H. He, Appl. Surf. Sci., 2019, 483, 536–544, DOI:10.1016/j.apsusc.2019.03.336.
- L. Chen, Z. Si, X. Wu and D. Weng, ACS Appl. Mater. Interfaces, 2014, 6, 8134–8145, DOI:10.1021/am5004969.
- J. Wang, Z. Yan, L. Liu, Y. Chen, Z. Zhang and X. Wang, Appl. Surf. Sci., 2014, 313, 660–669, DOI:10.1016/j.apsusc.2014.06.043.
- K. B. Nam, D. W. Kwon and S. C. Hong, Appl. Catal., A, 2017, 542, 55–62, DOI:10.1016/j.apcata.2017.05.017.
- L. Chen, J. Li and M. Ge, Environ. Sci. Technol., 2010, 44, 9590–959610, DOI:10.1021/es102692b.
- S. Xie, L. Li, L. Jin, Y. Wu, H. Liu, Q. Qin, X. Wei, J. Liu, L. Dong and B. Li, Appl. Surf. Sci., 2020, 515, 146014, DOI:10.1016/j.apsusc.2020.146014.
- Q. Zhang, J. Fan, P. Ning, Z. Song, X. Liu, L. Wang, J. Wang, H. Wang and K. Long, Appl. Surf. Sci., 2018, 435, 1037–1045, DOI:10.1016/j.apsusc.2017.11.180.
- Z. Ma, X. Wu, H. Härelind, D. Weng, B. Wang and Z. Si, J. Mol. Catal. A: Chem., 2016, 423, 172–180, DOI:10.1016/j.molcata.2016.06.023.
- K. I. Hadjiivanov, Catal. Rev., 2000, 42, 71–144, DOI:10.1081/CR-100100260.
- S. Liu, P. Yao, Q. Lin, S. Xu, M. Pei, J. Wang, H. Xu and Y. Chen, Catal. Today, 2021, 382, 34–41, DOI:10.1016/j.cattod.2021.05.007.
- L. Wei, S. Cui, H. Guo and L. Zhang, Comput. Mater. Sci., 2018, 144, 216–222, DOI:10.1016/j.commatsci.2017.12.013.
- Y. Peng, K. Li and J. Li, Appl. Catal., B, 2013, 140–141, 483–492, DOI:10.1016/j.apcatb.2013.04.043.
- L. Wei, S. Cui, H. Guo and X. Ma, Mol. Catal., 2018, 445, 102–110, DOI:10.1016/j.mcat.2017.11.022.
- B. Guan, H. Jiang, Y. Wei, Z. Liu, X. Wu, H. Lin and Z. Huang, Mol. Catal., 2021, 510, 111704, DOI:10.1016/j.mcat.2021.111704.
- H. Wu, M. He, W. Liu, L. Jiang, J. Cao, C. Yang, J. Yang, J. Peng, Y. Liu and Q. Liu, J. Environ. Chem. Eng., 2021, 9, 105426, DOI:10.1016/j.jece.2021.105426.
- S. Wang, R. Guo, W. Pan, Q. Chen, P. Sun, M. Li and S. Liu, Catal. Commun., 2017, 89, 143–147, DOI:10.1016/j.catcom.2016.11.005.
- G. Yang, J. Ran, X. Du, X. Wang, Y. Chen and L. Zhang, Microporous Mesoporous Mater., 2018, 266, 223–231, DOI:10.1016/j.micromeso.2018.01.034.
- F. Gao, C. Yang, X. Tang, H. Yi and C. Wang, J. Environ. Sci., 2022, 113, 204–218, DOI:10.1016/j.jes.2021.05.032.
Footnote |
| † Electronic supplementary information (ESI) available. See DOI: 10.1039/d1ra06325a |
| This journal is © The Royal Society of Chemistry 2022 |


