 Open Access Article
Creative Commons Attribution 3.0 Unported Licence
Comments on “Size dependence of the lattice parameters of carbon supported platinum nanoparticles: X-ray diffraction analysis and theoretical considerations,” RSC Adv., 2014, 4, 35959–35965
Erhard W. Rothe
Department of Chemical Engineering and Materials Science, Wayne State University, Detroit MI, 48202, USA. E-mail: erothe@wayne.edu
First published on 8th March 2022
Abstract
Leontyev and colleagues presented the results of an experiment and of its theoretical consequences. The interpretations were based on model-fits to that experiment. Unfortunately, they used two demonstrably incorrect parameters in their models. When the correct parameters are used, the best fits, and the corresponding theoretical implications, are interchanged. Specifically, they deduced an inapplicability of the Laplace–Young equation to the compression of nanoparticles. After their faulty parameters are corrected, this is no longer proven. An equation based on Laplace–Young pressure was dismissed by Leontyev et al., but when recalculated with corrected parameters, it fits their experimental data points.
Introduction
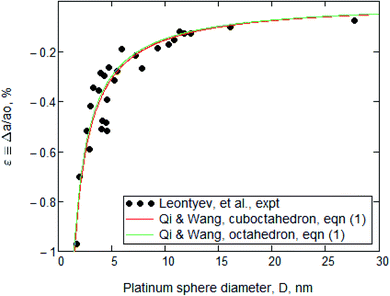
Leontyev et al.1 measured the effect of particle size upon the lattice parameter of nanocrystalline platinum. They reported the determination of a(D), where a is the lattice parameter and D is the particle diameter, in a range 3 nm < D < 27 nm. Those experimental data are displayed in both Fig. 1 and 2 and we have no reason to doubt them. | ||
| Fig. 1 Normalized plot of platinum lattice parameter as a function of particle diameter, i.e., ε(D). The data points are taken from Leontyev. They appear to be well fitted by the Qi and Wang model, i.e., eqn (1), as shown by the red and green lines. That good fit was the basis for Leontyev's claim for its suitability, but that pertains only when the incorrect value of G is used. Fig. 2 will show the result of using the correct G. | ||
 | ||
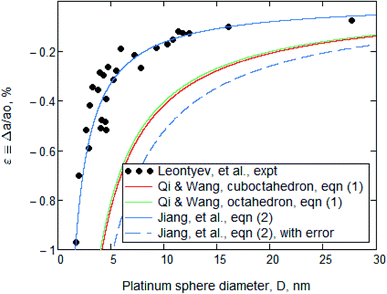
| Fig. 2 Normalized plot of platinum lattice parameter versus particle diameter. The data points are the same as in Fig. 1. The red and green lines are obtained using eqn (1) with a correct value for G: i.e., 61.9 GPa. That recalculation served to lower their position with respect to the data points. The solid blue line is from eqn (2) with parameters that are tabulated in ref. 3 and it is a good representation of the experimental points. The dashed blue line represents Leontyev's version of eqn (2), but with a 10× too large value for atomic diameter h, and it was presented by them as evidence that eqn (2) was unsatisfactory. | ||
Unfortunately, in the interpretation of these experimental data, they employed two incorrect physical properties of platinum in their models. Therefore, their conclusions will be shown to be invalid.
Identification of the two errors
Both errors probably resulted from look-up failures from data compilations.An analysis involving eqn (1) below requires a value for the shear modulus (aka, the modulus of rigidity) G. They used G = 168 GPa, but it is actually ≈ 62 GPa. Table 1 shows five sources for this assertion, as well as values for Young's modulus. The latter are included only to suggest that Leontyev, et al. probably took Young's modulus from a compilation, but misattributed that value to be for G.
| Used by Leontyev, et al.a | Compilation 1b | Compilation 2c | Merker, et al.d | Farraro and McLellane | Darlingf | Compilation 3g | |
|---|---|---|---|---|---|---|---|
| a I. N. Leontyev, A. B. Kuriganova, N. G. Leontyev, A. Rakhmatullin, N. V. Smirnova and V. Dmitriev, RSC Adv., 2014, 4, 35959–35965.b https://www.webelements.com/platinum/physics.html, accessed July 2021.c https://environmentalchemistry.com/yogi/periodic/Pt.html#Physical, accessed July 2021.d J. Merker, D. Lupton, M. Topfer and H. Knake, Platin. Met. Rev., 2001, 45, 74–82.e R. Farraro and R. B. McLellan, Metall. Trans. A, 1977, 8, 1563–1565.f A. S. Darling, Platin. Met. Rev., 1966, 10, 14–19.g H. W. King, in Physical Metallurgy, ed. R. W. Cahn, North-Holland, Amsterdam, 1970, p. 60. | |||||||
| Shear modulus, G (GPa) | 168 | 61 | 60.9 | 54.2 | 62 | 62.2 | |
| Young's modulus (GPa) | 168 | 170 | 164.6 | 159 | 174 | ||
| Atomic diameter, h (nm) | 2.78 | 0.272 | 0.26 | 0.2774 | 0.2775 | ||
Another analysis, see eqn (2) below, requires a value for the atomic diameter h. Table 1 shows that they used a value that is 10× too large. That error might have been caused by a mix-up between nm and Å units.
The effect of the shear modulus error
Fig. 1 contains the experimental data points and Leontyev's best fit to them. Those points were taken from Leontyev's Fig. 2, which is a plot of a(D). Our Fig. 1 is a normalized version, i.e., of ε(D), where ε ≡ Δa/a0, Δa ≡ (a − a0) and a → a0 when D → ∞.They reported that the best fit to their experimental data was a “continuous-medium” approach of Qi and Wang,2 who had derived the equation [Leontyev's eqn (4)]
 | (1) |
However, as seen in Table 1, Leontyev's value of G = 168 GPa is wrong. We recalculated the red and green lines obtained from eqn (1) but using G = 61.9 GPa instead. As shown in Fig. 2, the red and green lines now differ substantially from the data.
The effect of the atomic diameter error
Also shown in Fig. 2 is a solid blue line that does agree with data points. It was generated from eqn (2) [Leontyev's eqn (6)], which was derived by Jiang, et al.3 This is
 | (2) |
In contrast, Leontyev, et al. also reported that the results from eqn (2) did not fit the data: they generated, instead, the dashed blue line. But their dashed blue line was calculated with the erroneous 10× larger value for h. Accordingly, their value for |ε| is √10 greater.
They do not specify what value they used for D0. If, as reported by Jiang,3 who derived eqn (2), it is 3h, there should have been a further factor of √10.
Summary of the error effects
Subsequent quotation marks will indicate quotes from Leontyev, et al. Their Conclusion section states that “The comparison of the calculated dependencies based on the above models with the experimental data, shows that the results provided by the Continuous-Medium model is in better agreement than those obtained by others approaches. It is thus the best approach to simulate the unit cell parameter dependence.” The data and fits shown in Fig. 2 show that this is not correct. Eqn (2) yields a far better fit than eqn (1) when proper parameters are used, which is just the reverse of Leontyev's statement.The significance of the error
Eqn (2) was “based on the notion that the nanoparticles are compressed by the Laplace pressure. The value for the pressure difference of a spherical surface was formulated in 1805 independently by Thomas Young and Pierre Simon de Laplace.” That is correct. But their statement that “Laplace pressure can be confronted with various problems” and their quoted4 viewpoint that “the Laplace pressure is a purely mathematical concept and cannot cause compression of bodies” are no longer supported by our revised analysis.After correcting for the apparent look-up failures, there is no basis in the data fits to suggest that the Laplace pressure concept is wrong. Instead, the excellent fit of Leontyev's data to the Laplace based eqn (2) suggests, although it does not prove, the contrary.
Conflicts of interest
There are no conflicts to declare.Acknowledgements
The author is Professor Emeritus at Wayne State University. He thanks the University, its College of Engineering, and its Department of Chemical Engineering and Materials Sciences, for access to its facilities. He is also grateful for scholarly interactions with some of its faculty members.References
- I. N. Leontyev, A. B. Kuriganova, N. G. Leontyev, A. Rakhmatullin, N. V. Smirnova and V. Dmitriev, RSC Adv., 2014, 4, 35959–35965 RSC.
- W. H. Qi and M. P. Wang, J. Nanopart. Res., 2005, 7, 51–57 CrossRef CAS.
- Q. Jiang, L. H. Liang and D. S. Zhao, J. Phys. Chem. B, 2001, 105, 6275–6277 CrossRef CAS.
- E. L. Nagaev, Phys.–Usp., 1992, 35, 747–782 CrossRef.
| This journal is © The Royal Society of Chemistry 2022 |
