
 Open Access Article
 This Open Access Article is licensed under a
 Creative Commons Attribution 3.0 Unported Licence
Equation learning to identify nano-engineered particle–cell interactions: an interpretable machine learning approach†
Stuart T.
Johnston
 *a and
Matthew
Faria
b
*a and
Matthew
Faria
b
aSchool of Mathematics and Statistics, The University of Melbourne, Victoria, Australia. E-mail: stuart.johnston@unimelb.edu.au
bDepartment of Biomedical Engineering, The University of Melbourne, Victoria, Australia
First published on 26th October 2022
Abstract
Designing nano-engineered particles capable of the delivery of therapeutic and diagnostic agents to a specific target remains a significant challenge. Understanding how interactions between particles and cells are impacted by the physicochemical properties of the particle will help inform rational design choices. Mathematical and computational techniques allow for details regarding particle–cell interactions to be isolated from the interwoven set of biological, chemical, and physical phenomena involved in the particle delivery process. Here we present a machine learning framework capable of elucidating particle–cell interactions from experimental data. This framework employs a data-driven modelling approach, augmented by established biological knowledge. Crucially, the model of particle–cell interactions learned by the framework can be interpreted and analysed, in contrast to the ‘black box’ models inherent to other machine learning approaches. We apply the framework to association data for thirty different particle–cell pairs. This library of data contains both adherent and suspension cell lines, as well as a diverse collection of particles. We consider hyperbranched polymer and poly(methacrylic acid) particles, from 6 nm to 1032 nm in diameter, with small molecule, monoclonal antibody, and peptide surface functionalisations. Despite the diverse nature of the experiments, the learned models of particle–cell interactions for each particle–cell pair are remarkably consistent: out of 2048 potential models, only four unique models are learned. The models reveal that nonlinear saturation effects are a key feature governing particle–cell interactions. Further, the framework provides robust estimates of particle performance, which facilitates quantitative evaluation of particle design choices.
1. Introduction
Nano-engineered particles are an emerging technology that promise to facilitate the targeted delivery of therapeutic and diagnostic agents. Despite recent high-profile successes where nano-engineered particles are employed as delivery vehicles in novel vaccines,1,2 it remains a challenge to rationally design particles for specific applications. A complex sequence of chemical, biological, and physical processes occurs between the synthesis and cellular internalisation of a particle.3 The complexity of this sequence obscures how the original particle characteristics, such as size, shape and surface charge, dictate interactions with cells.3,4 An understanding of each step in the delivery pathway, from synthesis to internalisation, will be required to determine rational design principles for nano-engineered particles.5Mathematical and computational approaches play a crucial role in elucidating the impact of chemical, biological, and physical processes on particle–cell interactions.6–11 Models that represent particle internalisation as a multistage reaction process have been used to examine the relative number of particles that are bound to the cell surface or internalised by the cells.9,12–15 Such models suggest that particle saturation at the internalisation stage can significantly vary between cell lines, even if the different cell lines bind to particles at the same rate.9 Extensions of these models have been presented, which allow for more complex behaviour to be probed and explored, such as particle internalisation in tumour spheroids16 or particle biodistribution.17 Mathematical models have been particularly successful when employed to untangle the roles of particle transport and particle–cell interactions.18–20 Models allow robust metrics of particle performance to be calculated and compared, independent of the experimental set-up.20,21 These models have provided insight into how particle–cell interactions are impacted by cell heterogeneity,22–24 and particle polydispersity,25,26 agglomeration,27 and dissolution.28 Further details of the mathematical and computational models employed to understand nanoparticle–cell interactions can be found in the reviews (and references therein) by, for example, Åberg,6 Cohen et al.,18 Donahue et al.,7 Johnston et al.8 and Li et al.17
Mathematical and computational models can be considered as three distinct groups: first-principle models, phenomenological models and data-driven models. In first-principle models, the relevant behaviour is understood at a fundamental level. This is rarely the case for models in bionanotechnology, outside of molecular dynamics models, where the system evolves according to Newton's laws of motion.29 In phenomenological models, knowledge is encoded in the model via specific functional terms. For example, cells may have a saturating ability to internalise particles.9,19,20 The specific functional form of this phenomenon requires an assumption, which can be verified by comparing the proposed model against experimental data. However, this does not preclude the possibility that other functional forms may explain the experimental data. Existing models of particle–cell interactions are predominantly phenomenological in nature.6,8 In data-driven models, the model arises purely from the experimental data.30–33 For example, random forest models have been used to predict biomolecular corona formation based on the physicochemical properties of a particle.34 Here the issue of incorrect assumptions can be ameliorated, as functional forms do not have to be explicitly incorporated.
Machine learning is a well-known example of data-driven modelling,35 and its usage has become increasingly widespread in a range of fields, from image recognition36 to drug discovery.37–39 In bionanotechnology, machine learning has been harnessed to predict biomolecular corona formation,34,40 identify relevant features of gold particles,41 and predict particle toxicity.42 A common criticism levelled at such approaches is that the resulting model is a ‘black box’ that cannot be interpreted.43–45 That is, while the model may describe the data, any insight into the underlying process is limited.44 Further, if certain aspects of the underlying process are well-understood a priori, data-driven models may not benefit from this knowledge. Recently, interpretable machine learning techniques that reveal the dynamics that underlie data, known as equation learning, have been proposed.30,31,33 Equation learning has revealed behaviour for a range of systems, including fluid dynamics,30,31,46 collective cell migration,47–49 and enzyme kinetics.50 It remains an open question whether a data-driven modelling approach, such as equation learning, augmented by established biological knowledge, can reveal hitherto unknown interactions between particles and cells.
Here we present an equation learning framework (Fig. 1) to understand particle–cell interactions in association experiments. In these experiments, the number of particles associated to cells is measured. We address the dual issues of the small number of time points and the considerable noise in the data via a constrained neural network.47,48,51 Crucially, the constraints allow for established knowledge to be encoded in the neural network, which ensures that the network output exhibits biologically-plausible behaviour. Equation learning techniques are then applied to learn the model that describes the particle–cell interactions. The equation learning framework does not rely on mechanistic assumptions to obtain the learned model. We establish the validity of our framework by ensuring that it can correctly learn models from synthetic (i.e. model generated) data. We apply the equation learning framework to a library of experimental data for 30 particle–cell pairs. This library includes hyperbranched polymer52 and poly(methacrylic acid) particles20 that range from 6 nm to 1032 nm in diameter, with small molecule, peptide, and monoclonal antibody surface functionalisations, and includes both adherent and suspension cell lines. We demonstrate that despite the broad span of experiments, the learned models are remarkably consistent. The equation learning framework reveals that saturation effects are critical and ubiquitous in particle–cell interactions. Further, the form of the saturation effects are distinct to those proposed previously, suggesting that hitherto overlooked mechanisms may play a key role in the interaction dynamics. Finally, we highlight that the equation learning framework provides quantitative estimates of particle performance, and hence allows for the impact of nano-engineered particle design choices to be analysed.
 | ||
| Fig. 1 The equation learning framework. A combination of experimental data, biological knowledge and a neural network are employed to approximate the rate of particle–cell association. An interpretable model of particle–cell association is then learned from a set of candidate model components via sparse regression. | ||
2. Methods
2.1. Experimental details
Full experimental details can be found in previous literature for the hyperbranched polymer particles52 and for the poly(methacrylic acid) particles.20 Briefly, particles were synthesised to include fluorescent tags. Particle and cell fluorescence were characterised independently of each other as controls. This allows for the number of associated particles per cell to be estimated.21 Time-course data on particle–cell association was obtained by immersing the cell population in culture media containing a particle suspension. Experiments were performed at high confluence (>80% surface coverage for adherent cells52 and 105–106 cells per ml for suspension cells20,53). The duration of each association experiment was well below the average doubling time for the relevant cell line.54,55 As such, cell division is expected to be minimal. Particle–cell mixtures were then analysed with flow cytometry at specified time points, which provided a measurement of fluorescence for each measured cell in the sample (∼30![[thin space (1/6-em)]](https://www.rsc.org/images/entities/char_2009.gif) 000 cells across at least three experiments for the hyperbranced polymer particles and ∼20000 cells across at least two experiments for the poly(methacrylic acid) particles). Particle fluorescence was normalised by removal of the fluorescence corresponding to the cell population, as identified through the cell-only control experiment.
000 cells across at least three experiments for the hyperbranced polymer particles and ∼20000 cells across at least two experiments for the poly(methacrylic acid) particles). Particle fluorescence was normalised by removal of the fluorescence corresponding to the cell population, as identified through the cell-only control experiment.
2.2. Modelling details
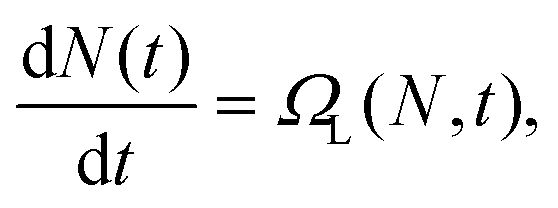
The goal of equation learning is to infer an interpretable model, in this case a dynamical systems model, from a dataset.30,31 A schematic of the equation learning pipeline is presented in Fig. 2. In standard in vitro particle–cell association experiments, the number of particles that have associated to individual cells is measured.20 If these measurements are taken throughout a time-course experiment, we have a significant number of observations of associated particles per cell at certain time points. Specifically, at each time point, we have observations for thousands of individual cells. We denote the number of particles associated to the ith observed cell, Ni. Each observation is paired with a time point ti, which denotes the time at which the ith observation is captured. Using equation learning, we aim to determine the modelwhere N(t) is the average number of particles associated to a cell at time t obtained from the data and ΩL(N,t) is the learned function that describes the association dynamics. The form of this function is what indicates how particles and cells interact. Recall that this is a data-driven model and hence it does not involve or rely on precise mechanistic assumptions about the underlying biology. Instead, the model provides an abstract description of the particle–cell association dynamics at the level of the available data, and hence does not provide information about the specific biological processes that underlie particle–cell association. It is important to note that the learned model ΩL(N,t) only depends on quantities that have been experimentally measured: the number of associated particles for a cell and the time. It is entirely plausible that other factors impact particle association, such as particle transport through the culture media.18,20,22 However, without experimental measurements of these factors we cannot directly include them in the equation learning process, and instead they will manifest in the model parameters. We are, therefore, making an implicit assumption that our datasets are not affected by other factors that change over the course of the experiment. One important assumption made here is that the experiments are performed for a near-confluent cell population so that there is not significant cell division during the course of the experiment. When a cell divides, the particles are split between the parent and daughter cell.56 If there is non-negligible cell division in the experiment, the average number of associated particles per cell will be affected.6,14,56 This behaviour could be explicitly captured in the equation learning framework by measuring the size of the cell population over time; however, this is not a routine measurement for particle–cell association experiments. Nonetheless, it is important to be aware that this assumption is present in this work. For synthetically-generated data, we can simply exclude potentially-confounding factors in the data synthesis process. For experimentally-generated data, we can perform experiments where the impact of such factors are minimised. This requires an experimental design with small and/or light particles, such that transport is diffusion-dominated, and dosage where only a small fraction of the particles associate over the course of the experiment, such that the number of particles that are available to interact with the cells is approximately constant. The latter condition is typically satisfied in particle–cell association experiments, and it only requires a relatively minor change to the experimental protocol to satisfy the condition, if it is not initially satisfied. Alternatively, if these factors cannot be avoided, the equation learning framework can be modified to accommodate such factors, as we demonstrate in the ESI (Section 4, SI Fig. 5†).
 | ||
| Fig. 2 The equation learning pipeline. (a) The number of associated particles in an experiment is measured at a number of time points. (b) A biologically-informed neural network is trained on the data to remove noise while maintaining biologically-plausible output. (c) The derivative of the neural network, i.e. the rate of particle–cell association, is calculated. (d) Candidate model components are constructed from the neural network output. (e) Sparse regression is used to identify a parsimonious model that describes the rate of particle–cell association, constructed of a subset of the candidate model components. | ||
2.3. Biologically-informed neural networks
The first step in the equation learning process is to obtain the average time rate of change of the number of associated particles, dN(t)/dt, otherwise referred to as the rate of particle–cell association (Fig. 2). A naïve approach is to calculate this derivative directly from the data using standard finite difference methods. However, due to the noise inherent to biological data, this calculation can be highly inaccurate, as finite difference methods increase the level of noise in data.57 We therefore consider the approach proposed by Lagergren et al.,47 in which a neural network is first used to reduce the noise in the data. That is, using the paired data (ti,Ni) from our experiment, we train a neural network that predicts Np(t) for 0 ≤ t ≤ tend where tend is the final time point in the experiment and the subscript p denotes that this is a prediction arising from the neural network. The neural network is referred to as “biologically-informed” as it involves constraints that arise from established biological knowledge. The learned neural network can be thought of as the curve that minimises the distance between itself and the individual data points, while satisfying any imposed constraints. Hence while it is unlikely that the learned neural network will provide an exact prediction of the number of associated particles of any individual cell over time, it will provide a reasonable estimate of the average number of associated particles per cell over time.The advantages of using a neural network here are twofold. First, we can obtain a smooth function from noisy experimental data, which allows for the calculation of the time rate of change of the number of associated particles (i.e. the rate of particle–cell association) without the introduction of additional noise. Second, we can encode biological knowledge in the structure of the neural network, referred to as a biologically-informed neural network, to ensure that the predictions are biologically plausible.47 In this work we encode three restrictions on the neural network output, guided by established biological knowledge:
• The first restriction is that the number of particles is non-negative, as it impossible for a negative number of particles to be associated to a cell. This restriction requires that the output of the neural network is non-negative (i.e. Np(t) ≥ 0);
• The second restriction is that the rate of particle–cell association is non-negative, as the number of associated particles should, on average, not decrease over time due to additional particles interacting with the cell. This restriction requires that the first derivative is non-negative (i.e. dNp(t)/dt ≥ 0); and,
• The final restriction is that the rate of particle–cell association can represent saturation effects. As particles associate to the cell, certain cellular processes may become saturated (e.g. receptors on the cell surface or subcellular compartment space). As such, the rate of particle–cell association should not increase with the number of associated particles. This effect is widespread across many particle–cell combinations.9,20 This restriction requires that the second derivative is non-positive (i.e. d2Np(t)/dt2 ≤ 0). We note that a second derivative of zero is a possible outcome. This reflects the case where saturation effects do not play a role, and hence we are not enforcing saturation effects in our framework. It is possible that a decrease in the rate of particle–cell association could be explained by cell division.6 This is most relevant for experiments that are conducted on a cell population that is initially far from full confluence, and where the experiment is performed over a timescale similar to (or longer than) the cell doubling time. If this is the case, the number of cells in the population at each time point should be measured to determine the effect of cell division on nanoparticle association. It is also possible that saturation effects arise due to a balance between particle association and particle recycling. This possibility is captured under these constraints.
Previous work by Dugas et al.58 describes how to incorporate knowledge in a neural network such that the output, first derivative, and second derivative are all non-negative. It is relatively straightforward to transform our experimental data such that our desired restrictions on the neural network correspond to the restrictions of Dugas et al.58 To satisfy these restrictions, the biologically-informed neural network must incorporate a hidden layer with a softplus activation function
| ψ(s) = ln(1 + exp(s)), |
We implement a neural network with a single hidden layer of 128 nodes using Python's tensorflow package.59 We allocate 60% of the particle–cell association data as training data, 30% of the data as validation data, and 10% of the data as testing data. That is, we fit the neural network to the training data, and use the validation dataset to identify the weights and biases that produce the neural network that minimises the error between the output and the validation data. This reduces the risk of overfitting the neural network model to the training data. We then confirm that the neural network is performing well by comparing the output with the test dataset. After training, we have a biologically-informed neural network that provides predictions of the number of associated particles Np(t) for 0 ≤ t ≤ tend.
2.4. Equation learning
The derivative of the number of associated particles, as predicted by the neural network, dNp(t)/dt, can be obtained via automatic differentiation.59 As detailed above, we aim to learn the dynamics ΩL(Np, t) that describe the evolution of the number of associated particles over time. Equation learning can be employed to infer parsimonious dynamical systems models from data, that is, models that contain a small number of terms and hence strike the vital balance between model simplicity and descriptive ability.30 Specifically, in our equation learning approach we propose a set of m candidate model components Ω = ω1(Np,t), …, ωm(Np,t). As such, we make the assumption that the dynamics can be described via a linear combination of candidate model components. Note that these components are constructed directly from the data (in this case, the biologically-informed neural network output, Np(t)). We employ sparse regression to determine the subset of these model components that provides dynamics that match the experimental data, while penalising the inclusion of many model components. Without this penalty, complicated models that fit the data well but are less likely to be biologically plausible will be selected. A standard approach is to include polynomial model components, i.e. Ω = {1, Np(t), Np(t)2, …, Np(t)m−1}. We make this standard choice and select m = 11. However, in principle, any function of Np and t could be included as a model component. We defineas the matrix of model components defined at each time point tj for j ∈ [1, n]. Note, again, that we only include model components that are constructed from experimental data. If, say, the level of receptor expression r(t) is also measured, we could construct model components that depend on both Np(t) and r(t). However, in practice, it is not common to report this information, so we restrict ourselves to particle–cell association data. We implement the least absolute shrinkage and selection operator (LASSO) to identify the sparse solution that best matches our data.60 The LASSO imposes a L1 regularisation, which penalises non-zero terms and promotes sparsity in the model components. Specifically, we seek to find

![[d with combining circumflex]](https://www.rsc.org/images/entities/b_char_0064_0302.gif) such that
such thatwhere

 is the vector of the rate of particle–cell association values at each time point tj, d = {d0, d1, …, dm} is a vector where the ith entry corresponds to the contribution of the ith model component, and λ is the LASSO regularisation parameter.60 The regularisation parameter encourages sparsity in , that is, it causes only a subset of the di values to be non-zero. The value of λ is selected via cross-validation. The LASSO is implemented using Python's scikit-learn package.61 Following the identification of the sparse solution, a pruning process with tolerance ε = 0.25 is implemented.49 That is, we sequentially set each non-zero di in to zero and calculate LSi, which is the least-squares solution with the remaining non-zero model components of and di = 0. If the error between the data and the reduced learned model with LSi, denoted Ei, satisfies Ei < (1 + ε)E then we retain di = 0, where E is the error between the original learned model and the data. This approach ensures that each non-zero di meaningfully contributes to a reduction in error between the learned model and the data, and further promotes sparsity. The model components that have corresponding non-zero di values are, therefore, the relevant components that describe the dynamics of particle association. These components capture the form of the saturation effects from the data, but do not identify the specific biological mechanisms that result in the model components.
3. Results and discussion
We consider data arising from standard time-course in vitro particle–cell association experiments conducted previously.20,52 In association experiments, a cell population is seeded in a culture dish and allowed to grow. Here we consider both adherent and suspension cell lines. At the start of the experiment, the culture media is replaced with media containing a particle suspension. Over time, the particles undergo transport through the fluid and interact with the cells. The number of particles associated to each cell is measured at specific time points using flow cytometry. The term ‘associated particles’ refers to particles that are either internalised by the cell, or are sufficiently strongly bound to the cell membrane such that they are not dislodged via cell washing. We note that the number of associated particles is a commonly-reported metric due to the difficulty of distinguishing between surface-bound and internalised particles.6,21,62,63 For example, one approach employed to distinguish between membrane-bound and internalised particles involves cooling the cells to 4 °C to inhibit endocytosis, such that particles bind to the cell surface but are not internalised.9,62 After a time, the cells are returned to 37 °C, where endocytic processes resume.9,62 However, this approach is not always appropriate due to the variation in time taken for different endocytosis pathways to return to standard levels of activity, which implies that kinetic analyses may provide biased results.62 Due to potential discrepancies in analysis that arise from the choice of experimental approach used to distinguish between membrane-bound and internalised particles, and the fact that reporting particle association is common practice, here we primarily focus on identifying models of particle–cell association. We demonstrate that the equation learning framework is valid in the case where membrane-bound and internalised particles can be distinguished (ESI, Section 4†).3.1. Synthetically-generated data
We first ensured that the equation learning framework is capable of identifying the correct model from particle–cell association data in an idealised case, where the data is synthetically generated (i.e. generated in silico) from a known model of particle–cell association. That is, we generated noisy observations according to a specified model, and then attempted to learn that model from these observations. This allowed for the identification of the conditions under which the framework can learn the correct model, and provided confidence in predictions obtained from the application of the equation learning framework to experimental data, where the model of particle–cell association is unknown.We generated synthetic particle–cell association data using a single-stage association model, which is capable of describing particle–cell association kinetics for a diverse range of particle–cell combinations.20 This model can be expressed dN/dt = Ωs(N,t) = d0 − d1N, where Ωs(N,t) is the rate of particle–cell association, the subscript s denotes that the model generates synthetic data, t is the time, N is the number of associated particles, and d0 and d1 are constants that indicate the relative strength of the 0th and 1st order terms, respectively. Note that N(t) is time-dependent, but we neglect this notation for convenience. This model represents linear saturation of particle association, as the rate of particle–cell association decreases linearly with the number of associated particles.9,12,13,20 The particle properties were chosen such that particle transport was dominated by diffusion, and that only a small fraction of the initial dose of particles associated over the experimental timeframe, thereby avoiding the confounding effects of sedimentation20 and dose depletion.64 We first generated a ‘best-case’ dataset where the number of associated particles per cell was recorded each hour for a total of 24 hours and there was minimal noise in the data. This dataset was the ‘best case’ in that it is uncommon for the number of associated particles to be measured so often due to the experimental effort required, and noise in flow cytometry datasets is rarely minimal. This approach allowed us to establish whether the equation learning framework performed in idealised scenarios. If the framework did not provide accurate predictions for such fine time-resolution and low noise data, we would not expect the framework to provide meaningful results when applied to real experimental data.
We present the output from the application of the equation learning framework to the ‘best-case’ synthetic dataset in Fig. 3(a) and (d). The learned model, presented in Fig. 3(a), matched the test data well. Crucially, the learned model, ΩL(N,t) = d0 − d1N, was consistent with the model used to generate the synthetic data. The subscript L denotes that this is a learned model. The consistency between the models demonstrates that, under ideal conditions, the equation learning framework can recover the correct model. The framework performed as expected in each of the relevant steps: the learned rate of particle–cell association was consistent with the corresponding neural network prediction (Fig. 3(d)); the neural network prediction was consistent with the test dataset (ESI, SI Fig. 1†), and; the neural network converged to both the training and validation datasets (ESI, SI Fig. 1†). While both the neural network prediction and the equation learning prediction matched the data well, the benefit of the additional equation learning step is that we obtained an model that can be interpreted.
 | ||
| Fig. 3 Equation learning framework applied to synthetic data with Ωs(N,t) = d0 − d1N. (a)–(c) Comparison between the equation learning prediction of the number of associated particles per cell (cyan) and the test dataset (black). (d)–(f) Comparison between the equation learning prediction (cyan, dashed) and the neural network prediction (orange, solid) of the rate of particle–cell association. The dataset contains 2500 observations at each of (a), (b), (d) and (e) 25 and (c) and (f) 7 time points with Gaussian noise with a mean of zero and a standard deviation of (a) and (d) 10−4, (b), (c), (e) and (f) 0.5. | ||
A natural question arises as to whether the equation learning framework can recover the correct model when more realistic numbers of observations and levels of noise are present in the dataset. We first relaxed the restriction that the data set does not contain significant noise, and imposed Gaussian noise with a mean of zero and a standard deviation of 0.5, and present the output of the equation learning framework in Fig. 3(b) and (e). We observe that the learned model again accurately described the number of associated particles per cell in the dataset, even in the presence of additional noise. The neural network prediction of the rate of particle–cell association deviated slightly from the expected straight line due to this noise (Fig. 3(e)). However, the equation learning framework favours parsimonious models, that is, models that accurately explain the data with as few model components as possible. As such, the learned model was still of the correct form ΩL(N,t) = d0 − d1N. We next reduced the number of observations to be consistent with previous experimental investigations, where observations are captured every four hours, while maintaining the increased level of noise, and present the results in Fig. 3(c) and (f). Despite the decrease in observations and the increase in noise, the learned model was of the correct form and described the test data well. These results indicate that the equation learning framework is suitable for recovering the correct model for numbers of observations and levels of noise that are consistent with standard experimental investigations. Further output from the equation learning framework for these datasets can be found in the ESI (Section 1).†
It is prudent to examine whether the equation learning framework can recover more complicated models of particle–cell interactions, as it is possible that the relevant model form may contain nonlinear terms or may have more than two components. It is not immediately obvious whether the framework will recover the correct model in such cases as, in general, distinguishing between sigmoidal curves is not always possible.65 In Fig. 4 we present the results obtained from applying the equation learning framework to a dataset generated with Ωs(N,t) = d0 − d1N − d2N2 (Fig. 4(a) and (b)) and Ωs(N,t) = d0 − d1N − d2N2 − d3N3 (Fig. 4(c) and (d)). Again, we observe that the learned models were consistent with the data. Additionally, the learned model was of the correct form, which demonstrates the framework is able to reliably learn more complex models. We note that the equation learning framework is capable of learning models of a two-stage particle internalisation process from synthetic data, where the particle first binds to the cell membrane and is subsequently internalised (ESI, Section 4†). However, as discussed above, obtaining this data is neither straightforward nor standard practice, so we restrict the focus of this work to particle–cell association data.
 | ||
| Fig. 4 Equation learning framework applied to synthetic data with (a) and (b) Ωs(N,t) = d0 − d1N − d2N2 and (c) and (d) Ωs(N,t) = d0 − d1N − d2N2 − d3N3. (a) and (c) Comparison between the equation learning prediction of the number of associated particles per cell (cyan) and the test dataset (black). (b) and (d) Comparison between the equation learning prediction (cyan, dashed) and the neural network prediction (orange, solid) of the rate of particle–cell association. The dataset contains 2500 observations at each of 7 time points with Gaussian noise with a mean of zero and a standard deviation of (a) and (b) 0.5 and (c) and (d) 3. | ||
3.2. Experimental data
As the equation learning framework performed well for synthetically-generated data with realistic observation numbers and noise, we next applied it to a suite of experimental data. We considered the signal corresponding to associated particles for a library of 24 particle–cell association datasets.52 We investigated PC3–PIP cells, which are PC3 cells that have been transfected to express prostate-specific membrane antigen (PSMA(+)), and PC3–Flu cells, which are PC3 cells that do not express prostate-specific membrane antigen (PSMA(−)). We considered hyperbranched polymer particles with a diameter of ∼6 nm with four different targeting functionalities: a negative control (i.e. a pristine particle); a small molecule (glutamate urea (GU)); a peptide ligand; and a monoclonal antibody (J591).52 Experiments were performed at three different particle concentrations; at a baseline concentration (1×), and at four (4×) and sixteen (16×) times the baseline concentration. This experimental design matrix resulted in 24 distinct datasets (2 cell lines × 4 targeting functionalities × 3 particle concentrations). Experimental measurements were collected from standard particle–cell association assays with adherent cell culture at 0, 30, 120 and 240 minutes after the application of the particles. Here the data is reported in terms of arbitrary fluorescence so the model output will similarly be in terms of arbitrary fluorescence.We applied the equation learning framework to each dataset in the library and present the results in Fig. 5. Here the framework included 11 potential model components, which are the 0th to 10th order polynomial terms. As each model component can either be included or excluded, the framework selected from 211 = 2048 potential models. A different number of model components could be included; however, we found that 11 components struck a balance between the descriptive ability of the span of potential models, and the computational effort required to determine the learned model. To account for the stochastic nature of the split of the dataset into training, validation, and test data, we repeated the equation learning process 100 times. That is, we randomly split the dataset into training, validation, and test data 100 times. For each split, we performed the equation learning process, and recorded the learned model. The most commonly learned model for each dataset across the 100 repeats is presented in Table 1. For each dataset, the learned model described the test data well. Strikingly, out of the 2048 potential models that could have arisen from the equation learning process, only four distinct models were selected:
Model 1
| Ω1(N) = d0 − d1N, |
Model 2
| Ω2(N) = d0 − d1N − d2N2, |
Model 3
| Ω3(N) = d0 − d1N − d2N2 − d3N3, |
Model 4
| Ω4(N) = d0 − d1N − d3N3. |
 | ||
| Fig. 5 Equation learning framework applied to experimental data of hyperbranched polymer particles and (a)–(l) PSMA(−) PC3 cells, and (m)–(x) PSMA(+) PC3 cells. Comparison between the equation learning prediction of the signal corresponding to associated particles (cyan) and the test dataset (mean value in orange) for (a)–(c) and (m)–(o) control, (d)–(f) and (p)–(r) peptide, (g)–(i) and (s)–(u) J591 and (j)–(l) and (v)–(x) glutamate urea surface functionalisations. Experiments are performed with a (a), (d), (g), (j), (m), (p), (s) and (v) baseline concentration, (b), (e), (h), (k), (n), (q), (t) and (w) 4× concentration and (c), (f), (i), (l), (o), (r), (u) and (x) 16× concentration of particles. Box plots represent the median, interquartile range, and the maximum/minimum of the test dataset. To account for outliers, the maximum is defined as the minimum of the upper quartile plus 1.5 times the interquartile range, and the maximum value in the dataset. | ||
| Concentration | PMSA(−) | PMSA(+) | ||||||
|---|---|---|---|---|---|---|---|---|
| Control | Peptide | J591 | GU | Control | Peptide | J591 | GU | |
| 1× | Model 2 | Model 3 | Model 2 | Model 2 | Model 3 | Model 3 | Model 4 | Model 2 |
| 4× | Model 2 | Model 2 | Model 2 | Model 3 | Model 2 | Model 2 | Model 2 | Model 3 |
| 16× | Model 3 | Model 3 | Model 1 | Model 3 | Model 3 | Model 1 | Model 2 | Model 3 |
The most common learned model for this library of datasets was Model 2 (11/24 datasets), followed by Model 3 (10/24 datasets) and Model 1 (2/24 datasets). The saturation behaviour of each of these models is consistent with previous investigations, where such effects are observed to be a key feature governing particle–cell interactions. Interestingly, these results suggest that saturation may not be a linear function of the number of associated particles as thought previously,9,20 as the learned model for 22/24 datasets suggests that higher order saturation effects are necessary to fully describe the experimental data. It is possible that this represents the combined effect of several biological processes. In Fig. 6, we present illustrative examples of the rate of particle–cell association, as a function of the number of associated particles per cell, for each of the four models. This highlights the difference in particle–cell interactions between the models; although the rate of particle–cell association decreases to zero in each model, this decrease can occur at a constant rate (Model 1), linearly (Model 2), or initially slowly, followed by a more precipitous decrease as the number of particles per cell approaches the carrying capacity (Model 3, Model 4).
 | ||
| Fig. 6 Illustrative examples of the rate of particle–cell association as a function of the number of associated particles per cell for Model 1 (grey), Model 2 (purple), Model 3 (orange), and Model 4 (cyan). We observe that saturation effects are critical, as the rate of particle–cell association decreases with the number of particles per cell in each learned model. | ||
We next considered a library of particle–cell association data for THP-1 cells, a suspension cell line, and particles ranging in diameter from 150 nm to 1032 nm.20 Specifically, we examined poly(methacrylic acid) capsule particles with diameters of 214 nm, 480 nm and 1032 nm, and poly(methacrylic acid) coreshell particles (i.e. with an intact template core) with diameters of 150 nm, 282 nm and 633 nm.20 It is instructive to examine whether the learned models are consistent between the two libraries, which have pronounced differences in cell type, particle size and particle composition. We repeated the application of the equation learning framework as detailed above, and present the results in Fig. 7. Again, the learned model described the experimental data accurately. As we observed for the previous library of particle–cell association data, the most common learned model for the THP-1 data was Model 2 (3/6 datasets), followed by Model 1 (2/6) and Model 3 (1/6), as summarised in Table 2. There is notable consistency in the learned models, despite both the broad span of experimental designs, and the wide range of potential models. These results reinforce the observation that saturation effects are critical, and that the form of this saturation behaviour does not appear to be linear.
| Template | Coreshell | Capsule | ||
|---|---|---|---|---|
| Diameter | Learned model | Diameter | Learned model | |
| 110 nm | 150 nm | Model 2 | 214 nm | Model 2 |
| 235 nm | 282 nm | Model 1 | 480 nm | Model 3 |
| 519 nm | 633 nm | Model 1 | 1032 nm | Model 2 |
 | ||
| Fig. 7 Equation learning framework applied to experimental data of (a), (c) and (e) coreshell and (b), (d) and (f) capsule poly(methacrylic acid) particles and THP-1 cells. Comparison between the equation learning prediction of the number of associated particles per cell (cyan) and the test dataset (mean value in orange) for particles with a diameter of (a) 150 nm, (b) 214 nm, (c) 282 nm, (d) 480 nm, (e) 633 m, and (f) 1032 nm. Box plots represent the median, interquartile range, and the maximum/minimum of the test dataset. To account for outliers, the maximum is defined as the minimum of the upper quartile plus 1.5 times the interquartile range, and the maximum value in the dataset. | ||
Finally, we examine whether the learned models are transferable, that is, whether the learned models can describe particle–cell association data outside of the training/validation/test datasets. To do this, we fit the most common learned model (Model 2) to six previously-published datasets,66–68 which were not used in the equation learning process. The results are presented in the ESI (Section 3, SI Fig. 4†). In all cases, Model 2 is able to accurately describe the particle–cell association data. This suggests that the learned models are transferable beyond the datasets used to train the models.
3.3. Quantifying particle performance
Aside from identifying the model that describes particle–cell interactions, the equation learning framework allows us to estimate key parameters that quantify particle targeting performance. The particle–cell affinity, which represents the strength of interaction between a particle and a cell, and the cell carrying capacity, which represents the maximum number of associated particles per cell, have been identified as critical features that dictate particle performance.20 The equation learning framework provides estimates of these parameters. It is important to note that these parameters represent a certain level of abstraction. The model is necessarily a simplified description of the many complicated processes involved in particle binding and internalisation. Accordingly, the parameters in the model do not have a precise biological definition; they are instead an abstract, bundled representation of the myriad processes in particle binding and internalisation. However, such parameters are still insightful when employed to compare particle performance. Additionally, the framework provides an estimate of the relative contribution of each component to the saturation behaviour. This simply requires recasting the learned model intowhere α is particle–cell affinity (m s−1),20C0 is the initial particle concentration (m−3), SA is the surface area of the relevant cell type (m2), K is the cell carrying capacity and δi is the relevant contribution of the ith component, subject to

 . The nonzero δi values correspond to the nonzero di values. The cell carrying capacity may also represent the point at which particle–cell association and either particle recycling (exocytosis) or degradation are balanced. However, without additional types of experimental data, we cannot identify the biological mechanism. We present tables with all parameters for each learned model in the ESI (SI Tables 1 and 2†). The parameters C0 and SA are determined experimentally, while the remainder of the parameters are obtained via the equation learning framework. We note that our estimates of the α and K parameters for the particles in the THP-1 data library are consistent with previous estimates,20 and that these parameters have not been estimated previously for the hyperbranched polymer particles. The restrictions on δi enforce that association is no longer possible when the number of associated particles is equal to the carrying capacity. While the nonzero δi provide the functional form of the relevant saturation effects, and their relative contributions, these parameters do not provide information about the specific biological mechanisms that give rise to saturation in particle association. Nonlinear saturation effects may represent a single phenomenon with nonlinear behaviour, or the convolution of two (or more) phenomena governed by linear behaviour; we do not speculate about the specific biological phenomena here. Identification of such mechanisms will likely require measurement of different biological processes, such as receptor expression and recycling kinetics, or endosomal trafficking kinetics. However, the detail revealed by the equation learning framework provides motivation to investigate the biological phenomena that potentially dictate particle association, and provides guidance into the functional form of the corresponding kinetics.
The parameters we identify are directly relevant to particle optimisation, as we are able to quantify changes in particle performance parameters due to design changes. For example, the particle–cell affinity increases with the addition of either a PSMA targeting peptide (5.90× increase, relative to control) or monoclonal antibody (5.19× increase) for the PSMA positive PC3–PIP cells at the 4× concentration condition (ESI, SI Table 1†). Note that optimisation is with respect to the type of data provided; here we use association data so optimisation refers to maximisation of the number of associated particles per cell. If internalisation data is available, we could optimise particle performance with respect to the number of internalised particles per cell. While quantitative analysis of particle performance is not the primary focus of this work, it is important to note that the equation learning framework provides robust estimates of particle performance, in addition to an interpretable model of particle–cell interactions.
4. Conclusions
Understanding the individual biological, chemical, and physical processes that form the journey from particle synthesis to cellular internalisation will inform the rational design of particles.5 It remains unclear how physicochemical particle properties, such as size, shape or surface charge, should be chosen to achieve optimal particle functionality for a particular application.5 Mathematical modelling approaches have been successful in unpacking certain aspects of the particle delivery process;8 however, many aspects remain to be explored. Here we present a mathematical framework that allows us to examine the interactions between particles and cells. This framework represents a balance between data-driven and phenomenological modelling approaches, allowing us to incorporate biological knowledge without imposing strict restrictions on putative model forms. Crucially, unlike many other machine learning approaches,43–45 the output of the framework is interpretable, and hence the results can be analysed and discussed in the context of established biological knowledge.We demonstrate that our equation learning framework, which includes particle–cell association data, biologically-informed neural networks, and sparse regression, is capable of recovering models of particle–cell interactions from synthetically-generated data. We apply the equation learning framework to a library of association experiment data for 30 particle–cell pairs. This library includes particles that range in size from 6 nm to 1032 nm that are synthesised from different materials, including polymers and poly(methacrylic acid), and have either small molecule, peptide, or monoclonal antibody surface functionalisations. Both adherent and suspension cell lines are considered. The equation learning framework displays remarkable consistency in the learned models of particle–cell interactions. Out of the 2048 potential models that could be identified by the framework, only four distinct models are reported across the entire library of experimental datasets. In fact, for 25/30 datasets, only two models are identified. The form of the learned models reinforce previous observations that saturation effects, where the rate of particle–cell association decreases as particles associate, are critical.20 However, our results suggest that the decrease in association occurs in a nonlinear manner, unlike previous investigations that suggest that this decrease is linear.20 By analysing how the individual components of the learned model contribute to particle association, our framework reveals that the rate of decrease of the rate of particle–cell association occurs most rapidly toward the carrying capacity of the cell. Further, the framework provides quantitative estimates of key parameters that dictate particle association, allowing for robust comparison between the performance of particles with different design choices. For example, the addition of a PSMA targeting peptide or monoclonal antibody to a hyperbranched particle provides a five-fold increase in the affinity between the particle and a PSMA positive PC-3 PIP cell, compared to a pristine particle. This highlights the utility of the equation learning framework, as it both identifies key model features and provides quantitative estimates of the relevant parameters, which allows for meaningful assessment of particle design choices.
While the equation learning framework is able to identify the relevant model form governing particle–cell association, it is not necessarily able to identify the underlying biological mechanisms. The framework does not distinguish between a single biological mechanism that impacts particle–cell association in a nonlinear fashion, or the product of several biological mechanisms that each linearly impact particle–cell association. However, this is a limitation associated with the data, rather than the framework itself. If data is collected about, for example, receptor levels or endosomal kinetics, the framework could be readily modified to include model components that depend on this new data. Once these new model components are included, the equation learning process can be repeated to determine how particle–cell association depends on the newly-measured biological behaviour. It is instructive to investigate the relationship between specific biological phenomena, such as receptor expression and recycling, and particle–cell association. However, as it is standard experimental practice to perform particle–cell association assays, and to report the level of particle–cell association, here we restrict ourselves to the information that can be determined from this prototypical experimental data. It is important, however, to note that the reported parameters do not have a precise biological definition as they reflect the complex and multistage process of particle binding and internalisation in a necessarily abstract fashion. However, this does not preclude these parameters from providing useful information about the performance of a particle–cell pair.
The equation learning framework requires that a number of assumptions are satisfied. These include that sedimentation effects are unimportant, that the number of particles in the culture media does not deplete during the experiment, and that the experiment is performed with a cell population that is close to full confluence. In general, these assumptions can be satisfied by making appropriate experimental design choices. Sedimentation effects can be rendered unimportant by either using small and/or light particles, or by constantly mixing the culture media.69 Particle depletion can be avoided by commencing the experiment with a sufficiently high particle dose, with careful consideration of the particle density to avoid immediate saturation of the cells. Confuence of the cell population will occur if sufficient time is left between seeding the cells and introducing the particle suspension. However, these choices may not be suitable for all experiments. To extend the applicability of the framework, it would therefore be useful to develop a modified equation learning framework capable of incorporating time-varying cell population sizes and/or particle dosimetry (i.e. the dosage available to the cells at any given time) as a model component. It is straightforward to incorporate information about the number of cells in the population at any given time, provided this information is measured experimentally. Calculating particle dosimetry requires the numerical solution of a partial differential equation (PDE), such as the ISD3 model.28 However, particle dosimetry and particle–cell association are interrelated; if the rate of particle–cell association increases, the dosage available to the cells decreases. As such, it is unclear whether the dosimetry model would need to be solved for each potential particle–cell association model. Numerical solutions to PDEs can be computationally expensive to obtain, and it may not be feasible to investigate a broad range of model components if each potential model requires the dosimetry model to be solved separately. One strength of equation learning is that it can identify the learned model without the need for multiple, potentially expensive, computational solutions. As such, it is instructive to investigate whether equation learning can be combined with models of particle dosimetry to efficiently identify the particle–cell interaction dynamics when sedimentation and/or dosage depletion effects are relevant.
Data availability
Certain experimental data used in this analysis have been previously published20,52 and raw data are available at https://figshare.com/projects/In_vitro_cell-particle_association/59162. The code used to implement the equation learning framework is available at https://github.com/DrStuartJohnston/particle-cell-interactions-equation-learning.Author contributions
Conceptualisation (STJ, MF); data curation (STJ, MF); formal analysis (STJ); investigation (STJ); methodology (STJ, MF); software (STJ); visualisation (STJ); writing – original draft (STJ, MF); writing – review and editing (STJ, MF).Conflicts of interest
There are no conflicts of interest to declare.Acknowledgements
S. T. J. is supported by the Australian Research Council (project no. DE200100988). M. F. is supported by a gift from the estate of Réjane Louise Langlois. The authors thank the anonymous referees for their helpful feedback.Notes and references
- Y.-F. Kang, C. Sun, Z. Zhuang, R.-Y. Yuan, Q. Zheng, J.-P. Li, P.-P. Zhou, X.-C. Chen, Z. Liu and X. Zhang, et al. , ACS Nano, 2021, 15, 2738–2752 CrossRef PubMed.
- E. H. Pilkington, E. J. Suys, N. L. Trevaskis, A. K. Wheatley, D. Zukancic, A. Algarni, H. Al-Wassiti, T. P. Davis, C. W. Pouton and S. J. Kent, et al. , Acta Biomater., 2021, 131, 16–40 CrossRef PubMed.
- A. E. Nel, L. Mädler, D. Velegol, T. Xia, E. M. Hoek, P. Somasundaran, F. Klaessig, V. Castranova and M. Thompson, Nat. Mater., 2009, 8, 543–557 CrossRef PubMed.
- S. Zhang, H. Gao and G. Bao, ACS Nano, 2015, 9, 8655–8671 CrossRef PubMed.
- W. Poon, B. R. Kingston, B. Ouyang, W. Ngo and W. C. Chan, Nat. Nanotechnol., 2020, 15, 819–829 CrossRef CAS.
- C. Åberg, Nanoscale Adv., 2021, 3, 2196–2212 RSC.
- N. D. Donahue, H. Acar and S. Wilhelm, Adv. Drug Delivery Rev., 2019, 143, 68–96 CrossRef CAS.
- S. T. Johnston, M. Faria and E. J. Crampin, Nanoscale Adv., 2021, 3, 2139–2156 RSC.
- C. Wilhelm, F. Gazeau, J. Roger, J. Pons and J.-C. Bacri, Langmuir, 2002, 18, 8148–8155 CrossRef CAS.
- L. Treuel, S. Brandholt, P. Maffre, S. Wiegele, L. Shang and G. U. Nienhaus, ACS Nano, 2014, 8, 503–513 CrossRef CAS PubMed.
- H. Yu, D. Luo, L. Dai and F. Cheng, Nanoscale, 2021,(13), 8722–8739 RSC.
- V. Belli, D. Guarnieri, M. Biondi, F. Della Sala and P. A. Netti, Colloids Surf., B, 2017, 149, 7–15 CrossRef CAS.
- A. L. Doiron, B. Clark and K. D. Rinker, Biotechnol. Bioeng., 2011, 108, 2988–2998 CrossRef PubMed.
- C. V. Dowling, P. M. Cevaal, M. Faria and S. T. Johnston, bioRxiv, 2022.
- A. Lesniak, A. Salvati, M. J. Santos-Martinez, M. W. Radomski, K. A. Dawson and C. Åberg, J. Am. Chem. Soc., 2013, 135, 1438–1444 CrossRef PubMed.
- T. T. Goodman, J. Chen, K. Matveev and S. H. Pun, Biotechnol. Bioeng., 2008, 101, 388–399 CrossRef.
- M. Li, K. T. Al-Jamal, K. Kostarelos and J. Reineke, ACS Nano, 2010, 4, 6303–6317 CrossRef PubMed.
- J. M. Cohen, G. M. DeLoid and P. Demokritou, Nanomedicine, 2015, 10, 3015–3032 CrossRef PubMed.
- G. M. DeLoid, J. M. Cohen, G. Pyrgiotakis, S. V. Pirela, A. Pal, J. Liu, J. Srebric and P. Demokritou, Part. Fibre Toxicol., 2015, 12, 1–20 CrossRef PubMed.
- M. Faria, K. F. Noi, Q. Dai, M. Björnmalm, S. T. Johnston, K. Kempe, F. Caruso and E. J. Crampin, J. Controlled Release, 2019, 307, 355–367 CrossRef PubMed.
- M. Faria, S. T. Johnston, A. J. Mitchell, E. Crampin and F. Caruso, Chem. Mater., 2021, 33, 7613–7619 CrossRef.
- S. T. Johnston, M. Faria and E. J. Crampin, J. R. Soc., Interface, 2020, 17, 20200221 CrossRef PubMed.
- P. Rees, J. W. Wills, M. R. Brown, C. M. Barnes and H. D. Summers, Nat. Commun., 2019, 10, 1–8 CrossRef.
- H. D. Summers, P. Rees, M. D. Holton, M. R. Brown, S. C. Chappell, P. J. Smith and R. J. Errington, Nat. Nanotechnol., 2011, 6, 170–174 CrossRef.
- S. T. Johnston, M. Faria and E. J. Crampin, J. R. Soc., Interface, 2018, 15, 20180364 CrossRef.
- L. Rodriguez-Lorenzo, B. Rothen-Rutishauser, A. Petri-Fink and S. Balog, Part. Part. Syst. Charact., 2015, 32, 321–333 CrossRef.
- G. Sharma, V. Kodali, M. Gaffrey, W. Wang, K. R. Minard, N. J. Karin, J. G. Teeguarden and B. D. Thrall, Nanotoxicology, 2014, 8, 663–675 CrossRef PubMed.
- D. G. Thomas, J. N. Smith, B. D. Thrall, D. R. Baer, H. Jolley, P. Munusamy, V. Kodali, P. Demokritou, J. Cohen and J. G. Teeguarden, Part. Fibre Toxicol., 2018, 15, 1–22 CrossRef.
- Z. Shen, H. Ye and Y. Li, Phys. Chem. Chem. Phys., 2018, 20, 16372–16385 RSC.
- S. L. Brunton, J. L. Proctor and J. N. Kutz, Proc. Natl. Acad. Sci. U. S. A., 2016, 113, 3932–3937 CrossRef.
- K. Champion, B. Lusch, J. N. Kutz and S. L. Brunton, Proc. Natl. Acad. Sci. U. S. A., 2019, 116, 22445–22451 CrossRef.
- R. Liu, W. Jiang, C. D. Walkey, W. C. Chan and Y. Cohen, Nanoscale, 2015, 7, 9664–9675 RSC.
- S. H. Rudy, S. L. Brunton, J. L. Proctor and J. N. Kutz, Sci. Adv., 2017, 3, e1602614 CrossRef.
- Z. Ban, P. Yuan, F. Yu, T. Peng, Q. Zhou and X. Hu, Proc. Natl. Acad. Sci. U. S. A., 2020, 117, 10492–10499 CrossRef.
- J. G. Greener, S. M. Kandathil, L. Moffat and D. T. Jones, Nat. Rev. Mol. Cell Biol., 2021, 1–16 Search PubMed.
- S. M. Anwar, M. Majid, A. Qayyum, M. Awais, M. Alnowami and M. K. Khan, J. Med. Syst., 2018, 42, 1–13 CrossRef.
- J. Jiménez-Luna, F. Grisoni and G. Schneider, Nat. Mach. Intell., 2020, 2, 573–584 CrossRef.
- R. Santana, R. Zuluaga, P. Gañán, S. Arrasate, E. Onieva and H. González-Díaz, Nanoscale, 2019, 11, 21811–21823 RSC.
- J. Vamathevan, D. Clark, P. Czodrowski, I. Dunham, E. Ferran, G. Lee, B. Li, A. Madabhushi, P. Shah and M. Spitzer, et al. , Nat. Rev. Drug Discovery, 2019, 18, 463–477 CrossRef.
- M. R. Findlay, D. N. Freitas, M. Mobed-Miremadi and K. E. Wheeler, Environ. Sci.: Nano, 2018, 5, 64–71 RSC.
- X. Yan, A. Sedykh, W. Wang, X. Zhao, B. Yan and H. Zhu, Nanoscale, 2019, 11, 8352–8362 RSC.
- I. Furxhi and F. Murphy, Int. J. Mol. Sci., 2020, 21, 5280 CrossRef.
- W. J. Murdoch, C. Singh, K. Kumbier, R. Abbasi-Asl and B. Yu, Proc. Natl. Acad. Sci. U. S. A., 2019, 116, 22071–22080 CrossRef.
- C. Rudin, Nat. Mach. Intell., 2019, 1, 206–215 CrossRef PubMed.
- C. Rudin and J. Radin, Harv. Data Sci. Rev., 2019, 1, 2 Search PubMed.
- N. M. Mangan, J. N. Kutz, S. L. Brunton and J. L. Proctor, Proc. R. Soc. A, 2017, 473, 20170009 CrossRef CAS PubMed.
- J. H. Lagergren, J. T. Nardini, R. E. Baker, M. J. Simpson and K. B. Flores, PLoS Comput. Biol., 2020, 16, e1008462 CrossRef CAS PubMed.
- J. H. Lagergren, J. T. Nardini, G. Michael Lavigne, E. M. Rutter and K. B. Flores, Proc. R. Soc. A, 2020, 476, 20190800 CrossRef.
- J. T. Nardini, R. E. Baker, M. J. Simpson and K. B. Flores, J. R. Soc., Interface, 2021, 18, 20200987 CrossRef.
- N. M. Mangan, S. L. Brunton, J. L. Proctor and J. N. Kutz, IEEE Trans. Mol. Biol. Multi-Scale Commun., 2016, 2, 52–63 Search PubMed.
- J. T. Nardini, J. H. Lagergren, A. Hawkins-Daarud, L. Curtin, B. Morris, E. M. Rutter, K. R. Swanson and K. B. Flores, Bull. Math. Biol., 2020, 82, 1–33 CrossRef.
- A. V. Fuchs, B. W. Tse, A. K. Pearce, M.-C. Yeh, N. L. Fletcher, S. S. Huang, W. D. Heston, A. K. Whittaker, P. J. Russell and K. J. Thurecht, Biomacromolecules, 2015, 16, 3235–3247 CrossRef CAS.
- N. Akuzawa, M. Kurabayashi, Y. Ohyama, M. Arai and R. Nagai, Arterioscler. Thromb. Vasc. Biol., 2000, 20, 377–384 CrossRef CAS PubMed.
- W. Chanput, J. J. Mes and H. J. Wichers, Int. Immunopharmacol., 2014, 23, 37–45 CrossRef CAS PubMed.
- H. Yasumoto, A. Matsubara, K. Mutaguchi, T. Usui and W. L. McKeehan, Prostate, 2004, 61, 236–242 CrossRef CAS PubMed.
- T. Lijster and C. Åberg, PLoS One, 2020, 15, e0242547 CrossRef CAS.
- R. Chartrand, Int. Scholarly Res. Not., 2011, 164564 Search PubMed.
- C. Dugas, Y. Bengio, F. Bélisle, C. Nadeau and R. Garcia, J. Mach. Learn. Res., 2009, 10, 1239–1262 Search PubMed.
- M. Abadi, A. Agarwal, P. Barham, E. Brevdo, Z. Chen, C. Citro, G. S. Corrado, A. Davis, J. Dean and M. Devin, et al., arXiv, 2016, 1603.04467.
- R. Tibshirani, J. R. Stat. Soc. Series B: Stat. Methodol., 1996, 58, 267–288 Search PubMed.
- F. Pedregosa, G. Varoquaux, A. Gramfort, V. Michel, B. Thirion, O. Grisel, M. Blondel, P. Prettenhofer, R. Weiss, V. Dubourg, J. Vanderplas, A. Passos, D. Cournapeau, M. Brucher, M. Perrot and E. Duchesnay, J. Mach. Learn. Res., 2011, 12, 2825–2830 Search PubMed.
- L. I. FitzGerald and A. P. Johnston, J. Colloid Interface Sci., 2021, 587, 64–78 CrossRef CAS PubMed.
- C. Gottstein, G. Wu, B. J. Wong and J. A. Zasadzinski, ACS Nano, 2013, 7, 4933–4945 CrossRef.
- H. D. Summers, C. P. Gomes, A. Varela-Moreira, A. P. Spencer, M. Gomez-Lazaro, A. P. Pêgo and P. Rees, Nanomaterials, 2021, 11, 2606 CrossRef PubMed.
- M. J. Simpson, A. P. Browning, D. J. Warne, O. J. Maclaren and R. E. Baker, J. Theor. Biol., 2022, 535, 110998 CrossRef PubMed.
- Y. Ju, J. Cui, H. Sun, M. Müllner, Y. Dai, J. Guo, N. Bertleff-Zieschang, T. Suma, J. J. Richardson and F. Caruso, Biomacromolecules, 2016, 17, 2268–2276 CrossRef PubMed.
- M. Lucafo, S. Pacor, C. Fabbro, T. Da Ros, S. Zorzet, M. Prato and G. Sava, J. Nanopart. Res., 2012, 14, 1–13 CrossRef.
- Y. Wu, W. Tang, P. Wang, C. Liu, Y. Yuan and J. Qian, Part. Part. Syst. Charact., 2015, 32, 779–787 CrossRef CAS.
- J. Cui, M. Faria, M. Björnmalm, Y. Ju, T. Suma, S. T. Gunawan, J. J. Richardson, H. Heidari, S. Bals and E. J. Crampin, et al. , Langmuir, 2016, 32, 12394–12402 CrossRef CAS PubMed.
Footnote |
| † Electronic supplementary information (ESI) available: Further detail about the equation learning framework, including results demonstrating neural network convergence, extensions to new forms of synthetic data, and tables of the learned model parameters. See DOI: https://doi.org/10.1039/d2nr04668g |
| This journal is © The Royal Society of Chemistry 2022 |