Theoretical insights into the electroreduction of nitrate to ammonia on graphene-based single-atom catalysts†
Yuanyuan
Wang
ab,
Donghai
Wu
abc,
Peng
Lv
ab,
Bingling
He
ab,
Xue
Li
ab,
Dongwei
Ma
 *ab and
Yu
Jia
 *abd
*abd
aKey Laboratory for Special Functional Materials of Ministry of Education, and School of Materials Science and Engineering, Henan University, Kaifeng 475004, China. E-mail: madw@henu.edu.cn; jiayu@henu.edu.cn
bJoint Center for Theoretical Physics, and Center for Topological Functional Materials, Henan University, Kaifeng 475004, China
cHenan Key Laboratory of Nanocomposites and Applications, Institute of Nanostructured Functional Materials, Huanghe Science and Technology College, Zhengzhou 450006, China
dInternational Laboratory for Quantum Functional Materials of Henan, and School of Physics, Zhengzhou University, Zhengzhou 450001, China
First published on 8th July 2022
Abstract
Electrocatalytic reduction of harmful nitrate (NO3−) to valuable ammonia (eNO3RR) is critical and attractive for both environmental remediation and energy transformation. A single atom catalyst (SAC) based on graphene represents one of the most promising eNO3RR catalysts. However, the underlying catalytic mechanism and the intrinsic factors dictating the catalytic activity trend remain unclear. Herein, using first-principles calculations, eNO3RR on TMN3 and TMN4 (TM = Ti–Ni) doped graphene was thoroughly investigated. Our results reveal that FeN4 doped graphene exhibits excellent eNO3RR performance with a low limiting potential of −0.38 V, agreeing with the experimental finding, which can be ascribed to the effective adsorption and activation of NO3−via the charge “acceptance–donation” mechanism and its moderate binding due to the occupation of the d–p antibonding orbital. In particular, we found that eNO3RR activities are well correlated with the intrinsic properties of TM centers and their local environments. With the established activity descriptor, several other graphene-based SACs were efficiently screened out with excellent eNO3RR performance. Our studies could not only provide an atomic insight into the catalytic mechanism and activity origin of eNO3RR on graphene-based SACs, but also open an avenue for the rational design of SACs for eNO3RR towards ammonia by regulating the metal center and its local coordination environment.
1. Introduction
Ammonia (NH3) is not only one of the most fundamental industrial chemicals but also acts as an emerging energy storage medium and carbon-free energy carrier.1,2 For more than one century, NH3 synthesis in industry has mainly relied on the Haber–Bosch technology operating under harsh conditions. Considering that the Haber–Bosch process is both energy- and capital-intensive, in recent years the electrochemical synthesis of NH3 through the nitrogen reduction reaction (NRR), driven by renewable energy, has attracted great research interest.3,4 However, generally the NRR suffers from an unsatisfactory conversion rate and low faradaic efficiency, resulting from the extremely inert N2 molecule.5,6 Given the much weaker N![[double bond, length as m-dash]](https://www.rsc.org/images/entities/char_e001.gif) O bond (204 kJ mol−1) and N–O bond (176 kJ mol−1) than the N
O bond (204 kJ mol−1) and N–O bond (176 kJ mol−1) than the N![[triple bond, length as m-dash]](https://www.rsc.org/images/entities/char_e002.gif) N bond (941 kJ mol−1), very recently, other nitrogen resources, including nitrate (NO3−), nitrite (NO2−), and nitric oxide (NO), have attracted more and more attention for NH3 synthesis.7,8 As the third-largest accessible form of nitrogen9 and most oxidized reactive nitrogen,10 NO3− has been considered as one of the most widespread water pollutants in the world.11,12 Under this circumstance, the electrocatalytic NO3− reduction reaction (eNO3RR) to produce NH3 is considered as a promising alternative to the NRR because it can simultaneously remediate environmental pollution and yield valuable NH3 potentially more efficiently than the NRR.13,14
N bond (941 kJ mol−1), very recently, other nitrogen resources, including nitrate (NO3−), nitrite (NO2−), and nitric oxide (NO), have attracted more and more attention for NH3 synthesis.7,8 As the third-largest accessible form of nitrogen9 and most oxidized reactive nitrogen,10 NO3− has been considered as one of the most widespread water pollutants in the world.11,12 Under this circumstance, the electrocatalytic NO3− reduction reaction (eNO3RR) to produce NH3 is considered as a promising alternative to the NRR because it can simultaneously remediate environmental pollution and yield valuable NH3 potentially more efficiently than the NRR.13,14
Rational design of the electrocatalyst with excellent activity, high selectivity, and long durability is critical for the development of a practical eNO3RR device. Encouragingly, various catalysts, such as molecular solids,13 pure metals,7,15,16 metallic alloys,17–19 metal compounds,20–23 and atomic catalysts,24–34 have been demonstrated to be highly efficient for eNO3RR. For example, it is shown that, at −0.4 V versus the reversible hydrogen electrode, an NH3 production rate of 436 ± 85 μg h−1 cm−2 and ultrahigh faradaic efficiency of 85.9% can be achieved on the copper–molecular solid catalyst.13 Single atom catalysts (SACs), such as TMN3 and TMN4-doped graphene (denoted as TMN3@G and TMN4@G, respectively), have attracted huge attention in electrocatalysis due to their unique electronic and geometric structures as well as high stability.35,36 For eNO3RR, several SACs have been experimentally reported to be excellent,24–28 and theoretically predicted to be promising.29–33 For example, FeN4@G can exhibit an NH3 yield rate of up to ∼20![[thin space (1/6-em)]](https://www.rsc.org/images/entities/char_2009.gif) 000 μg h−1 mgcat.−1 and a maximal faradaic efficiency of ∼75%.25
000 μg h−1 mgcat.−1 and a maximal faradaic efficiency of ∼75%.25
Besides the common merits of SACs, graphene-based SACs can be considered as an ideal platform for understanding the fundamental physical chemistry of a specific reaction from first-principles calculations, due to the distinct geometric and electronic characteristics of the graphene support.37 Moreover, the coordination environment of the TM center embedded in graphene can be purposely tuned via direct and indirect coordination engineering, which produces huge numbers of SAC systems and makes graphene-based SACs find various potential applications, especially for electrocatalysis.38,39 As discussed above, until now only FeN4@G has been investigated for eNO3RR towards NH3.25 Thus, the investigation of eNO3RR catalyzed by graphene-based SACs is still in its infancy, and it is urgent to unravel the underlying catalytic mechanism and activity origin, and identify the intrinsic factors dictating their catalytic activity trend, guided by which high performance graphene-based SACs for eNO3RR can be rationally designed effectively.
Based on the above considerations, herein we systematically studied the eNO3RR on TMN3@G and TMN4@G (TM = Ti, V, Cr, Mn, Fe, Co, Ni, and Cu), through first-principles calculations. The detailed reaction pathway for the electroreduction of NO3− into NH3 was explored thoroughly, to illustrate the activity and selectivity. It is found that FeN4@G stands at the top of the volcano among TMN4@G with a limiting potential (UL) −0.38 V, and exhibits the highest eNO3RR performance, in agreement with the experimental findings.25 In addition, among TMN3@G, CoN3@G exhibits the highest eNO3RR performance with UL of −0.65 V. Then, the eNO3RR activity origin was investigated through electronic structure analysis. Finally, an intrinsic descriptor to uncover the eNO3RR activity trend for the graphene-based SAC was proposed, which correlates with the local environment of the TM atom, i.e., its electronegativity and coordination number, and the electronegativity of its nearest neighbor atoms. The identified descriptor is distinct from the previously proposed one, that is, the binding free energy of NO3− (ΔG(NO3*)),29–33 which is based on energies that are hard to measure and modulate in experiments. In addition, guided by the proposed descriptor, several other graphene-based SACs with high eNO3RR performance were efficiently screened out, and especially the non-noble metal Ni SAC coordinated with one nitrogen and two carbon atoms exhibits a high intrinsic activity with UL of −0.41 V.
2. Computational details
In this work, spin-polarized first-principles calculations were carried out using Vienna Ab initio Simulation Package (VASP).40 The projector augmented wave (PAW) method was employed to account for the electron–ion interactions.41 The exchange–correlation effect was described by the Perdew–Burke–Ernzerhof (PBE) functional within the generalized gradient approximation (GGA).42 The cutoff energy for the plane-wave basis set was taken as 450 eV. The Grimme's DFT-D3 method was adopted to account for the van der Waals interaction.43 The energy and force convergence criteria for the geometry optimizations were set as 10−5 eV and 0.02 eV Å−1, respectively. The Brillouin zone of the 7 × 7 × 1 graphene supercell was sampled by 3 × 3 × 1 and 6 × 6 × 1 k-point meshes for structural optimization and calculation of densities of states (DOS), respectively. A vacuum thickness of ∼20 Å was placed along the z direction to minimize the interaction between periodic units. The thermal stability was estimated through ab initio molecular dynamics (AIMD) simulations.According to the computational hydrogen electrode (CHE) model,44 the Gibbs free energy change (ΔG) for each elemental step was calculated by
| ΔG = ΔE + ΔEZPE − TΔS. |
In the equation, ΔE was directly obtained from DFT calculations. ΔEZPE and TΔS (T = 298.15 K) are the contributions of zero-point energy and entropy, respectively, which were acquired by computing the vibrational frequency of intermediates, as listed in Table S1,† while ΔEZPE and TΔS of the free molecules were taken from the NIST database (Table S2†).45 For the CHE model, for the reaction A* + H+ + e− → AH*, the free energy change is calculated according to G(AH*) − [μ(H+) + μ(e−)] − G(A*). The CHE model shows that the chemical potential of a proton–electron pair [(μ(H+) + μ(e−)] at zero potential can be regarded as half the chemical potential of the free H2 molecule [1/2μ(H2)], i.e., μ(H+) + μ(e−) = 1/2μ(H2). Based on this model, G(AH*) − [μ(H+) + μ(e−)] − G(A*) can be calculated as G(AH*) − 1/2μ(H2) − G(A*). UL is formulized with UL = ΔGmax/e, where ΔGmax is the free energy change of the potential-determining step (PDS).46 When computing the binding free energy of NO3− (ΔG(NO3*)), the gaseous HNO3 was adopted as a reference, and due to that directly calculating the energy of charged NO3− is difficult.47,48 Then ΔG(NO3*) was obtained by
| ΔG(NO3*) = G(NO3*) − G* − [G(HNO3) − 1/2G(H2)] + ΔGcorrect |
3. Results and discussion
3.1. NO3− adsorption
TMN3@G and TMN4@G have been widely studied both experimentally and theoretically for various catalytic reactions, especially the electrocatalysis reaction because the graphene support has a large surface area, excellent conductivity, and high (electro)-chemical stability. TMN3@G and TMN4@G feature TM single atoms that are coordinated with three and four pyridine nitrogen atoms, respectively, in the graphene matrix, which could significantly influence their activity, selectivity, and stability, due to the strong electronic-metal support interaction.50,51 Typical atomic configurations of TMN3@G and TMN4@G are presented in Fig. 1 and S1a, S1b,† and seven TMs (Ti, V, Cr, Mn, Fe, Co, and Ni) have been considered as the catalytic active center. The key parameters of these systems are compiled in Table S3,† such as TM–N bond lengths, charge transfers,52 and spin magnetic moments, which agree well with previous studies.53 The total DOS for all these SACs presented in Fig. S1c and S1d† suggest their metallic characteristics, beneficial to the charge transfer during eNO3RR.30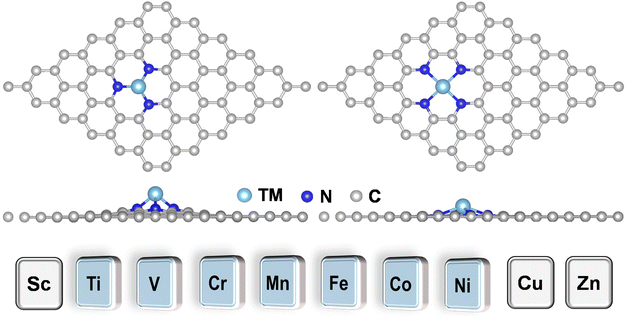 | ||
| Fig. 1 Typical atomic configurations of the TMN3@G (left) and TMN4@G (right) systems. The considered TM atoms include Ti, V, Cr, Mn, Fe, Co, and Ni. | ||
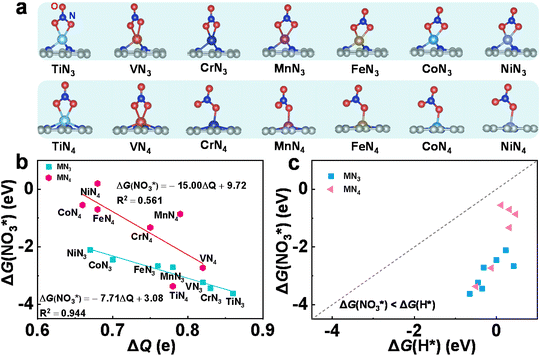
Effective adsorption of NO3− is a prerequisite to trigger the eNO3RR process. Hence, we first investigated the adsorption behavior of NO3− on these SACs. Various adsorption configurations have been considered with one or two O atoms bonded with TM centers, and the most stable ones are shown in Fig. 2a, for which the key structural parameters are displayed in Table S4.† We can see that on TMN3@G, NO3− tends to be adsorbed via two O atoms, while on TMN4@G, NO3− prefers to be adsorbed via one O atom, except TiN4 and VN4@G. Accordingly, the values of ΔG(NO3*) (Table S4†) indicate that for the same TM, TMN3@G possesses higher NO3− binding strength than TMN4@G, and for the same coordination the adsorption strength gradually decreases with the active center changing from Ti to Ni. Then the charge transfer from the supports to NO3− was calculated (Table S4†). From Fig. 2b, we can see that there is a good linear correlation between the charge gained by the adsorbates and their binding strengths to TMN3@G, i.e., the more strongly NO3− binds, the more negatively charged they are.29,30 In contrast, the correlation between the charge of the adsorbates and the binding strengths for TMN4@G is rather poor, which may result from the distinct adsorption configurations of NO3− on different TMN4@G, as shown in Fig. 2a. The different correlations between NO3− binding strength on TMN3@G and TMN4@G reflect the coordination environment effects.
Moreover, in solution, the hydrogen evolution reaction (HER) is the main competing reaction against eNO3RR. To effectively suppress the HER, NO3− should be bonded more strongly than H.29,30 We, therefore, studied the adsorption of H atoms on all the investigated systems, for which the optimized structures are presented in Fig. S2.† As shown in Fig. 2c, for all the cases the binding free energy of H* (ΔG(H*)) is much more positive than ΔG(NO3*), indicating that the active site will be preferentially occupied by NO3− rather than H, and thus the HER can be effectively suppressed.
3.2. Reaction mechanism of eNO3RR
Although eNO3RR is complicated and potentially has a variety of products (such as NO2, NO, N2O, and N2), the Pourbaix diagram of nitrogen species indicates that NH3/NH4+ is the most stable product in thermodynamics under the negative electrode potential.29,54 Thus, it is quite necessary to fully explore the detailed reaction process of NO3− electroreduction into NH3. Given that there are multiple adsorption structures and hydrogenation positions of intermediates, during the eNO3RR process the most stable intermediates in each elementary step have been selected for further reaction to efficiently screen out the optimal eNO3RR pathway on TMN3@G and TMN4@G. The adsorption configurations of the key intermediate, NO*, are displayed in Fig. S3.† In most cases, NO adsorption adopts the N-end pattern with the N atom bonded with the TM atom, suggesting that the N-end pathway proposed previously should be feasible.29,30 The calculated UL values and the corresponding PDS are summarized in Fig. 3. Interestingly, for most systems, OH* + H+ + e− → * + H2O is the PDS, and the strongly bonded OH* group could lead to catalyst poisoning. Moreover, generally UL exhibits a general decreasing trend changed from early TM to late TM for both TMN3 and TMN4@G. Importantly, CoN3 and FeN4@G exhibit the highest eNO3RR activity among the considered TMN3@G and TMN4@G systems, respectively. The PDS of CoN3 and FeN4@G are NO* + H+ + e− → HNO* and HNO* + H+ + e− → HNOH* with UL values of −0.65 and −0.38 V, respectively. Note that the full reaction pathways of CoN4 and NiN4@G systems have not been studied, due to that they are unable to effectively capture the key reaction intermediate (NO3H*), as shown in Fig. S4.†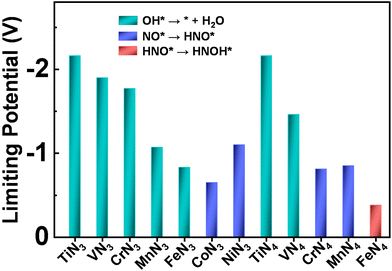 | ||
| Fig. 3 Summary of the limiting potential and potential-determining step for eNO3RR on various SACs along the most favorable pathway. | ||
To get insight into the reaction mechanism of eNO3RR, the reaction pathways on CoN3 and FeN4@G are presented in Fig. 4, and those for the other systems in Fig. S5–S14.† Firstly, NO3− is adsorbed on CoN3@G (Fig. 4a) and FeN4@G (Fig. 4b) with two O–Co bonds and one O–Fe bond, respectively, with ΔG(NO3*) values of −2.45 and −0.70 eV. Distinct binding strengths of NO3− will lead to different activation and different free energy changes in the first hydrogenation step. Interestingly, the first proton–electron pair prefers to attack the O atom of NO3* bonded with Co (Fe) rather than the terminal O atom. Consequently, one N–O bond is cleaved to form NO2* + OH* on CoN3@G with an energy release of −0.72 eV, while on FeN4@G, NO3H* is formed with an energy input of 0.23 eV. The second hydrogenation step leads to the formation of a H2O molecule. The intermediate, NO2*, binds with the Co atom via two Co–O bonds, while it binds with the Fe atom with the Fe–N bond, and the processes are exothermic by 0.82 and 2.28 eV, respectively, on CoN3 and FeN4@G. The subsequent proton–electron pair transfer leads to the hydrogenation of NO2*. On CoN3@G, NO* + OH* is formed with a free energy uphill of 0.44 eV, while, on FeN4@G, NO2H* is formed with a free energy downhill of 0.08 eV. Following this, they are attacked by the proton–electron pair to release the H2O molecule and leave NO* on both CoN3 and FeN4@G, with an energy change of −1.99 and −1.70 eV, respectively. On both systems, NO* prefers the end-on adsorption pattern, and is hydrogenated to form HNO* species. For CoN3@G, the hydrogenation of NO* needs an energy input of 0.65 eV, and the following hydrogenation of HNO* prefers to undergo the consecutive pathway to release the NH3 molecule through HNO* → H2NO* → O* + NH3 with the energy release of 1.11 eV. In addition, after the formation of HNO*, all the electrochemical steps are endothermic along the preferred pathways. Therefore, NO* → HNO* is the PDS and eNO3RR on CoN3@G possesses a limiting potential of −0.65 V. In contrast, as shown in Fig. 4b, NO* is hydrogenated to HNO* with a free energy change of 0.23 eV, and then HNO* is preferably hydrogenated to HNOH* with a free energy uphill of 0.38 eV. Due to this all the remaining elemental reaction steps are exothermic along the preferred pathways, HNO* → HNOH* is the PDS with a low limiting potential of −0.38 V, which agrees well with the experimental findings.25
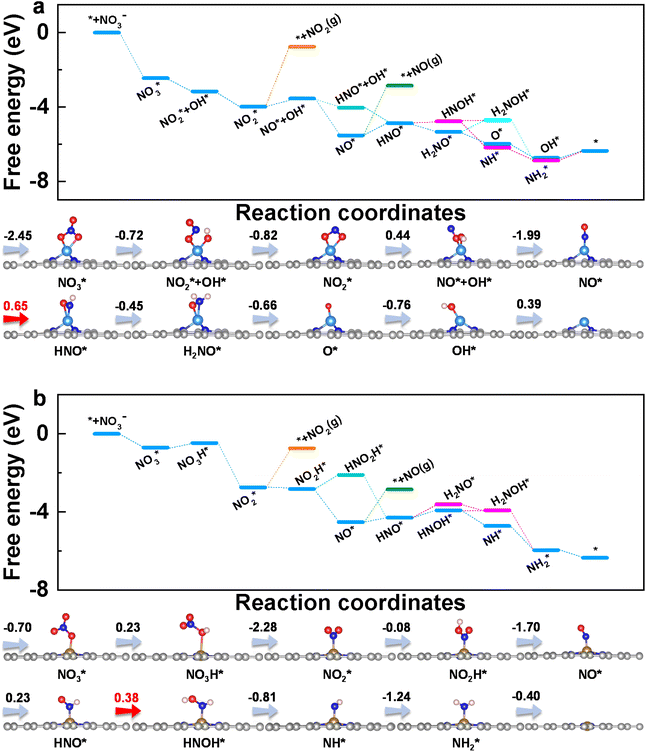 | ||
| Fig. 4 Free energy diagrams and corresponding intermediates of eNO3RR on CoN3@G (a) and FeN4@G (b). The pathways to release of NO2 and NO are also plotted for comparison. | ||
Above, we have demonstrated that the HER can be well suppressed on CoN3 and FeN4@G. In addition to the HER, we further examined the possible formation of other byproducts along the eNO3RR reaction pathways. As shown in Fig. 4a, both NO and NO2 are tightly bonded on CoN3@G with the desorption energy barriers of 2.68 and 3.22 eV, respectively, indicating the significantly difficult formation of these byproducts. In contrast, the hydrogenation of NO2* and NO* requires much less energy, further confirming that both species will be further hydrogenated rather than desorbed. Similarly, for FeN4@G (Fig. 4b), the desorption of NO and NO2 is also very difficult, as indicated by the large desorption energy barriers of 1.69 and 1.99 eV, respectively, while their hydrogenation is even exothermic (−0.08 eV for NO2* → NO2H* and 0.23 eV for NO* → HNO*). Considering that NO* is bonded with the metal center via the N atom only, the NO dimer may be formed through a couple of N–Co (Fe) bonds, which could lead to the production of N2.29–33 However, due to that NO is strongly adsorbed on CoN3 and FeN4@G, the formation of the NO dimer will need to overcome a large energy barrier. In fact, in ref. 25 the Faraday efficiencies of N2 and H2 are less than 1%, and thus our theoretical studies on eNO3RR selectivity provide a good explanation of the experimental findings. In addition, the desorption of NH3 is exothermic (−0.4 eV) on FeN4@G and slightly endothermic by 0.4 eV on CoN3@G, indicating that both systems can be easily recovered for the NO3− to NH3 electroreduction cycle. Finally, the solvation effect has been investigated for eNO3RR on FeN4@G, simulated by the implicit solvation model implemented in VASPsol.49 The free energy diagram is presented in Fig. S15.† It can be seen that the reaction pathway and PDS are the same as in the case without solvation correction, and UL is only lowered by 0.03 V.
3.3. Activity origin of eNO3RR
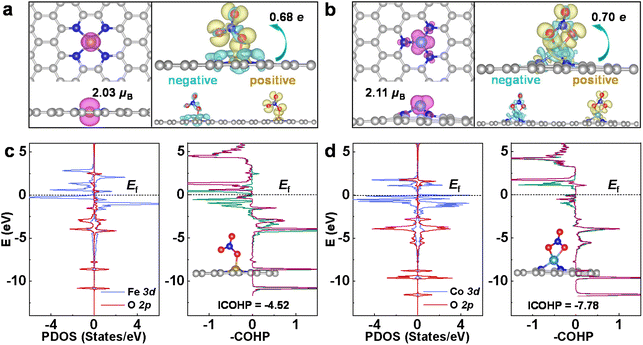
In the following, the eNO3RR activity origin of CoN3 and FeN4@G is discussed based on the electronic structure analysis, and then the key factors affecting the eNO3RR activity trend of graphene-based SACs was revealed. The adsorption and activation of NO3− is the prerequisite for its further hydrogenation, and the moderate binding strength is crucial for achieving high eNO3RR activity, according to the Sabatier principle. As shown in Fig. 5a and b, FeN4 and CoN3@G possess considerable spin magnetic moment localized on the embedded Fe (2.03μB) and Co (2.11μB) atoms, respectively. This localized spin magnetic moment of SACs and its associated spin-unpaired electrons could play an important for the adsorption and activation of small molecules, as suggested by previous studies.55,56 Accordingly, as shown in Table S4,† NiN4@G that possesses a nonmagnetic ground state is unable to effectively bind NO3− with a binding free energy of 0.20 eV. The charge redistributions owing to NO3− adsorption for FeN4 and CoN3@G are also displayed in Fig. 5a and b, respectively, where the yellow and cyan regions denote electron accumulation and depletion, respectively. On the whole, electrons are transferred from the catalysts to NO3*, in line with the Bader analysis,52 which shows that NO3* obtains ∼0.7e electrons for both systems. In detail, the electrons (yellow region) obtained by NO3* mainly occupy its antibonding orbitals, while besides the supports, NO3* also loses some charges (cyan region) from its bonding orbitals. Therefore, NO3* is effectively activated for the further hydrogenation reaction via the charge “acceptance–donation” mechanism, similar to the case of N2 activation in the NRR.57Furthermore, the orbital interaction between NO3* and its bonded Fe or Co was investigated. The projected DOS for the FeN4 and CoN3@G are presented in Fig. 5c and d, respectively, and the others in Fig. S16.† We can see that, in a large energy range, 3d states of the Fe or Co effectively interact with 2p states of O of NO3*. Furthermore, interestingly, crystal orbital Hamilton populations (COHP)58 calculations show that for FeN4@G there are significant d–p antibonding states occupied below the Fermi level, while for CoN3@G the occupation of the d–p antibonding states is much less, which gives integrated COHP (ICOHP) of −4.52 and −7.78, respectively, for FeN4 and CoN3@G. The less negative ICOHP means weaker chemical bonding interaction, and thus the COHP analysis verifies the calculated binding strength trend of NO3− on FeN4 and CoN3@G. As discussed in previous works29–33 and in the following herein, the moderate binding of NO3− is crucial for the high eNO3RR activity. Thus, the occupied antibonding states near the Fermi level could play an important role in mediating the binding strength of NO3* on FeN4@G appropriately to achieve high eNO3RR activity.
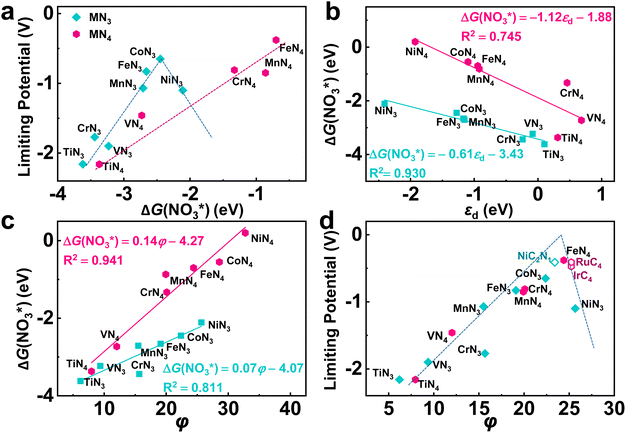
According to the Sabatier principle, either too strong or too weak adsorption of the reaction intermediates goes against the whole catalytic process. This empirical principle has been turned into a quantitative predictive tool with the improvement of the accuracy of DFT calculatios.59 Currently, the binding free energy of the key intermediate has been often taken as the descriptor for various reactions to predict the activity trend and guide the catalyst design.60–62 As for eNO3RR, previous studies indicate that ΔG(NO3*) can be adopted as an effective descriptor.29–33 Herein, as shown in Fig. 6a, although exhibiting different activity trend, the UL values of both TMN3@G and TMN4@G are well correlated with ΔG(NO3*). For TMN3@G, CoN3@G locates at the peak of the activity volcano, while for TMN4@G, Fe4@G at the peak of the activity volcano, considering that Co4 and Ni4@G should have low catalytic activity due to the considerably low chemical activity to capture the key intermediate as discussed above. In addition, from Fig. 3, we note that too strong adsorption of NO3− means that the active sites possess too high chemical activity, which tend to overbind OH*, leading to OH* → * + H2O as the PDS and high UL (including TiN3, VN3, CrN3, MnN3, FeN3, TiN4, and VN4@G). On the other hand, relatively weak adsorption of NO3− on the catalysts leads to NO* → HNO* or HNO* → HNOH* as the PDS with lower UL (such as CoN3, CrN4, MnN4, and FeN4@G).
As ΔG(NO3*) can serve as a good activity descriptor, it is necessary to identify the properties of the catalysts that determine it. It has been well-established in surface science and heterogeneous catalysis that the binding strength of an adsorbate on a metal surface correlates with the d-band center of the atoms to which the adsorbate binds.63,64 This conclusion also holds for the present case. As shown in Fig. 6b, there are good linear relationships between the d-band center of the embedded TM (Fig. S17†) and the binding free energies of NO3− with different trends for TMN3@G and TMN4@G. It is noted that the binding energy of the adsorbate is hard to measure and control, while the d-band center can be accessible experimentally by using synchrotron-based high-resolution photoemission spectroscopy and tuned by various means.65,66 However, the descriptor that only includes the intrinsic physical and chemical properties without resorting to theoretical calculations or experimental measurements is more preferable. So, we consider the descriptor, φ, proposed by Xu et al.,67 which can be verified by the d-band center model and defined as
Taking φ as a guide, we further studied the eNO3RR activity of graphene-based SACs in other coordination environments, including TMC3−xNx@G (x = 0–2) and TMC4−xNx (x = 0–3). In particular, NiC2N1, RuC4, and IrC4@G, possessing φ values of 23.4, 25.23, and 25.23 respectively, locate near the high-activity region. Therefore, the eNO3RR reaction pathways for these three systems were further explored in detail. Interestingly, our calculated results show that NiC2N1, RuC4, and IrC4@G indeed follow the volcano relationship presented in Fig. 6d, with UL values of −0.41, −0.41, and −0.47 V respectively. The free energy diagram and atomic configuration of intermediates are presented in Fig. 7 for NiC2N1@G, and Fig. S18 and S19† for RuC4 and IrC4@G, respectively. From Fig. 7, NiC2N1@G not only exhibits high intrinsic eNO3RR activity but also excellent selectivity against other products, and thus is a promising candidate with low cost for efficient electro conversion of NO3− to NH3. Considering that NiC2N1@G has been synthesized,68 this descriptor guided eNO3RR catalyst design strategy could be experimentally verified in the future.
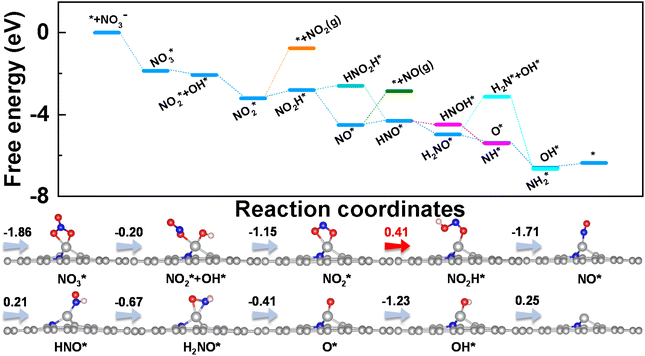 | ||
| Fig. 7 Free energy diagrams and corresponding intermediates of eNO3RR on NiC2N1@G. The pathways to release of NO2 and NO are also plotted for comparison. | ||
In addition, small amounts of NO2− may coexist with NO3− in the solution.69 Therefore, we studied the binding strengths of NO2− (ΔG(NO2*)) for the systems of CoN3, FeN4, NiC2N1, RuC4, and IrC4@G, which exhibit relatively high eNO3RR activity. The values of ΔG(NO3*) for CoN3, FeN4, NiC2N1, RuC4, and IrC4@G are −2.45, −0.70, −1.86, −1.85, and −1.73 eV, respectively. The values of ΔG(NO2*) for CoN3, FeN4, NiC2N1, RuC4, and IrC4@G are −2.38, −1.14, −1.60, −1.64, and −1.64 eV, respectively. We can see for FeN4@G that NO2− binds more strongly than NO3−. Therefore, there may be competition between the electrocatalytic reduction of NO2− and NO3−. However, as shown in Fig. 4b, NO2* is the intermediate of eNO3RR. In particular, the PDS for eNO3RR on FeN4@G is the hydrogenation of HNO*, which means that the reduction of NO2− follows the same paths as eNO3RR. Therefore, if there is NO2− in the solution, NO2− will be reduced first to produce NH3, and then NO3− will be reduced to produce NH3. In other words, FeN4@G is a bifunctional electrocatalyst for reducing both NO2− and NO3− to yield NH3.
Finally, it is noted that Ling et al. have performed a systematic theoretical study on the NRR on the graphene-based SACs with the computational settings consistent with ours.53 Comparing this work with ours, the main differences between the NRR and eNO3RR on the graphene-based SACs can be summarized as follow. From ref. 53, we can see that for the graphene-based SACs the active sites for the NRR are early transition metals with less d electrons and high activity, including Nb, W, Re, V, Zr, and Mo, except that there is one system with Ru as the active site. This is in sharp contrast with the situation of eNO3RR. From our theoretical results, the active centers of the SACs with high NO3RR activity are late transition metals with more d electrons and low chemical activity, such as Fe, Ni, Ru, and Ir. The reason for this difference is that the N2 molecule is extremely inert and hard to be activated, while NO3− can be easily activated, due to the much larger bond energy of N2 compared with NO3−.
4. Conclusion
In conclusion, eNO3RR on TMN3@G and TMN4@G SACs has been systematically studied by means of first-principles calculations. The calculated results show that FeN4@G exhibits high eNO3RR activity (UL = −0.38 V) and excellent NH3 selectivity to suppress the formation of byproducts, including other nitrogen-containing molecules and H2. The activity origin can be traced back to the effective adsorption and activation of NO3−via the charge “acceptance–donation” mechanism and its moderate binding due to the occupation of the d–p antibonding orbital. These theoretical results provide a deep understanding of the excellent eNO3RR performance of FeN4@G demonstrated in the experiments.25 More importantly, it is found that the eNO3RR activities of TMN3@G and TMN4@G SACs are well correlated with their intrinsic properties. The established activity descriptor, φ, including the coordination number, and the electronegativity of the TM center and its coordinated atoms, can be conveniently used to guide the design of graphene-based SACs for efficient eNO3RR. Finally, taking φ as a guide, several other graphene-based SACs were efficiently screened out with excellent eNO3RR performance. Our studies provide an atomic understanding of the catalytic mechanism and activity origin of the eNO3RR on graphene-based SACs, and further highlight the importance of the metal center and its local coordination environment for tuning the eNO3RR performance of SACs.Conflicts of interest
The authors declare no conflict of interest.Acknowledgements
This work is supported by the National Natural Science Foundation of China (Grant No. 12074099) and the Program for Science & Technology Innovation Talents in Universities of Henan Province (Grant No. 20HASTIT028).References
- D. Bao, Q. Zhang, F.-L. Meng, H.-X. Zhong, M.-M. Shi, Y. Zhang, J.-M. Yan, Q. Jiang and X.-B. Zhang, Adv. Mater., 2017, 29, 1604799 CrossRef PubMed.
- J. W. Erisman, M. A. Sutton, J. Galloway, Z. Klimont and W. Winiwarter, Nat. Geosci., 2008, 1, 636–639 CrossRef CAS.
- S. L. Foster, S. I. P. Bakovic, R. D. Duda, S. Maheshwari, R. D. Milton, S. D. Minteer, M. J. Janik, J. N. Renner and L. F. Greenlee, Nat. Catal., 2018, 1, 490–500 CrossRef.
- B. H. R. Suryanto, H.-L. Du, D. Wang, J. Chen, A. N. Simonov and D. R. MacFarlane, Nat. Catal., 2019, 2, 290–296 CrossRef CAS.
- B. Ma, H. Zhao, T. Li, Q. Liu, Y. Luo, C. Li, S. Lu, A. M. Asiri, D. Ma and X. Sun, Nano Res., 2021, 14, 555–569 CrossRef CAS.
- Y. Ren, C. Yu, X. Tan, H. Huang, Q. Wei and J. Qiu, Energy Environ. Sci., 2021, 14, 1176–1193 RSC.
- Y. Wang, W. Zhou, R. Jia, Y. Yu and B. Zhang, Angew. Chem., Int. Ed., 2020, 59, 5350–5354 CrossRef CAS PubMed.
- J. Long, S. Chen, Y. Zhang, C. Guo, X. Fu, D. Deng and J. Xiao, Angew. Chem., Int. Ed., 2020, 59, 9711–9718 CrossRef CAS PubMed.
- J. G. Chen, R. M. Crooks, L. C. Seefeldt, K. L. Bren, R. M. Bullock, M. Y. Darensbourg, P. L. Holland, B. Hoffman, M. J. Janik, A. K. Jones, M. G. Kanatzidis, P. King, K. M. Lancaster, S. V. Lymar, P. Pfromm, W. F. Schneider and R. R. Schrock, Science, 2018, 360, eaar6611 CrossRef PubMed.
- Z. Wang, D. Richards and N. Singh, Catal. Sci. Technol., 2021, 11, 705–725 RSC.
- C. Yu, X. Huang, H. Chen, H. C. J. Godfray, J. S. Wright, J. W. Hall, P. Gong, S. Ni, S. Qiao, G. Huang, Y. Xiao, J. Zhang, Z. Feng, X. Ju, P. Ciais, N. C. Stenseth, D. O. Hessen, Z. Sun, L. Yu, W. Cai, H. Fu, X. Huang, C. Zhang, H. Liu and J. Taylor, Nature, 2019, 567, 516–520 CrossRef CAS PubMed.
- X. Zhang, Y. Wang, C. Liu, Y. Yu, S. Lu and B. Zhang, Chem. Eng. J., 2021, 403, 126269 CrossRef CAS.
- G.-F. Chen, Y. Yuan, H. Jiang, S.-Y. Ren, L.-X. Ding, L. Ma, T. Wu, J. Lu and H. Wang, Nat. Energy, 2020, 5, 605–613 CrossRef CAS.
- H. Xu, Y. Ma, J. Chen, W.-X. Zhang and J. Yang, Chem. Soc. Rev., 2022, 51, 2710–2758 RSC.
- J. Li, G. Zhan, J. Yang, F. Quan, C. Mao, Y. Liu, B. Wang, F. Lei, L. Li, A. W. M. Chan, L. Xu, Y. Shi, Y. Du, W. Hao, P. K. Wong, J. Wang, S.-X. Dou, L. Zhang and J. C. Yu, J. Am. Chem. Soc., 2020, 142, 7036–7046 CrossRef CAS PubMed.
- Q. Hu, Y. Qin, X. Wang, Z. Wang, X. Huang, H. Zheng, K. Gao, H. Yang, P. Zhang, M. Shao and C. He, Energy Environ. Sci., 2021, 14, 4989–4997 RSC.
- Y. Wang, A. Xu, Z. Wang, L. Huang, J. Li, F. Li, J. Wicks, M. Luo, D.-H. Nam, C.-S. Tan, Y. Ding, J. Wu, Y. Lum, C.-T. Dinh, D. Sinton, G. Zheng and E. H. Sargent, J. Am. Chem. Soc., 2020, 142, 5702–5708 CrossRef CAS PubMed.
- H. Yin, Z. Chen, S. Xiong, J. Chen, C. Wang, R. Wang, Y. Kuwahara, J. Luo, H. Yamashita, Y. Peng and J. Li, Chem. Catal., 2021, 1, 1088–1103 CrossRef.
- G. A. Cerrón-Calle, A. S. Fajardo, C. M. Sánchez-Sánchez and S. Garcia-Segura, Appl. Catal., B, 2022, 302, 120844 CrossRef.
- R. Jia, Y. Wang, C. Wang, Y. Ling, Y. Yu and B. Zhang, ACS Catal., 2020, 10, 3533–3540 CrossRef CAS.
- L. Wei, D.-J. Liu, B. A. Rosales, J. W. Evans and J. Vela, ACS Catal., 2020, 10, 3618–3628 CrossRef CAS.
- R. Daiyan, T. Tran-Phu, P. Kumar, K. Iputera, Z. Tong, J. Leverett, M. H. A. Khan, A. Asghar Esmailpour, A. Jalili, M. Lim, A. Tricoli, R.-S. Liu, X. Lu, E. Lovell and R. Amal, Energy Environ. Sci., 2021, 14, 3588–3598 RSC.
- J. Liang, H. Chen, T. Mou, L. Zhang, Y. Lin, L. Yue, Y. Luo, Q. Liu, N. Li, A. A. Alshehri, I. Shakir, P. O. Agboola, Y. Wang, B. Tang, D. Ma and X. Sun, J. Mater. Chem. A, 2022, 10, 6454–6462 RSC.
- P. Li, Z. Jin, Z. Fang and G. Yu, Energy Environ. Sci., 2021, 14, 3522–3531 RSC.
- Z.-Y. Wu, M. Karamad, X. Yong, Q. Huang, D. A. Cullen, P. Zhu, C. Xia, Q. Xiao, M. Shakouri, F.-Y. Chen, J. Y. Kim, Y. Xia, K. Heck, Y. Hu, M. S. Wong, Q. Li, I. Gates, S. Siahrostami and H. Wang, Nat. Commun., 2021, 12, 2870 CrossRef CAS PubMed.
- T. Zhu, Q. Chen, P. Liao, W. Duan, S. Liang, Z. Yan and C. Feng, Small, 2020, 16, 2004526 CrossRef CAS PubMed.
- J. Wu, J.-H. Li and Y.-X. Yu, J. Phys. Chem. Lett., 2021, 12, 3968–3975 CrossRef CAS PubMed.
- Y. Zhang, X. Chen, W. Wang, L. Yin and J. C. Crittenden, Appl. Catal., B, 2022, 310, 121346 CrossRef CAS.
- H. Niu, Z. Zhang, X. Wang, X. Wan, C. Shao and Y. Guo, Adv. Funct. Mater., 2021, 31, 2008533 CrossRef CAS.
- J. Wu, J.-H. Li and Y.-X. Yu, J. Phys. Chem. Lett., 2021, 12, 3968–3975 CrossRef CAS PubMed.
- L. Lv, Y. Shen, J. Liu, X. Meng, X. Gao, M. Zhou, Y. Zhang, D. Gong, Y. Zheng and Z. Zhou, J. Phys. Chem. Lett., 2021, 12, 11143–11150 CrossRef CAS PubMed.
- T. Hu, M. Wang, C. Guo and C. M. Li, J. Mater. Chem. A, 2022, 10, 8923–8931 RSC.
- L. Yang, S. Feng and W. Zhu, J. Phys. Chem. Lett., 2022, 13, 1726–1733 CrossRef CAS PubMed.
- P. Lv, D. Wu, B. He, X. Li, R. Zhu, G. Tang, Z. Lu, D. Ma and Y. Jia, J. Mater. Chem. A, 2022, 10, 9707–9716 RSC.
- Q. Zhang and J. Guan, Nano Res., 2022, 15, 38–70 CrossRef CAS.
- Y. Chen, S. Ji, C. Chen, Q. Peng, D. Wang and Y. Li, Joule, 2018, 2, 1242–1264 CrossRef CAS.
- H.-Y. Zhuo, X. Zhang, J.-X. Liang, Q. Yu, H. Xiao and J. Li, Chem. Rev., 2020, 120, 12315–12341 CrossRef CAS PubMed.
- X. Li, H. Rong, J. Zhang, D. Wang and Y. Li, Nano Res., 2020, 13, 1842–1855 CrossRef CAS.
- J. Zhang, H. Yang and B. Liu, Adv. Energy Mater., 2021, 11, 2002473 CrossRef CAS.
- G. Kresse and J. Furthmüller, Phys. Rev. B: Condens. Matter Mater. Phys., 1996, 54, 11169–11186 CrossRef CAS PubMed.
- P. E. Blöchl, Phys. Rev. B: Condens. Matter Mater. Phys., 1994, 50, 17953–17979 CrossRef PubMed.
- J. P. Perdew, J. A. Chevary, S. H. Vosko, K. A. Jackson, M. R. Pederson, D. J. Singh and C. Fiolhais, Phys. Rev. B: Condens. Matter Mater. Phys., 1992, 46, 6671–6687 CrossRef CAS PubMed.
- S. Grimme, J. Antony, S. Ehrlich and H. Krieg, J. Chem. Phys., 2010, 132, 154104 CrossRef PubMed.
- J. K. Nørskov, J. Rossmeisl, A. Logadottir, L. Lindqvist, J. R. Kitchin, T. Bligaard and H. Jónsson, J. Phys. Chem. B, 2004, 108, 17886–17892 CrossRef.
- https://webbook.nist.gov/chemistry/ .
- X. Guo, J. Gu, S. Lin, S. Zhang, Z. Chen and S. Huang, J. Am. Chem. Soc., 2020, 142, 5709–5721 CrossRef CAS PubMed.
- J.-X. Liu, D. Richards, N. Singh and B. R. Goldsmith, ACS Catal., 2019, 9, 7052–7064 CrossRef CAS.
- F. Calle-Vallejo, M. Huang, J. B. Henry, M. T. M. Koper and A. S. Bandarenka, Phys. Chem. Chem. Phys., 2013, 15, 3196–3202 RSC.
- K. Mathew, R. Sundararaman, K. Letchworth-Weaver, T. A. Arias and R. G. Hennig, J. Chem. Phys., 2014, 140, 084106 CrossRef PubMed.
- Y. Peng, B. Lu and S. Chen, Adv. Mater., 2018, 30, 1801995 CrossRef PubMed.
- C. Xia, Y. Qiu, Y. Xia, P. Zhu, G. King, X. Zhang, Z. Wu, J. Y. Kim, D. A. Cullen, D. Zheng, P. Li, M. Shakouri, E. Heredia, P. Cui, H. N. Alshareef, Y. Hu and H. Wang, Nat. Chem., 2021, 13, 887–894 CrossRef CAS PubMed.
- G. Henkelman, A. Arnaldsson and H. Jónsson, Comput. Mater. Sci., 2006, 36, 354–360 CrossRef.
- C. Ling, Y. Ouyang, Q. Li, X. Bai, X. Mao, A. Du and J. Wang, Small Methods, 2019, 3, 1800376 CrossRef.
- S. Garcia-Segura, M. Lanzarini-Lopes, K. Hristovski and P. Westerhoff, Appl. Catal., B, 2018, 236, 546–568 CrossRef CAS.
- S. Kattel, P. Atanassov and B. Kiefer, J. Phys. Chem. C, 2012, 116, 8161–8166 CrossRef CAS.
- X.-F. Li, Q.-K. Li, J. Cheng, L. Liu, Q. Yan, Y. Wu, X.-H. Zhang, Z.-Y. Wang, Q. Qiu and Y. Luo, J. Am. Chem. Soc., 2016, 138, 8706–8709 CrossRef CAS PubMed.
- D. Wu, B. He, Y. Wang, P. Lv, D. Ma and Y. Jia, J. Phys. D: Appl. Phys., 2022, 55, 203001 CrossRef.
- V. L. Deringer, A. L. Tchougréeff and R. Dronskowski, J. Phys. Chem. A, 2011, 115, 5461–5466 CrossRef CAS PubMed.
- A. J. Medford, A. Vojvodic, J. S. Hummelshøj, J. Voss, F. Abild-Pedersen, F. Studt, T. Bligaard, A. Nilsson and J. K. Nørskov, J. Catal., 2015, 328, 36–42 CrossRef CAS.
- J. Greeley, T. F. Jaramillo, J. Bonde, I. Chorkendorff and J. K. Nørskov, Nat. Mater., 2006, 5, 909–913 CrossRef CAS PubMed.
- A. Kulkarni, S. Siahrostami, A. Patel and J. K. Nørskov, Chem. Rev., 2018, 118, 2302–2312 CrossRef CAS PubMed.
- H. Li, C. Tsai, A. L. Koh, L. Cai, A. W. Contryman, A. H. Fragapane, J. Zhao, H. S. Han, H. C. Manoharan, F. Abild-Pedersen, J. K. Nørskov and X. Zheng, Nat. Mater., 2016, 15, 48–53 CrossRef CAS PubMed.
- B. Hammer, Y. Morikawa and J. K. Nørskov, Phys. Rev. Lett., 1996, 76, 2141–2144 CrossRef CAS PubMed.
- M. Mavrikakis, B. Hammer and J. K. Nørskov, Phys. Rev. Lett., 1998, 81, 2819–2822 CrossRef.
- V. Stamenkovic, B. S. Mun, K. J. J. Mayrhofer, P. N. Ross, N. M. Markovic, J. Rossmeisl, J. Greeley and J. K. Nørskov, Angew. Chem., Int. Ed., 2006, 45, 2897–2901 CrossRef CAS PubMed.
- J. K. Nørskov, F. Abild-Pedersen, F. Studt and T. Bligaard, Proc. Natl. Acad. Sci. U. S. A., 2011, 108, 937–943 CrossRef PubMed.
- H. Xu, D. Cheng, D. Cao and X. C. Zeng, Nat. Catal., 2018, 1, 339–348 CrossRef CAS.
- K. Jiang, S. Siahrostami, T. Zheng, Y. Hu, S. Hwang, E. Stavitski, Y. Peng, J. Dynes, M. Gangisetty, D. Su, K. Attenkofer and H. Wang, Energy Environ. Sci., 2018, 11, 893–903 RSC.
- P. H. van Langevelde, I. Katsounaros and M. T. M. Koper, Joule, 2021, 5, 290–294 CrossRef.
Footnote |
| † Electronic supplementary information (ESI) available. See DOI: https://doi.org/10.1039/d2nr02813a |
| This journal is © The Royal Society of Chemistry 2022 |

