 Open Access Article
Creative Commons Attribution 3.0 Unported Licence
Simultaneous determination of the mechanical properties and turgor of a single bacterial cell using atomic force microscopy†
Rui
Han
 a,
Waldemar
Vollmer
b,
John D.
Perry
c,
Paul
Stoodley
 de and
Jinju
Chen
 *a
*a
aSchool of Engineering, Newcastle University, Newcastle Upon Tyne, NE1 7RU, UK. E-mail: jinju.chen@ncl.ac.uk
bCentre for Bacterial Cell Biology, Biosciences Institute, Newcastle University, Richardson Road, Newcastle upon Tyne, NE2 4AX, UK
cMicrobiology Department, The Newcastle upon Tyne Hospitals NHS Foundation Trust, Newcastle upon Tyne, NE7 7DN, UK
dDepartment of Microbial Infection and Immunity and the Department of Orthopaedics, The Ohio State University, Columbus, OH 43210, USA
eNational Centre for Advanced Tribology at Southampton (nCATS), National Biofilm Innovation Centre (NBIC), Mechanical Engineering, University of Southampton, Southampton, S017 1BJ, UK
First published on 8th August 2022
Abstract
Bacterial mechanical properties (cell wall stiffness and turgor) are important factors for bacterial survival in harsh environments. For an individual bacterial cell, it is challenging to determine the cell wall stiffness and turgor simultaneously. In this study, we adopted a combined finite element modelling and mathematical modelling approach to simultaneously determine bacterial cell wall stiffness and turgor of an individual bacterial cell based on atomic force microscopy (AFM) nanoindentation. The mechanical properties and turgor of Staphylococcus epidermidis, determined by our method are consistent with other independent studies. For a given aqueous environment, bacterial cell wall stiffness increased linearly with an increase in turgor. Higher osmolarity leads to a decrease in both cell wall stiffness and turgor. We also demonstrated that the change of turgor is associated with a change in viscosity of the bacterial cell.
1. Introduction
Bacterial cells have a densely packed cytoplasm surrounded by a multi-layered cell envelope. The cytoplasmic membrane is encased by a peptidoglycan (PG) layer that protects the cell from bursting and maintains the shape of the cell.1–4 Gram-positive bacteria have a thick PG with attached secondary cell wall polymers such as teichoic acid and a high turgor of up to 20 atm.2,5 Gram-negative bacteria have a thin PG layer and an outer membrane, and their turgor is believed to be in the range of 2–3 atm.6Mechanical properties (i.e., stiffness and strength of the cell) affect major aspects of the bacterial lifestyle such as growth, cell division, motility, and adhesion.1,6–12 The mechanical properties depend on the thickness, geometry and architecture of the cell envelope13 and are affected by pH level, ionic strength and composition of the growth medium,9,14,15 temperature,16 and surrounding polymeric materials.17 Another major determinant for cell mechanics is the turgor that varies with the osmolality of the growth medium.18 Indeed, changes in osmolality have been shown to affect, for example, signal transduction systems, periplasmic transport processes, and the production of outer membrane proteins.18–21 However, bacteria adapt to different osmolality conditions and the turgor cannot be deduced from the growth medium with different osmolarity.22 Measurement of the turgor of bacterial cells is challenging and the following methods have been used to estimate the turgor.
Atomic force microscopy (AFM) techniques have been shown to be an effective approach to measure the mechanical properties of bacterial cells.3,13,23–30 The Young's modulus of various bacterial cells measured by AFM nanoindentation were in the range of 0.05–769 MPa depending on the type of bacterium, environmental conditions, and theoretical models.8 For example, Eaton et al.31 measured a higher elastic modulus for the rod-shaped model bacterium Escherichia coli than for the spherical bacterium Staphylococcus aureus using AFM in air-dried conditions, which may be caused by different cell wall architectures and geometry effects on the applicability of the Hertz contact model using a pyramidal probe. Another study by Cerf et al.16 showed that a higher temperature (45 °C) resulted in higher apparent cell modulus, presumably due to damage of the cell membrane. In these studies, the apparent cell modulus was determined using the Hertz or Sneddon model, which assume the bacterial cell to be a homogenous elastic solid.16,31
To take into account the turgor, Yao et al. proposed a simple tension dominated model for the deformation of the bacterial envelope.23 They developed a theoretical method for the determination of the turgor in spherical bacteria and the relationship between the indentation depth of the samples and turgor. Arnold et al. reported a theoretical model based on the indentation depth caused by the AFM tip and the cell wall deformation in the rod-shaped Magnetospirillum gryphiswaldense.32 To separate the contributions of the PG and turgor for the cell stiffness, Deng et al. used intact and bulging E. coli cells and these experiments provided evidence for power-law stress stiffening in the cell envelope.25 Very recently, using combined dimensional analysis and finite element method (FEM), Feng's research group derived a theoretical solution to correlate the stiffness of bacterial cells, obtained by AFM indentation tests, to the turgor and envelope elasticity for typical Gram-negative rod-shape bacterium (e.g., Klebsiella pneumoniae).29 However, most of these models have been developed for rod-shaped bacteria,25,29,32 and little work has been done to simultaneously determine the apparent modulus, cell wall stiffness, and the turgor for spherical bacteria.
In this study, we developed a method to simultaneously determine the mechanical properties of the cell wall and the turgor for a typical spherical bacterium, Staphylococcus epidermidis, using AFM indentation in different environments. We first determined the apparent cell modulus of S. epidermidis measured by nanoindentation tests using the modified Sneddon model, which takes the sample's shape and tip angle into account. We also obtained the cell wall stiffness of S. epidermidis using the modified shell model at a small deformation and verified the shell model by analyzing the effects of the sample's thickness and turgor. We estimated the turgor of S. epidermidis in different conditions by inverse analysis combined with finite element simulations. This study revealed the mechanical responses of S. epidermidis to different osmotic conditions. Furthermore, the novel method presented here is not just limited to bacterial cells, but can be adapted to measure the mechanical properties of other core–shell structures (e.g., microcapsules).
2. Materials and methods
2.1. Bacterial cell culture and sample preparation
S. epidermidis FH8 was isolated from a patient with chronic rhinosinusitis at the Freeman Hospital (Newcastle upon Tyne, UK).33S. epidermidis was stored in tryptic soy broth (TSB, Melford Laboratories Ltd, UK) with 20% (volume/volume) glycerol at −80 °C. Bacteria were cultured in TSB (30 mL) in a 50 mL tube and incubated overnight at 37 °C in a shaker at 180 rpm, and then diluted to OD600 ≈ 0.7 as measured with a Biochrom Libra S11 spectrophotometer (Biochrom Ltd, Cambridge, UK).Bacteria can be immobilized on a surface by physical adsorption, covalent binding, or attractive electrostatic interactions.34 In this study, we used gelatin from porcine skin (G6144, Sigma) to create a positively charged layer on pieces of mica. To this end, mica pieces (15 × 15 mm) were cleaned by sonication in acetone (99.5%), alcohol (95%), and deionised water for 10 min each. Gelatin coated slides were prepared by dissolving 0.5 g gelatin in 100 mL of DI water at 100 °C and then cooling down to 60–70 °C. Mica pieces were immersed in this solution and air dried overnight in a laminar flow bench. A bacterial suspension (20–30 μL) was pipetted onto each coated mica piece and spread with the pipette tip. After 10 min of incubation at room temperature, the surface was rinsed with DI water to remove weakly attached bacteria. The mica piece was fixed in a tissue-culture-treated polystyrene petri dish (μ-Dish, 50 mm with ibiTreat surface, Ibidi). Three different osmolarity environments for bacteria were considered, namely: DI water, phosphate-buffered saline (PBS), and 100 mM CaCl2 solution (Fig. 1).
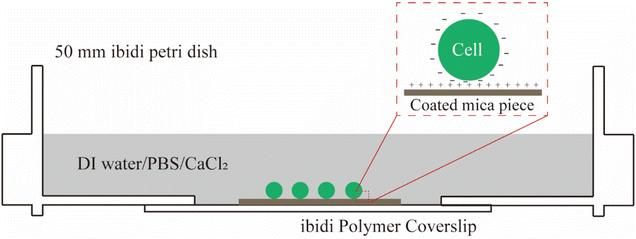 | ||
| Fig. 1 A schematic showing how bacterial cells were immobilised to coated mica in different osmotic conditions by electrostatic interaction prior to AFM measurements. | ||
2.2. AFM measurements
All AFM measurements were performed with a Flex-Bio AFM instrument (Nanosurf, Switzerland) mounted on an Axio Observer D1 inverted microscopy (Carl Zeiss, Jena, Germany). Monolithic silicon cantilevers ContAI-G were purchased from BudgetSensors (Innovative Solutions Bulgaria Ltd, Sofia, Bulgaria) which are coated with 30 nm aluminum reflective layer and have the nominal spring constant is 0.2 m N−1 with a tip radius of 10 nm. Calibration of the cantilevers using the thermal tune method29 found that their actual spring constants were in the range of 0.15–0.16 m N−1, which was used for calculating the force on cantilever at given deflection. Cantilevers were cleaned in a UV/ozone cleaner (BioForce Nanoscience, Inc.), and their deflection sensitivity was measured using a Gelatin-coated mica piece prior to measurements. Indentation tests were performed by positioning the tip at the center of an individual bacterium to avoid side-on interactions, and force measurements were performed at a loading rate of 2 μm s−1 at room temperature (21–22 °C). We measured 36 bacterial cells 3 times each, thereby obtaining 108 force-indentation depth curves for each testing condition. This approach provided enough data for statistical analysis and ensured that the results were not affected by experimental conditions such as the cantilever batch, noise caused by thermal vibrations of the cantilever, or other vibrations. AFM measurements were performed after samples were immersed for 2 hours and completed within 2 hours.292.3. Analytical models
When performing nanoindentation tests on engineering and biological materials, the Hertz (spherical probe) or Sneddon (conical/pyramidal probe) models have been widely used to obtain the materials Young's modulus.16,24,31,35 Both of these models are valid for homogenous, isotropic and elastic materials if tip-sample adhesion can be neglected.36 For the elastic contact between a conical/pyramidal tip and a flat surface, the force-indentation depth relation (F − h) is given by the Sneddon model,37 | (1) |
However, the Sneddon model cannot be used when indenting a spherical sample with a pyramidal or conical probe, as this can lead to ∼20% underestimation of the maximum force at a relative deformation of 10% for a sample with a Poisson's ratio of 0.49.38 Therefore, we have developed an extended Sneddon model based on dimensionless analysis and finite element modeling. For simplification, this new model adopts a quadratic polynomial equation for the empirical function f (h/D, α), where the coefficients can be correlated to the tip angle as described in eqn (2)–(6).38
 | (2) |
 | (3) |
| a = 39.657α + 0.101 | (4) |
| b = −2.767α − 2.614 | (5) |
| c = −0.416α + 1.710 | (6) |
A single spherical bacterium can be modelled as a shell structure with turgor in which the cell wall is thought to be thin, homogeneous, and isotropic.25 The shell deformation includes either an in-plane stretching and shear, or out-of-plane bending.39 For a shell structure with a ratio between shell thickness and radius smaller than 1/10,40 the thin shell theory can be used to investigate the mechanical deformation of the spherical shell structure at a small deformation.41 When a spherical shell with zero internal pressure is subjected to a concentrated load, the following Reissner's model can be applied,42,43
 | (7) |
2.4. Finite element modelling
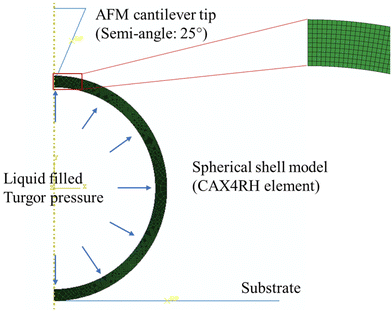
A finite element model (FEM), using ABAQUS/Standard 6.18, was developed to study the effects of the cell wall thickness and turgor on the mechanical behavior of spherical bacteria. To improve computational efficiency, we developed a two-dimensional (2D) axisymmetric numerical model, and a representative FE model as shown in Fig. 2. In this model, the sample is bonded to the rigid plate and the conical tip with a semi-included angle of 25° is assumed rigid since it is far stiffer than the samples.38 The tip radius is 10 nm, the same to AFM probe. A frictionless contact between the indenter and cell is used as friction effects on the measured mechanical properties are not significant.38,44 The diameter of the spherical shell sample is 1 μm based on the average diameter of S. epidermidis cell of 0.5–1.5 μm.45 FE models with different cell wall thicknesses were compared and these showed that the S. epidermidis cells measured had a wall thickness in the range 20–40 nm.46 Our models were assumed to be linear elastic with a Young's modulus and Poisson's ratio of 2 MPa and 0.49, respectively. CAX4RH element (a 4-node bilinear axisymmetric quadrilateral, hybrid, constant pressure, reduced integration, hourglass control) is adopted in these models. Displacement control is used. In this study, we focused on modelling biological cells, therefore, for most of the simulations, we fixed the Poisson's ratio to 0.49.29 Furthermore, we used a‘fluid cavity’ module to simulate the inner fluid and turgor, and a hydraulic fluid model was used to simulate incompressible fluid behavior in Abaqus/Standard.473. Results and discussion
3.1. Apparent cell modulus of S. epidermidis based on the contact model
We indented individual bacterial cell at a displacement of up to 100 nm in DI water, PBS, and 100 mM CaCl2 solution.9 The effect of the Derjaguin–Landau–Verwey–Overbeek (DVLO) interaction at the nonlinear segment is negligible because the Debye length of the solutions were ∼0.7 nm.48,49 Within the duration of AFM measurements, we did not observe any reduction in bacterial viability; live/dead bacteria assays (see Fig. S1c†) indicated that cells remained alive in DI water, PBS and CaCl2 solutions. S. epidermidis, a Gram positive bacterium was found to have a much thicker cell wall as compared to Gram negative bacteria, and are thus more tolerant of osmotic shock. Usually, bottom effects (i.e., the underlying rigid substrate effect) need to be considered when indenting well-spread cells at relatively large penetrations.50,51 When it comes to indenting a spherical bacterium using a pyramidal probe at a relatively deep penetration, both the bottom effect and geometry effect (finite width) need to be considered. Our previous work has demonstrated that the Sneddon model significantly overestimates the indentation force when using a spherical sample and a pyramidal or conical indenter.38 Therefore, we applied a modified Sneddon model (eqn (2)–(6)) that takes into account both the bottom effect and geometry effect, which depends on the size of the bacteria, indenter angle, and indentation depth. Fig. 3a shows an example of the force–displacement curve fitted with the modified Sneddon model for bacteria in PBS. Fig. 3b provides a comparison of the apparent modulus of S. epidermidis cells submerged in DI Water, PBS, and CaCl2 solutions. The apparent modulus results from the averaged effect of the bacterial cell wall stiffness and turgor. In all calculations, a Poisson's ratio of 0.49 was used, which is common for biological samples.29 It is evident that the apparent cell modulus decreases with an increase in osmolarity (100 mM CaCl2 ≈ PBS > DI water, in terms of osmolarity52); the apparent moduli of S. epidermidis cells in 100 mM CaCl2 and PBS are about 45% and 22% softer than in DI water, respectively. This finding agrees with another study, which showed that an increase in E. coli's apparent modulus occurred when decreasing the osmolarity of KNO3 solution.53 This may be attributed to osmolality altered bacterial turgor through exo-osmotic water release,53 which is also the case in this study. It may also be attributed to the possible change of bacterial cell wall stiffness. In the following sections, we will discuss how to decouple the effect of the bacterial cell wall stiffness and turgor on the apparent bacterial modulus.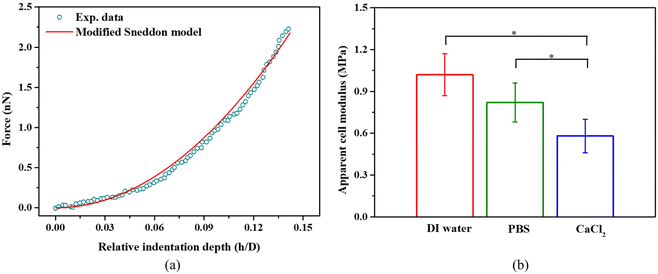 | ||
| Fig. 3 (a) A representative example of a force-relative indentation curve for AFM indentation on S. epidermidis in PBS. All measurements were performed at a loading rate of 2 μm s−1 at room temperature (21–22 °C). The modified Sneddon model agrees well with the experimental data (R-square >0.99). (b) The apparent cell modulus determined by eqn (2)–(6) for S. epidermidis in DI water, PBS, or 100 mM CaCl2, *p < 0.05, n = 108. | ||
3.2. Cell wall stiffness of S. epidermidis based on the shell model
A single bacterium is a shell structure with turgor. If the shell thickness is less than 5% of the diameter, the shell material is homogeneous and isotropic linear elastic, and the effect of turgor on the mechanical response is negligible at a small deformation (as shown in Fig. 4), the Reissner's model can be used to predict small deformations of the spherical shell under a point-concentrated load (see Fig. 4). For a wide range of typical probe angles (50–140°), when the relative indentation depth (h/D) is below 10, there is little effect of tip angles on the measured force for cell wall thickness below 40 nm (see Fig. S2(a)–(c)†). In this case, the shell thickness/diameter effect is below 10%. Therefore, a point loading assumption is reasonable at very small penetrations. While small indentations can be modelled, the Reissner model can underestimate shell deformation at large deformation where the shell buckles (see black scatter in Fig. 4). In principle, we could use Reissner's model to determine the bacterial cell wall stiffness before buckle occurs; however, the ratio of the sample diameter to its thickness is an important parameter in the mechanical response. For smaller bacterial cells, the shell thickness can exceed 5% of the cell diameter as seen in our measurement of cell size based on SEM images (see Fig. S1†). Furthermore, when indenting small bacteria using a pyramidal indenter, the indentation region is more like a pyramid, and the effective contact radius at a small deformation (e.g., 5% relative deformation) is 16.3 nm, which is not much below the size of the cell (larger than 5% of sample size). In this case, the point load assumption is no longer valid.54 Therefore, it would be useful to further improve Reissner's model by taking these two factors into consideration.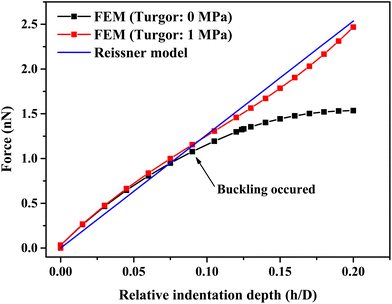 | ||
| Fig. 4 A comparison of force-relative indentation depth curves of hollow/liquid-filled spherical shell structures with or without turgor and fitted by the Reissner model (eqn (7)). Parameters were obtained by simulation results and FE modeling for indentation test on a spherical shell structure with a diameter of 1 μm, a thickness of 30 nm, with or without a turgor of 1 MPa. | ||
Based on FE models with six different cell wall thicknesses (where shell thickness t/diameter D ratio is 2%–7%), and six different tip angles (see Fig. S2(a)–(f)†), we introduced the following modified Reissner's model to account for large thickness effect (see Fig. S2g†),
 | (8) |
When the t/D is 2%, a is almost independent on the tip angle even at relative indentation depth of 10% (see Fig. S2a†). With the increase of t/D, a starts to show dependence on the tip angle (see Fig. S2(b)–(f)†), particularly when t/D reaches 7%.
For the AFM probe with semi-included tip angle of 25° used in this study, a is given by,
 | (9) |
SEM measurements have shown that the cell wall thickness of S. epidermidis is 30 nm.55 So, the FE simulations using cell wall thickness of 30 nm were compared against the experimental measurements. Fig. 5a shows a representative force-relative indentation curve of a single S. epidermidis in PBS and the corresponding curve fitting using the modified shell model at small deformation. We found the original Reissner's model can lead to up to 30% underestimation of bacterial cell wall stiffness at the relative indentation depth of 10% (data not shown). As shown in Fig. 5b, the bacterial cell wall in PBS and 100 mM CaCl2 appears to be about 50% softer than that in DI water. For isolated bacterial cell walls, salts may cause dissociation of wall carboxyl groups.56 If this occurs for intact bacterial cell walls, then it could contribute to the decrease in cell wall stiffness in PBS or 100 mM CaCl2.
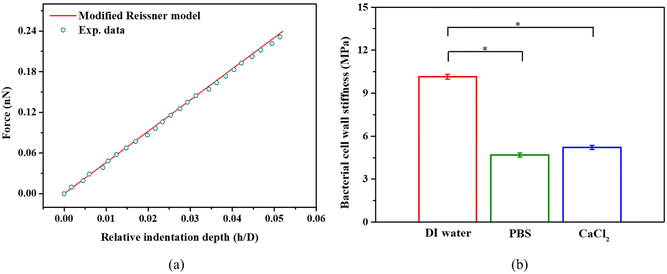 | ||
| Fig. 5 (a) Representative force-relative indentation depth curves obtained by experimental measurement of S. epidermidis bacteria in PBS, and determined by the modified Reissner model (eqn (8) and (9), R-square >0.98). (b) S. epidermidis cell wall stiffness in DI water, PBS, and 100 mM CaCl2, *p < 0.05, n = 108. | ||
3.3. Turgor of S. epidermidis through FE modeling
We next used the inverse analysis combined with the finite element method to determine the turgor which is similar to our previous works for engineering materials.44 Both the turgor and the cell wall stiffness obtained in section 3.2 are important input parameters in the FE models. We performed iterative simulations to vary the turgor until the predicted force displacement curves matched the experimental measurements when the error function Φ meets the following criteria.44| Φ(X) = ∥FSimu(X) − FExp∥/∥FExp∥ | (10) |
| |Φ(Xi) − Φ(Xi+1)| ≤ 1.0 × 10⁻⁴ | (11) |
Here, FSimu is the calculated value, FExp is the experimental data, and X the parameter to be optimised. ∥·∥ indicates the second-norm operator.
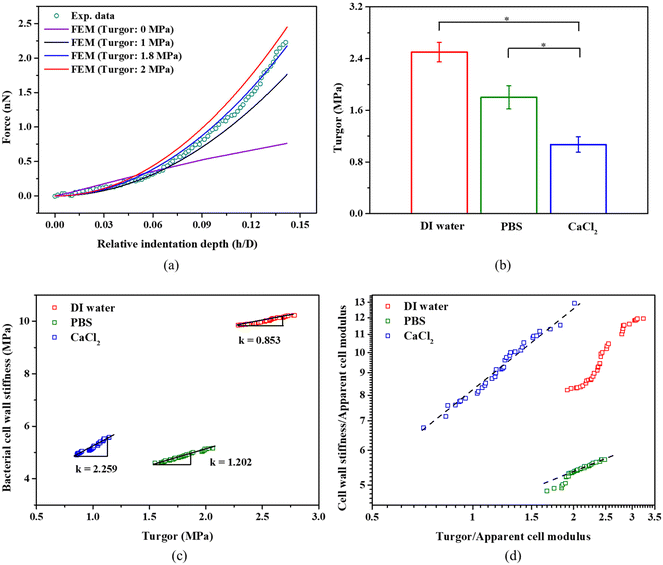
Fig. 6a presents selected examples of simulated force-relative indentation curves with different turgor and the experimental measurement for bacteria in PBS. When the error function meets the criteria defined above, it gives a turgor of 2.5 ± 0.15 MPa, 1.80 ± 0.23 MPa, 1.1 ± 0.17 MPa for bacteria in DI water, PBS, and 100 mM CaCl2, respectively. As seen in Fig. 6b, there is significant difference in the turgor of bacteria present in the three different solutions. In general, the turgor for S. epidermidis in PBS is consistent with other studies that determined a turgor of about 2 MPa for the Gram-positive bacterium like Staphylococcus aureus.25,27Fig. 6c shows a strong correlation between turgor and the cell wall stiffness of S. epidermidis in DI water, PBS, and CaCl2 solution, respectively. The ratio of cell wall stiffness and turgor (Slope k) is about 0.85, 1.20 and 2.26 for S. epidermidis in DI water, PBS, and CaCl2 solution, respectively. This may suggest that the cell wall stiffness and turgor of S. epidermidis exhibit more sensitivity to medium with a strong ionic concentration.52,57
The osmolality of PBS (280–315 mOsm kg−1) and 100 mM CaCl2 (300 mOsm kg−1)29 is almost similar; however, they cause significant differences in turgor while causing similar cell wall stiffness as shown in Fig. 5b and 6b. 100 mM CaCl2 has lower pH (pH = 5.0) than PBS (pH = 7.4), and Ca2+ ions contribute to the maintenance of the structure and the integrity of the cell wall14,58 Therefore, despite 60% drop in turgor for bacteria in 100 mM CaCl2, the cell wall stiffness does not decrease that much. For PBS, K+ ions play an active role in the recovery of the turgor,5 which may contribute to higher turgor for bacteria in PBS compared to 100 mM CaCl2. At given aqueous environment, its cell wall stiffness increases linearly with the increase of the turgor, as shown in Fig. 6c. In the computational simulations for the Gram-negative bacterium, Feng's group had predicted a linear relationship at log–log plot for the normalized cell wall stiffness and normalized turgor.29 In our plot in Fig. 6d, there is a similar linear relationship for S. epidermidis in 100 mM CaCl2 and partially for S. epidermidis in PBS at higher turgor. However, there is no such a linear relationship for S. epidermidis in DI water at log–log plot.
3.4. Viscous characteristics of S. epidermidis in different conditions
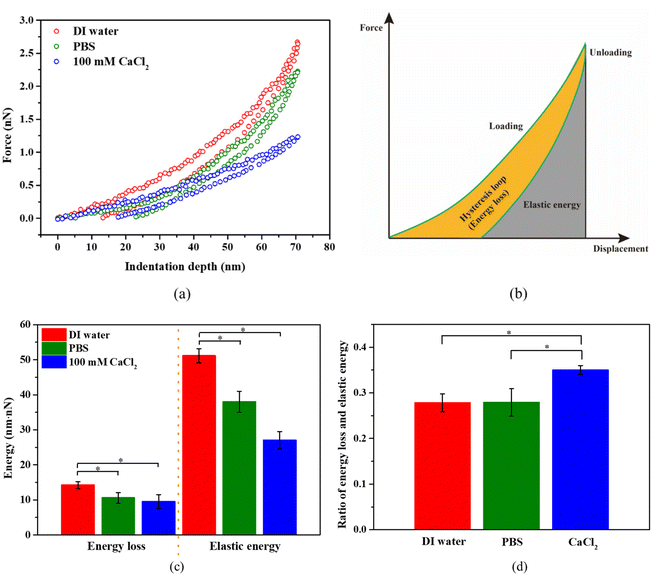
For bacterial mechanics, we also expect some viscoelastic characteristics due to the combination of the polymeric nature of the bacterial cell wall and cytoplasm. As expected, we did observe a hysteresis in the force–distance curves due to the viscoelastic characteristics of bacteria (see Fig. 7a). It should be noted that during unloading, the displacement did not return to zero, even if the force reached zero. This may be due to the irreversible polymer structure arrangement in cytoplasm, as the peptidoglycan (PG) structure in the bacterial cell wall can recover its structure after removal of a load.59 The area of hysteresis loop represents the energy loss, and the area under the unloading curve represents the elastic work (see Fig. 7b).Numerical integration of the force–displacement curves allows us to determine both energy loss and the elastic energy, which are presented in Fig. 7c. Both energy loss and elastic energy during AFM indentation are highest for bacteria in DI water, followed by PBS, and then by 100 mM CaCl2. It is the same case for the total work (the sum of energy loss and elastic energy) during the indentation of bacteria in these three solutions. The energy loss, elastic energy, and total work is proportional to the viscous modulus, elastic modulus, and the apparent modulus at a given indentation depth, respectively. This suggests that the apparent moduli for bacteria in those three solutions should also follow the same order. This agrees with our results in Fig. 3b. This also suggests that the change of turgor is associated with change in viscous modulus. On the other hand, the ratio of energy loss over the elastic energy is proportional to the ratio of viscous modulus over elastic modulus. If such a ratio is below 1, then it is more solid-like. For S. epidermidis tested here, this ratio is about 0.27 in DI water and PBS, and about 0.35 in 100 mM CaCl2 solution (see Fig. 7d). In this case, S. epidermidis exhibit stronger solid-like characteristics in DI water and PBS than in CaCl2 solution, which is possibly associated with big change in turgor.
It is difficult to de-couple the viscous effect arising from the bacterial cell wall and cytoplasm. Therefore, we did not consider it in the current modelling. In the future, it will be interesting to develop robust modelling approaches to determine the viscoelastic properties of bacterial cell wall and cytoplasm.
4. Conclusions
In summary, we presented a combined modelling and experimental approach to enable simultaneous determination of the apparent cell modulus, cell wall stiffness, and turgor of the individual live bacteria under different environments based on AFM indentation measurements. The standard Sneddon model is not valid when indenting a spherical bacterium with a pyramid indenter due to cell curvature, which can cause significant overestimation of the apparent bacterial modulus depending on two key factors: the relative indentation depth to bacteria size and tip angle. These two factors were, therefore, taken into consideration in our modified Sneddon model. We also presented an extended Reissner's model for a shell with varied thickness/diameter ratios and tip angles, which can be used to determine the cell wall stiffness of a typical spherical bacterium (e.g., S. epidermidis). Furthermore, we employed an inverse finite element analysis to determine the turgor of S. epidermidis and found that the cell wall stiffness for individual cells correlated well with the turgor. We have also demonstrated that higher osmolarity reduce the apparent bacterial modulus by decreasing both cell wall stiffness and turgor. By analysing the energy loss and elastic energy during indentation tests, we have also discovered that the change in turgor is associated with a change in the viscosity of the cell. Our methodology can be adapted to other bacteria with different shapes by adjusting cell shape parameters in the equations. The approach presented here can also be adapted to study how bacterial mechanics contribute to survival in harsh environments such as growth in the presence of antibiotics or within a host.Author contributions
All authors contributed to this work. The study was conceived by J. C., R. H., W. V., P. S. and J. P. designed the research. R. H. performed the experiments and numerical simulations. R. H. and J. C. did data analysis. R. H., J. C. and W. V. prepared the original draft. All authors reviewed and edited the manuscript. All authors have given approval to the final version of the manuscript.Conflicts of interest
The authors declare no competing interests.Acknowledgements
J. Chen acknowledges funding from the Engineering and Physical Sciences Research Council (EP/R025606/1; EP/V049615/1). W. Vollmer was supported by the UKRI Strategic Priorities Fund (https://www.ukri.org) EP/T002778/1. R. Han acknowledges the PhD scholarship from Chinese Scholarship Council and Newcastle University. Prof. NS Jakubovic is acknowledged for providing the bacteria used for this study. We thank Ross Laws, Tracey Davey and Yufeng Zhu for their support on SEM imaging. We also acknowledge Prof. Glen McHale and Mr Jack Dawson for careful proofreading.References
- L. Furchtgott, N. S. Wingreen and K. C. Huang, Mol. Microbiol., 2011, 81, 340–353 CrossRef CAS PubMed.
- R. J. Doyle and R. E. Marquis, Trends Microbiol., 1994, 2, 57–60 CrossRef CAS PubMed.
- G. Misra, E. R. Rojas, A. Gopinathan and K. C. Huang, Biophys. J., 2013, 104, 2342–2352 CrossRef CAS PubMed.
- G. K. Auer and D. B. Weibel, Biochemistry, 2017, 56, 3710–3724 CrossRef CAS PubMed.
- A. M. Whatmore and R. H. Reed, J. Gen. Microbiol., 1990, 136, 2521–2526 CrossRef CAS PubMed.
- E. R. Rojas and K. C. Huang, Curr. Opin. Microbiol., 2018, 42, 62–70 CrossRef CAS PubMed.
- J. V. Holtje, Microbiol. Mol. Biol. Rev., 1998, 62, 181–203 CrossRef CAS PubMed.
- H. H. Tuson, G. K. Auer, L. D. Renner, M. Hasebe, C. Tropini, M. Salick, W. C. Crone, A. Gopinathan, K. C. Huang and D. B. Weibel, Mol. Microbiol., 2012, 84, 874–891 CrossRef CAS PubMed.
- S. Zheng, M. Bawazir, A. Dhall, H.-E. Kim, L. He, J. Heo and G. Hwang, Front. Bioeng. Biotechnol., 2021, 9, 1–22 Search PubMed.
- H. Straub, C. M. Bigger, J. Valentin, D. Abt, X. H. Qin, L. Eberl, K. Maniura-Weber and Q. Ren, Adv. Healthc. Mater., 2019, 8, 1–8 CrossRef.
- F. Pan, S. Altenried, M. D. Liu, D. Hegemann, E. Bulbul, J. Moeller, W. W. Schmahl, K. Maniura-Weber and Q. Ren, Mater. Horiz., 2020, 7, 93–103 RSC.
- S. J. Yunyi Cao, X. Tan, L. Bowen, Y. Zhu, J. Dawson, R. Han, J. Exton, H. Liu, G. McHale, N. Jakubovics and J. Chen, Langmuir, 2020, 36(45), 13396–13407 CrossRef PubMed.
- L. Pasquina-Lemonche, J. Burns, R. D. Turner, S. Kumar, R. Tank, N. Mullin, J. S. Wilson, B. Chakrabarti, P. A. Bullough, S. J. Foster and J. K. Hobbs, Nature, 2020, 582, 294–297 CrossRef CAS PubMed.
- F. Gaboriaud, S. Bailet, E. Dague and F. Jorand, J. Bacteriol., 2005, 187, 3864–3868 CrossRef CAS PubMed.
- C. B. Volle, M. A. Ferguson, K. E. Aidala, E. M. Spain and M. E. Nunez, Langmuir, 2008, 24, 8102–8110 CrossRef CAS PubMed.
- A. Cerf, J. C. Cau, C. Vieu and E. Dague, Langmuir, 2009, 25, 5731–5736 CrossRef CAS PubMed.
- N. Kandemir, W. Vollmer, N. S. Jakubovics and J. Chen, Sci. Rep., 2018, 8, 10893 CrossRef PubMed.
- L. N. Csonka, Microbiol. Rev., 1989, 53, 121–147 CrossRef CAS PubMed.
- T. Erdos, G. S. Butler-Browne and L. Rappaport, Biochimie, 1991, 73, 1219–1231 CrossRef CAS PubMed.
- M. O. Walderhaug, J. W. Polarek, P. Voelkner, J. M. Daniel, J. E. Hesse, K. Altendorf and W. Epstein, J. Bacteriol., 1992, 174, 2152–2159 CrossRef CAS PubMed.
- S. E. Meyer, S. Granett, J. U. Jung and M. R. Villarejo, J. Bacteriol., 1990, 172, 5501–5502 CrossRef CAS PubMed.
- A. L. Koch and M. F. Pinette, J. Bacteriol., 1987, 169, 3654–3663 CrossRef CAS PubMed.
- X. Yao, J. Walter, S. Burke, S. Stewart, M. H. Jericho, D. Pink, R. Hunter and T. J. Beveridge, Colloids Surf., B, 2002, 23, 213–230 CrossRef CAS.
- G. Francius, O. Domenech, M. P. Mingeot-Leclercq and Y. F. Dufrene, J. Bacteriol., 2008, 190, 7904–7909 CrossRef CAS PubMed.
- Y. Deng, M. Z. Sun and J. W. Shaevitz, Phys. Rev. Lett., 2011, 107, 1–4 Search PubMed.
- S. W. W. Chen, M. Odorico, M. Meillan, L. Vellutini, J. M. Teulon, P. Parot, B. Bennetau and J. L. Pellequer, Nanoscale, 2013, 5, 10877–10886 RSC.
- R. G. Bailey, R. D. Turner, N. Mullin, N. Clarke, S. J. Foster and J. K. Hobbs, Biophys. J., 2014, 107, 2538–2545 CrossRef CAS PubMed.
- M. Zou, W. Tao, X. Ye and D. Liu, Food Sci. Nutr., 2020, 8, 139–149 CrossRef CAS PubMed.
- H. X. Zhang, H. B. Wang, J. J. Wilksch, R. A. Strugnell, M. L. Gee and X. Q. Feng, Soft Matter, 2021, 17, 2042–2049 RSC.
- M. Luo, W. Yang, T. N. Cartwright, J. M. G. Higgins and J. Chen, Langmuir, 2022, 38, 620–628 CrossRef CAS PubMed.
- P. Eaton, J. C. Fernandes, E. Pereira, M. E. Pintado and F. X. Malcata, Ultramicroscopy, 2008, 108, 1128–1134 CrossRef CAS PubMed.
- M. Arnoldi, M. Fritz, E. Bauerlein, M. Radmacher, E. Sackmann and A. Boulbitch, Phys. Rev. E: Stat. Phys., Plasmas, Fluids, Relat. Interdiscip. Top., 2000, 62, 1034–1044 CrossRef CAS PubMed.
- R. C. Shields, N. Mokhtar, M. Ford, M. J. Hall, J. G. Burgess, M. R. ElBadawey and N. S. Jakubovics, PLoS One, 2013, 8, 1–13 CrossRef PubMed.
- R. L. Meyer, X. F. Zhou, L. N. Tang, A. Arpanaei, P. Kingshott and F. Besenbacher, Ultramicroscopy, 2010, 110, 1349–1357 CrossRef PubMed.
- M. W. Christopher, C. Perry, T. Beale and A. Randriamahefa, J. Sci. Food Agric., 2009, 89, 958–964 CrossRef.
- K. L. Johnson, Contact Mechanics, Cambridge University Press, 1985 Search PubMed.
- J. J. Chen, Interface Focus, 2014, 4, 1–16 CrossRef PubMed.
- R. Han and J. J. Chen, J. Mater. Res., 2021, 36, 1762–1771 CrossRef CAS.
- S. W.-K. S. Timoshenko, Theory of plates and shells, McGraw-Hill, New York, 1959 Search PubMed.
- N. Elsner, F. Dubreuil, R. Weinkamer, M. Wasicek, F. D. Fischer and A. Fery, Prog. Colloid Polym. Sci., 2006, 132, 117–123 CAS.
- R. Han, X. F. Wang, G. M. Zhu, N. X. Han and F. Xing, Polym. Test., 2019, 80, 1–11 Search PubMed.
- E. Reissner, J. Math. Phys., 1946, 25, 80–85 CrossRef.
- E. Reissner, J. Math. Phys., 1946, 25, 279–300 CrossRef.
- X. F. Wang, R. Han, J. Tao, T. L. Han, G. M. Zhu, J. N. Tang, N. X. Han and F. Xing, Composites, Part B, 2019, 158, 249–258 CrossRef CAS.
- A. Tripathy, P. Sen, B. Su and W. H. Briscoe, Adv. Colloid Interface Sci., 2017, 248, 85–104 CrossRef CAS PubMed.
- L. G. Harris, S. J. Foster and R. G. Richards, Eur. Cells Mater., 2002, 4, 39–60 CrossRef CAS PubMed.
- M. Smith, ABAQUS/Standard User's Manual, Version 6.14, Dassault Systèmes Simulia Corp, United States, 2014 Search PubMed.
- C. H. Chu, I. Sarangadharan, A. Regmi, Y. W. Chen, C. P. Hsu, W. H. Chang, G. Y. Lee, J. I. Chyi, C. C. Chen, S. C. Shiesh, G. B. Lee and Y. L. Wang, Sci. Rep., 2017, 7, 5256 CrossRef PubMed.
- T. H. Anderson, S. H. Donaldson, H. B. Zeng and J. N. Israelachvili, Langmuir, 2010, 26, 14458–14465 CrossRef CAS PubMed.
- N. Gavara and R. S. Chadwick, Nat. Nanotechnol., 2012, 7, 733–736 CrossRef CAS PubMed.
- P. D. Garcia and R. Garcia, Biophys. J., 2018, 114, 2923–2932 CrossRef CAS PubMed.
- D. Szatmari, P. Sarkany, B. Kocsis, T. Nagy, A. Miseta, S. Barko, B. Longauer, R. C. Robinson and M. Nyitrai, Sci. Rep., 2020, 10, 12002 CrossRef CAS PubMed.
- G. Francius, P. Polyakov, J. Merlin, Y. Abe, J. M. Ghigo, C. Merlin, C. Beloin and J. F. L. Duval, PLoS One, 2011, 6, 1–18 CrossRef.
- A. Nasto, A. Ajdari, A. Lazarus, A. Vaziri and P. M. Reis, Soft Matter, 2013, 9, 6796–6803 RSC.
- L. A. Onyango, R. H. Dunstan, J. Gottfries, C. von Eiff and T. K. Roberts, PLoS One, 2012, 7, e29031–e29031 CrossRef CAS PubMed.
- R. E. Marquis, J. Bacteriol., 1968, 95, 775–781 CrossRef CAS PubMed.
- R. S. Dover, A. Bitler, E. Shimoni, P. Trieu-Cuot and Y. Shai, Nat. Commun., 2015, 6, 7193 CrossRef PubMed.
- R. J. Smith, in Advances in Microbial Physiology, ed. R. K. Poole, Academic Press, 1995, vol. 37, pp. 83–133 Search PubMed.
- N. E. Dowling, Mechanical behavior of materials: engineering methods for deformation, fracture, and fatigue, Prentice Hall, Englewood Cliffs, N.J., 1993 Search PubMed.
Footnote |
| † Electronic supplementary information (ESI) available. See DOI: https://doi.org/10.1039/d2nr02577a |
| This journal is © The Royal Society of Chemistry 2022 |

