
 Open Access Article
 This Open Access Article is licensed under a
 Creative Commons Attribution 3.0 Unported Licence
1H NMR global diatropicity in copper hydride complexes†
Omar
López-Estrada
 ab,
Jorge L.
Torres-Moreno
b,
Bernardo
Zuniga-Gutierrez
c,
Patrizia
Calaminici
b,
Sami
Malola
a,
Andreas M.
Köster
b and
Hannu
Häkkinen
*ad
ab,
Jorge L.
Torres-Moreno
b,
Bernardo
Zuniga-Gutierrez
c,
Patrizia
Calaminici
b,
Sami
Malola
a,
Andreas M.
Köster
b and
Hannu
Häkkinen
*ad
aDepartment of Physics, Nanoscience Center, University of Jyväskylä, FI-40014 Jyväskylä, Finland
bDepartamento de Química, Cinvestav, Av. Instituto Politécnico Nacional, 2508, A.P. 14740, Ciudad de México 07000, Mexico
cDepartamento de Química, Universidad de Guadalajara, CUCEI, Blvd. Marcelino García Barragán 1421, C. P. 44430 Guadalajara, Jalisco, Mexico
dDepartment of Chemistry, Nanoscience Center, University of Jyväskylä, FI-40014 Jyväskylä, Finland. E-mail: hannu.j.hakkinen@jyu.fi
First published on 5th August 2022
Abstract
Understanding the magnetic response of electrons in nanoclusters is essential to interpret their NMR spectra thereby providing guidelines for their synthesis towards various target applications. Here, we consider two copper hydride clusters that have applications in hydrogen storage and release under standard temperature and pressure. Through Born–Oppenheimer molecular dynamics simulations, we study dynamics effects and their contributions to the NMR peaks. Finally, we examine the electrons’ magnetic response to an applied external magnetic field using the gauge-including magnetically induced currents theory. Local diatropic currents are generated in both clusters but an interesting global diatropic current also appears. This diatropic current has contributions from three μ3-H hydrides and six Cu atoms that form a chain together with three S atoms from the closest ligands resulting in a higher shielding of these hydrides’ 1H NMR response. This explains the unusual upfield chemical shift compared to the common downfield shift in similarly coordinated hydrides both observed in previous experimental reports.
1. Introduction
Since the discovery of Stryker's reagent, [HCu-PPh3]6,1 now widely employed to regioselectively hydrogenate αβ-unsaturated carbonyl compounds, several copper hydrides complexes have been synthesized.2–28 The broad variety of applications for these complexes include23,24,29–31 hydrogen storage,5,32–36 catalysis,28,32,37–45 energy storage,38,32 and energy conversion,32,46 to give but a few examples. Within this family of compounds, several coordination modes have been observed for Cu–H hydrides such as adopting a bridge position, face-capping or interstitial positions to help to stabilize the cluster.24,47 Determining the hydrides’ positions has been a fundamental part of the structural characterization necessary to tailor the potential targeted applications of these complexes. The standard X-ray diffraction technique is used to determine the overall structure involving the heavy atoms but it fails to locate hydrides and hydrogen atoms in general due to the low electron density around the nuclei. More sophisticated techniques such as single crystal neutron diffraction are therefore often used to correctly assign the coordination modes for these challenging copper hydrides.8,47 Recently, due to the lack of neutron diffraction evidence, deep learning approaches have been employed to determine the location of hydrides.48,49 As a result, experimental methods that can be performed in solution to help identify the chemical environment around the hydrides, such as nuclear magnetic resonance (NMR), become fundamental in determining the hydrides’ positions.Indeed, NMR spectroscopy has been widely used to non-destructively characterize the reaction state, dynamic phenomena and the chemical environment around the constituent atoms of molecules, macromolecules, nanoparticles, proteins, etc.50 Furthermore, calculations of magnetic properties and their response towards perturbations from an applied external magnetic field have become routine.51 An applied external magnetic field, B, generates a response from the electrons in the system studied which is observed as a current composed of both diamagnetic and paramagnetic contributions in a plane perpendicular to B. This induced current flows in two directions relative to the external magnetic field: in a classical direction, that is clockwise or diatropic, and in a nonclassical direction, that is anticlockwise or paratropic (with directions determined by the right-hand screw rule). The strength of this current can then be related to the shielding/deshielding of the nuclei due to the magnetic field generated by these currents.
In the present work, we elucidate the nature of an unusual chemical shift observed in μn-H (n = 3–5) coordinated hydrides in Cu20H11(S2PH2)9![[thin space (1/6-em)]](https://www.rsc.org/images/entities/char_2009.gif) 33 and Cu32H20(S2PH2)1252 complexes. The μ3-H is found capping the outer part of the clusters with a chemical shift of −0.99 (CDCl3, room T.), −0.55 ppm (Tol-d8, room T.) for Cu20H11(S2PH2)9 and −0.17 (CDCl3, room T.) −0.28 (CDCl3, −60 C) for Cu32H20(S2PH2)12 compared with similar μ3-H positions with chemical shifts of 1.3,14 2.10,41 2.74,43 3.51,4 and 3.5810 ppm. We perform asystematic analysis of the chemical bonding in these clusters, 1H NMR chemical shifts, dynamic effects on the Cu–μ3-H distances, and thermal contributions to the NMR peaks. Finally, we use our recent implementation of gauge-including magnetically induced currents (GIMIC)53,54 to analyse the diatropic and paratropic currents generated by the external magnetic field in the NMR probe. We observe a global diatropic current around a chain of six Cu atoms that form (111)-like facets but also a highly localized diatropic current around the μ3-H hydrides shielding for the nuclei and thus causing an upfield negative shift in the NMR spectrum.
33 and Cu32H20(S2PH2)1252 complexes. The μ3-H is found capping the outer part of the clusters with a chemical shift of −0.99 (CDCl3, room T.), −0.55 ppm (Tol-d8, room T.) for Cu20H11(S2PH2)9 and −0.17 (CDCl3, room T.) −0.28 (CDCl3, −60 C) for Cu32H20(S2PH2)12 compared with similar μ3-H positions with chemical shifts of 1.3,14 2.10,41 2.74,43 3.51,4 and 3.5810 ppm. We perform asystematic analysis of the chemical bonding in these clusters, 1H NMR chemical shifts, dynamic effects on the Cu–μ3-H distances, and thermal contributions to the NMR peaks. Finally, we use our recent implementation of gauge-including magnetically induced currents (GIMIC)53,54 to analyse the diatropic and paratropic currents generated by the external magnetic field in the NMR probe. We observe a global diatropic current around a chain of six Cu atoms that form (111)-like facets but also a highly localized diatropic current around the μ3-H hydrides shielding for the nuclei and thus causing an upfield negative shift in the NMR spectrum.
2. Results and discussion
The systems studied in this work are based on the structures by Liu and coworkers.33,52 The Cu20H11(S2PH2)9 (1, Fig. 1a) and Cu32H20(S2PH2)12 (2, Fig. 1b) clusters were modeled from crystallographic data of Cu20H11(S2P(OiPr)2)9 and Cu32H20(S2P(OiPr)2)12 where the ligands were simplified to improve computational efficiency. Cluster 1 can be geometrically described as an elongated triangular orthobicupola of 18 Cu atoms enclosing 2 central vertical Cu atoms. Cluster 2 can be described as a hexacapped rhombohedron of 14 Cu atoms enclosed by two twisted triangular cupolas of 9 Cu atoms similar to cluster 1. | ||
| Fig. 1 (a) For the Cu20H11(S2PH2)9 cluster, the eleven hydrides are divided into three groups based on their positions; six μ3-H hydrides, two μ4-Htr hydrides and three μ4-Hsq hydrides. (b) For the Cu32H20(S2PH2)12 cluster, the twenty hydrides are divided into five groups; six μ3-H hydrides, two μ4-Htr hydrides, four μ4-Htr1 hydrides, six μ3-H1 hydrides, and two μ5-Hsp hydrides. The S2PH2 ligands are omitted for clarity. | ||
Both model systems were optimized at the B88-P86/def2-TZVP level of theory as discussed in the computational details. To verify the local minimum, a vibrational analysis was performed for each system and the simulated infra-red absorption spectra for clusters 1 and 2 are shown in Fig. SI-1.† The normal modes for the hydrides in cluster 1 were observed in a narrow range between 905–968 cm−1 due to low coordination of the hydrides with the Cu atoms. Cluster 2 absorbs in a broader range of frequencies with vibrational normal modes between 831–1283 cm−1. The wider range is due to the wider variety of hydride coordination present in this cluster. The topological analysis of the density55 gives insight into the chemical bonding in the two copper hydrides (see Fig. SI-2†). Details of these calculations are given in the Computational section. The calculated bond paths shown in the density molecular graphs confirm the hydrides’ formal assigned coordination. This analysis also reveals that there are almost no copper–copper bond paths and, thus, no copper–copper bonding in these clusters. A remarkable exception is the central copper dimer bond in 1 (see Fig. SI-2†). To gain more qualitative insight into the chemical bonding in these systems, we calculated the density, ρ(rCP), and Laplacian of the density, ∇2ρ(rCP), at the Cu–H and Cu–Cu bond critical points, rCP. For all of these bonds,∇2ρ(rCP) > 0 holds, which excludes covalent bonding.56 The corresponding densities at these critical points are between 0.05 and 0.1 a.u., indicating weak metallic or ionic bonding. Of particular interest is the fact that in cluster 1, the ρ(rCP) for the central copper dimer is with 0.51 a.u. smaller than the ρ(rCP) for all Cu–H bonds. Thus, the weak metallic bonding between the copper atoms is the reason for the missing Cu–Cu bond paths. The copper hydride bonds are therefore essential for the cluster structures observed. This is experimentally confirmed by the fact that these clusters decompose under thermal hydrogen release.33,52
1H NMR chemical shifts
To identify the different types of hydride positions for clusters 1 and 2, the magnetic shielding tensor was computed as described in the Computational details section. The proton chemical shifts for cluster 1 are summarized in Table 1.In agreement with previous experimental studies,33 we have identified three different types of hydrides for cluster 1 in a 3:2:6 ratio. Six μ3-H hydrides on triangular facets were obtained with an unusual upfield shift of −1.00 ppm (−1.52/PBE) with a deviation of 0.01–0.45 ppm (0.53–0.97 ppm/PBE) with respect to experimental values.33 These deviations depend on the functional and the basis set as well as the solvent used in experiments. Two hydrides μ4-Htr, each in a tetrahedral position inside the triangular cupola at the top and bottom, were identified with a downfield shift of 1.98 ppm (1.83 ppm/PBE) within 0.1–0.52 ppm (0.05–0.37 ppm/PBE) from experimental values reported.33 Three additional hydrides are shifted downfield with a μ4-Hsq position in the center of a slightly distorted square polygon formed by the two central Cu atoms and the vertices of the Cu shell. These hydrides exhibit a calculated downfield shift of 4.25 ppm (4.24 ppm/PBE) differing by 0.93–1.45 ppm (0.92–1.44 ppm/PBE) from experimental measurements. They are also more sensitive to the solvent where Tol-d8 produces a larger downfield shift than CDCl3. These shifts also show the largest difference between the experimental and DFT values. The larger difference is due to the calculations being performed in gas phase. We expect that further studies including the solvent effect, either explicitly or through an implicit solvent model, would improve the agreement between the computed and experimental 1H proton shifts but this is beyond the scope of this work.
For the copper hydride cluster 2, we identified the position of the twenty hydrides divided in five groups summarized in Table 2 in agreement with previous experimental reports.52 As in cluster 1, there are six μ3-H hydrides on triangular (111)-like facets, located on the triangular cupola at the top and bottom of the cluster, with similar unusual upfielded chemical shifts of 0.20, 0.34 ppm (−0.15, −0.3 ppm/PBE) in a 4:2 ratio with a deviation of 0.37–0.62 ppm (0.02–0.13 ppm/PBE) from experimental values. To compare two calculated chemical shifts with one experimental value, the deviation is given as the minimum and maximum difference between the two data sets. Both B88-P86 and PBE functionals showed upfield shifting, but only the PBE results were shifted to the negative part of the spectrum as observed experimentally. It is worth mentioning that both chemical shifts were measured shifted upfield independently of the temperature in CDCl3 solvent. We want to highlight this unusual behaviour and bring later the discussion on this μ3-H hydrides on 1 and 2 clusters.
A second set of six μ3-H1 hydrides was observed on triangular facets around the central rhombohedron of 14 Cu atoms. At room temperature, the experimental NMR showed only one peak at 0.92 ppm but when the temperature was decreased to −60 C, two peaks at 1.32 and 0.13 ppm were reported. We also observed two different values for these μ3-H1 positions, 2.27 and 1.44 ppm (2.12, 1.24 ppm/PBE) in a 4:2 ratio which deviate by 0.95–1.31 ppm (0.80–1.11 ppm/PBE) from experimental values at −60 °C and 0.52–1.35 ppm (0.32, 1.20 ppm/PBE) at room temperature. The effects of temperature on the chemical shifts for these hydrides is addressed later in the discussion. Each μ3-H1 hydride appears symmetric on alternating triangular facets around the rhombohedron pointing towards the top or bottom triangular cupola but always outside the cluster.
The tetrahedrally coordinated hydrides are divided into two groups, μ4-Htr and μ4-Htr1, based on their positions inside the cluster. The former are located in positions similar to those observed in cluster 1 with Cu tetrahedra in the triangular cupolas at the top and bottom of the cluster each containing one μ4-Htr hydride. The latter are located in four tetrahedra formed by the triangular cupolas and the rhombohedron and each tetrahedron contains one μ4-Htr1 hydride. The calculated chemical shifts for μ4-Htr hydrides are 5.27 ppm (5.11 ppm/PBE) with a deviation of 2.15–2.18 ppm (1.99–2.02 ppm/PBE) from experimental values, while the calculated chemical shifts for the μ4-Htr1 hydrides are 6.03 ppm (5.95 ppm/PBE) with a deviation of 1.33–2.04 ppm (1.25–1.96/PBE) from the experimental values.
The last two highly coordinated μ5-Hsp hydrides are each located in distorted square pyramids formed by Cu atoms from both triangular cupolas and the rhombohedron. Each hydride may be found near the center of the distorted square base. The μ5-Hsp hydrides have the largest downfield chemical shift at 8.76 ppm (8.68 ppm/PBE) with a deviation of 2.83–4.06 ppm (2.75–3.98 ppm/PBE) with respect to experimental values. A 2:4:2:6:6 ratio was observed between the hydrides of cluster 2, in good agreement with that previously reported.52
Structural dynamic effects
To address the dynamic effects on the chemical shifts of the clusters 1 and 2, Born–Oppenheimer Molecular Dynamics (BOMD) were performed for 15 ps at different temperatures as described in the Computational details section. Each system was thermally equilibrated for 10 ps. An additional 5 ps were simulated and the trajectories taken to analyze structural changes. As shown above, the chemical shifts for the μ3-H hydrides in both clusters 1 and 2, were experimentally and computationally observed as shifted upfield to negative values. Experimentally, these shifts are independent of solvent or probe temperature, therefore we examined the bond lengths with respect to the closest Cu atoms.As the 1H NMR measurements were done at 20 and 30 °C for cluster 1, we performed the BOMD simulations at 300 K for this cluster. We followed the three characteristic distances, ![[d with combining macron]](https://www.rsc.org/images/entities/i_char_0064_0304.gif) 1, 2 and 3, of one of the μ3-H hydrides with respect to each of the Cu atoms to which it is coordinated, as shown in Fig. 2. The 5 ps trajectory analysis showed longer 1 = 1.80 Å (σ1 = 0.12 Å) and shorter 2 = 1.69 Å (σ2 = 0.08 Å) bond lengths. The third characteristic distance, 3, has a value of 1.73 Å (σ1 = 0.08 Å). As can be seen from the color bar and histograms in Fig. 2, despite thermal fluctuations in the three different bond lengths, the deviation from the mean values is small, approximately 0.1 Å. All of these values are longer compared with previously reported experimental bond lengths33 for cluster 1 (1 = 1.60 ± 0.04, 2 = 1.72 ± 0.03 and 3 = 1.76 ± 0.04, Table SI-1†). The experimental data was collected at 100 K and our longer values are expected due to the higher dynamics at 300 K. Our values are also in good agreement with typical experimental bond lengths for μ3-H which are 1–7–1.9 Å.4,14,28
1, 2 and 3, of one of the μ3-H hydrides with respect to each of the Cu atoms to which it is coordinated, as shown in Fig. 2. The 5 ps trajectory analysis showed longer 1 = 1.80 Å (σ1 = 0.12 Å) and shorter 2 = 1.69 Å (σ2 = 0.08 Å) bond lengths. The third characteristic distance, 3, has a value of 1.73 Å (σ1 = 0.08 Å). As can be seen from the color bar and histograms in Fig. 2, despite thermal fluctuations in the three different bond lengths, the deviation from the mean values is small, approximately 0.1 Å. All of these values are longer compared with previously reported experimental bond lengths33 for cluster 1 (1 = 1.60 ± 0.04, 2 = 1.72 ± 0.03 and 3 = 1.76 ± 0.04, Table SI-1†). The experimental data was collected at 100 K and our longer values are expected due to the higher dynamics at 300 K. Our values are also in good agreement with typical experimental bond lengths for μ3-H which are 1–7–1.9 Å.4,14,28
 | ||
| Fig. 2 Bond lengths analysis between a μ3-H hydride and its three coordinating neighbor Cu atoms for the BOMD trajectory during 10–15 ps for the cluster 1 at 300 K. | ||
For cluster 2, previous experimental 1H NMR measurements52 were done at −60 °C and room temperature. We selected three different temperatures (100, 200, 300 K) to perform the BOMD simulations. The simulations at 300 K showed severe structural distortions due to the elongated shape of the cluster 2 and the small S2PH2 model ligands. We therefore chose to focus our analysis on simulations at 100 and 200 K. The trajectory analysis for the μ3-H hydride at 100 K (Fig. SI-3†) showed two nearly equivalent bond lengths, 2 = 1.74 Å (σ2 = 0.03 Å) and 3 = 1.74 Å (σ3 = 0.02 Å), and a third shorter bond length, 1 = 1.67 Å (σ1 = 0.01 Å). At this temperature, the thermal fluctuations are almost negligible as shown in the color bar and histograms of Fig. SI-3.† Although the BOMD trajectories at 200 K (Fig. SI-6†) showed broader deviations from the mean values, the average bond lengths are consistent with their respective values at 100 K (Fig. SI-5†). Again, two equal bond lengths, 2 = 1.73 Å(σ2 = 0.1 Å) and 3 = 1.73 Å (σ3 = 0.09 Å), and a third shorter bond length, 1 = 1.69 Å(σ1 = 0.08 Å) were observed. We observe that the two equivalent distances are shorter and the third one longer compared to the corresponding distances at 100K. For cluster 2, the experimental values reported at 100 K (ref. 52) are 1 = 1.63 ± 0.04, 2 = 1.72 ± 0.03 and 3 = 1.78 ± 0.07 (Table SI-1†). Our values obtained from BOMD at 100 K are thus in good agreement with experiment.
Thermal contributions to 1H NMR chemical shifts
We computed the shielding tensor during the BOMD trajectories from 10–15 ps and analyzed the respective chemical shifts for one hydride sample of every individual type as shown in Fig. 3, SI-4 and SI-5,† for both clusters 1 and 2 at the respective temperatures. | ||
| Fig. 3 1H NMR dynamics of one sample of each at the μ3-H, μ4-Htr and μ4-Hsq hydride types for cluster 1 during 10–15 ps at 300 K. The average shifts are given by the dashed lines while the standard deviations are shown with the blue shading. | ||
For cluster 1, at 300 K, the small fluctuations in the bond lengths (0.08–0.12 Å) show a direct correlation between the shortening and lengthening of the three bond distances with the standard deviation in the chemical shifts of 0.96–1.16 ppm over time that can also occur in the experimental NMR setup. The average chemical shielding values are always shifted downfield with the μ4-Hsq hydride showing the highest downfield shift  followed by the μ4-Htr hydride
  and the μ3-H
  . These results show that the ordering of the hydride chemical shifts is not altered by temperature effects and μ3-H is still observed with an average negative chemical shift.
For cluster 2, the standard deviations in the chemical shifts are smaller at lower temperatures, between 0.26–0.51 ppm (100 K), and larger, between 0.84–1.26 (200 K), at higher temperatures in good correspondence with the fluctuations in the three bond lengths observed in the trajectory analysis for both clusters. While the calculations at 0 K did not reproduce the negative chemical shift value observed for the μ3-H hydrides at the B88-P86/def2TZVP level of theory, once the thermal contributions are considered, the 1H chemical shift is moved further upfield to values of  at 100K and
  at 200 K.
Interestingly, the chemical shift for the μ3-H1 hydride shows an average upfield chemical shift of  at 100 K and a downfield chemical shift of
  at 200 K compared with the calculated results at 0 K. As previously discussed, at 0 K, the μ3-H1 hydrides give a signal in a ratio of 4:2 with a significant difference of 0.83 ppm between the peaks. This raises the possibility that thermal contributions average both upfield and downfield shifts during the trajectory.
The highly coordinated hydride positions did not show on average any significant change compared with the 0 K computations after including the thermal contributions, with μ4-Htr hydride 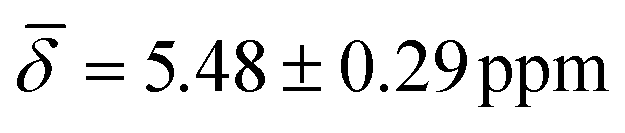 , μ4-Htr1 hydride
  , μ5-Hsp hydride
  at 100 K and with μ4-Htr
 , μ4-Htr1
 , μ5-Hsp
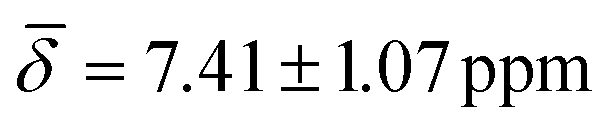 at 200 K (Table 3).
| 1 | 2 | |||
|---|---|---|---|---|
| Position | 300 K | Position | 100 K | 200 K |
| μ3-H | −0.54 (1.02) | μ3-H | −0.09 (0.26) | −0.16 (0.95) |
| μ4-Htr | 3.65 (0.96) | μ3-H1 | 1.33 (0.29) | 2.37 (0.84) |
| μ4-Hsq | 5.66 (1.16) | μ4-Htr | 5.48 (0.29) | 5.10 (1.26) |
| μ4-Htr1 | 6.42 (0.30) | 5.96 (1.03) | ||
| μ5-Hsp | 8.67 (0.51) | 7.41 (1.07) | ||
Magnetically induced current densities
Understanding the local and global magnetic environment in the clusters is crucial to rationalize the different responses of proton chemical shifts to the external magnetic field imposed in NMR measurements. Therefore, we studied the magnetically induced current density J(1)(r) obtained by the gauge-including magnetically induced currents (GIMIC).53,54,57 Within the computations a magnetic field in the z-direction B = (0, 0, 1 T) was imposed for both clusters 1 and 2. The magnetically induced current density at J(1)(r) = 0.01 nA T−1 is shown in Fig. 4 for cluster 1 (a) and cluster 2 (b). It is observed that the diatropic contributions appear on top and bottom of the orthobicupola creating a ring with these six Cu atoms that encompass the μ3-H hydrides both also the S atoms in the ligands, creating a global current density in this region of the clusters. Then to analyze the strength of the current density the projected current density fields are shown in three x–y planes at different z-coordinates (Fig. 5). Each plane contains a distinct group of hydrides. The current density fields are circularly integrated to show the contributions of different currents as a function of the radius r from the center of the plane located at (0, 0, z). The diatropic, paratropic and total current contributions on the plane are distinguished as summarized in Table 4. | ||
| Fig. 4 Magnetically induced current density at J(1)(r) = 0.01 nA T−1 for cluster 1 (a) (Cu20H11) and cluster 2 (b) (Cu32H20). Diatropic (blue) and paratropic (red) contributions are shown. A diatropic ring is observed in the top and bottom triangular cupolas for both systems emcompasing each one three μ3-H hydrides, six Cu atoms and three S atoms from the closest ligands. The external magnetic field B (green) is pointing toward the reader (top) and in z-direction (bottom). | ||
 | ||
| Fig. 5 Vectorial fields of the magnetically induced current density and the circularly integrated current density for the cluster 1 (a) (Cu20H11) and the cluster 2 (b) (Cu32H20) at the z-coordinate planes. Diatropic (blue) and paratropic (red) contributions are shown. The total integrated current is shown in black. The external magnetic field B (green is pointing toward the z-direction of the clusters and toward the reader in the planes.) | ||
| 1 | 2 | ||||||||
|---|---|---|---|---|---|---|---|---|---|
| z | r | Tot | Para | Dia | z | r | Tot | Para | Dia |
| 2.8 | 1.0 | −0.04 | 0.01 | −0.05 | 4.68 | 1.0 | −0.05 | 0.01 | −0.06 |
| 2.0 | −0.13 | 0.07 | −0.20 | 2.0 | −0.11 | 0.06 | −0.18 | ||
| 3.0 | −0.52 | 0.09 | −0.61 | 3.0 | −0.54 | 0.08 | −0.63 | ||
| 4.0 | −0.93 | 0.32 | −1.25 | 4.0 | −0.96 | 0.60 | −1.56 | ||
| 2.58 | 1.0 | −0.04 | 0.00 | −0.05 | 2.23 | 1.0 | −0.05 | 0.00 | −0.05 |
| 2.0 | −0.12 | 0.02 | −0.14 | 2.0 | −0.61 | 0.00 | −0.61 | ||
| 3.0 | −0.59 | 0.05 | −0.63 | 3.0 | −0.97 | 0.00 | −0.97 | ||
| 4.0 | −1.23 | 0.40 | −1.62 | 4.0 | −0.71 | 0.35 | −1.06 | ||
| 0 | 1.0 | −0.05 | 0.00 | −0.05 | 0.51 | 1.0 | −0.01 | 0.01 | −0.02 |
| 2.0 | −0.17 | 0.01 | −0.18 | 2.0 | −0.10 | 0.10 | −0.20 | ||
| 3.0 | −0.15 | 0.07 | −0.22 | 3.0 | −0.58 | 0.30 | −0.88 | ||
| 4.0 | 0.42 | 0.65 | −0.24 | 4.0 | −1.22 | 0.35 | −1.56 | ||
For the cluster 1 (Fig. 5a1), in the plane containing the three μ4-Hsq hydrides (z1 = 0.0 Å), they are embedded in global diatropic currents of −0.18 Å2 nA T−1 (r = 2.0 Å) and −0.22 Å2 nA T−1 (r = 3.0 Å) spread inside the core of the cluster thereby causing the high deshielding and thus the downfield shift in the NMR spectrum.
In the plane containing a μ4-Htr hydride (z3 = 2.8 Å), there are three localized paratropic contributions from the Cu atoms surrounding the hydride (Fig. 5a3). At r = 2.0 Å a global diatropic current of −0.20 Å2 nA T−1 is observed but a small current of 0.07 Å2 nA T−1 from the paratropic counterpart decreases the total current strength (Table 4). The downfield shift of this μ4-Htr inside the cluster compared with the μ3-H hydride is therefore expected due to the proton's deshielding.
Looking at the μ3-H hydrides in the z1 = 2.58 Å plane, we observed highly localized diatropic current contributions around each of them (Fig. 5a2) and a global total current of −0.59 (r = 3.0 Å) and −1.23 Å2 nA T−1 (r = 4.0 Å). This difference between the two radii is due to the high contributions of the localized diatropic currents around the hydrides. The localized diatropic areas are easily identified from their spacial representation on the plane containing the μ3-H hydride. The μ3-H hydrides are highly shielded because of the highly localized diatropic currents around them thus giving origin to the negative peak value in the NMR spectrum.
In cluster 2, we observed a global diatropic current surrounding the central part of the Cu core with highly localized paratropic current contributions (Fig. 5b1). In the plane (z1 = 0.51 Å) containing three of the six μ3-H1 hydrides, there is a local paratropic current effect closer to the two symmetrically equivalent μ3-H1 hydrides compared to the third μ3-H1 hydride. The location of the paratropic current explains the 4:2 ratio observed in the calculated NMR at 0 K. Although the total global contributions are very similar (−0.58 at r = 3.0 Å and −1.22 Å2 nA T−1 at r = 4.0 Å) to those observed for the μ3-H hydrides at z2 = 2.58 Å in cluster 1, the paratropic currents reduce the total shielding effect around these hydrides. The chemical shifts for these μ3-H1 positions are thus distinguished from the μ3-H at the cluster's extremities.
The z2 = 2.23 Å plane contains one μ5-Hsp and two μ4-Htr1 hydrides (Fig. 5b2). These hydrides inside the core of the Cu cluster have higher local diatropic contribution for μ4-Htr1 hydrides than for μ5-Hsp, with global diatropic currents of −0.61 Å2 nA T−1 spread in the plane within the area enclosed by r = 2.0 Å with completely negligible paratropic contributions. Then, the higher downfield shift of μ5-Hsp is understood due to the higher deshielding of these protons inside the cluster compared with μ4-Htr1 hydrides.
The last plane at z1 = 4.68 Å (Fig. 5b3) contains both μ4-Htr and μ3-H hydrides. The μ4-Htr hydride at the center is surrounded by localized paratropic currents causing a similar deshielding effect to that observed in cluster 1 thus producing an equivalent downfield shift in the 1H NMR peak. The highly localized diatropic currents around the μ3-H hydrides and the global diatropic currents contributions of −0.63 (r = 3.0 Å) and −1.56 Å2 nA T−1 (r = 4.0 Å) are also similar to the corresponding quantities in cluster 1. These μ3-H hydrides are therefore highly shielded as in cluster 1 because of the highly localized diatropic currents around them and thus show similar negative chemical shifts in the 1H NMR spectrum. The analysis of the magnetic induced currents is supported by the separation of the 1H chemical shieldings into diamagnetic and paramagnetic contributions. Most of the hydrides in clusters 1 and 2 have negative diamagnetic shifts that are smaller in absolute value than the corresponding positive paramagnetic shifts. For the μ3-H hydrides with overall negative chemical shifts, this relation is reversed due to the strong shielding from their local environment.
3. Conclusions
We studied the magnetic response of two copper hydride nanoclusters, Cu20H11(S2PH2)9 and Cu32H20(S2PH2)9, by means of DFT and BOMD calculations to obtain shielding tensors and gauge-including magnetically induced currents. We validated the hydrides’ 1H NMR chemical shifts and positions by comparing with previous experimental reports. Our 0 K ground state and finite temperature BOMD simulations reproduced the unusual negative chemical shift observed for the μ3-H, capping the outer part of (111)-facets in the triangular cupolas of each cluster. By analyzing the dynamic thermal effects on these 1H NMR chemical shifts, we established that small fluctuations in the μ3-H–Cu characteristic bond distances have an immediate upfield/downfield shift with respect to the average value. The correct order assignment of the peaks and the μ3-H hydrides’ negative shift, however, is recovered over time. Finally, we used our implementation of gauge-including magnetically induced currents to elucidate the nature of the shielding around the μ3-H hydrides. A global diatropic current ring, formed by a chain of six Cu atoms including the μ3-H hydrides but also the sulfur atoms from the closest ligands on the clusters, was observed. Additionally, a highly localized diatropic current in the region closest to the μ3-H hydrides was shown causing a higher shielding for these nuclei and thus their upfield negative shift in the NMR spectrum. We expect that this investigation gives insights in the importance of considering the currents within these challenging nanoparticles when elucidating NMR spectra.4. Computational details
Auxiliary density functional theory58 (ADFT) ground state calculations were performed on the two model clusters, Cu20H11(S2PH2)933 and Cu32H20(S2PH2)12,52 employing the B88 exchange59 and P86 correlation60 functionals. The non-interacting Kohn–Sham ADFT wave function was expanded with the linear combination of Gaussian type orbital (LCGTO) approximation. For H, P and S the all-electron LCGTO def2-TZVP basis sets61 were used, whereas for Cu the 19 valence electron Stuttgart–Dresden effective core potential (ECP)62 in combination with the corresponding valence basis set was employed. The cluster structures were fully optimized without symmetry constraints with a quasi-Newton restricted step method and the obtained minima were characterized by analytic frequency analyses. To investigate structural dynamic effects, we also performed canonical BOMD simulations with the same electronic structure method. However, to ease computational demand, we substituted the all-electron def2-TZVP basis by the corresponding DZVP-GGA basis63 in these runs. The temperature was controlled by a three chain Nosé–Hoover thermostat64,65 with a coupling frequency of 260 cm−1. The BOMD trajectories were recorded for 15 ps with a time step of 2.0 fs. For all calculations the GEN-A2* auxiliary function set was employed.63 For the topological analysis of the density, the density critical points are located with a Newton–Raphson type method.66 The bond paths are calculated starting from the (3,−1) bond critical points by a constrained restricted step algorithm as implemented in deMon2k.
For the magnetic shielding tensor calculations, either of the optimized ground state structures or along the BOMD trajectories, the B88-P86/def2-TZVP/GEN-A2* or PBE67/aug-cc-pVDZ68,69/GEN-A2* methodologies were used. The latter has proven particularly accurate for hydrogen shift calculations.70 The 1H chemical shifts for the hydrides were referenced against the 1H chemical shift of TMS computed at the same level of theory. The magnetically induced current densities were computed employing our recent implementation53,54 of the electronic structure method for the gauge-including magnetically induced currents (GIMIC) theory.57 All computations were performed with the quantum chemistry code deMon2k.71
Conflicts of interest
There are no conflicts to declare.Acknowledgements
This work was supported by the Academy of Finland (grants 294217, 319208, 315549, 317739), and through H. H.'s Academy Professorship. The authors wish to acknowledge CSC – IT Center for Science, Finland, for computational resources and the Barcelona Supercomputing Center as part of PRACE project no. 2018194723. B. Z. G. acknowledges funding from CONACyT project CB-2015-258647. At Cinvestav this work was supported by the SENER-CONACyT project 280158 and the CONACyT project A1-S-11929. The authors are grateful to Dr Laura Laverdure for her gracious help providing valuable comments and criticism on the manuscript.References
- W. S. Mahoney, D. M. Brestensky and J. M. Stryker, J. Am. Chem. Soc., 1988, 110, 291–293 CrossRef CAS.
- Z. Mao, J. S. Huang, C. M. Che, N. Zhu, S. K. Y. Leung and Z. Y. Zhou, J. Am. Chem. Soc., 2005, 127, 4562–4563 CrossRef CAS PubMed.
- P.-k. Liao, C.-s. Fang, A. J. Edwards, S. Kahlal, J.-y. Saillard and C. W. Liu, Inorg. Chem., 2012, 51, 6577–6591 CrossRef CAS PubMed.
- E. L. Bennett, P. J. Murphy, S. Imberti and S. F. Parker, Inorg. Chem., 2014, 53, 2963–2967 CrossRef CAS PubMed.
- M. A. Huertos, I. Cano, N. A. Bandeira, J. Benet-Buchholz, C. Bo and P. W. Van Leeuwen, Chem. – Eur. J., 2014, 20, 16121–16127 CrossRef CAS PubMed.
- R. S. Dhayal, J. H. Liao, X. Wang, Y. C. Liu, M. H. Chiang, S. Kahlal, J. Y. Saillard and C. W. Liu, Angew. Chem., Int. Ed., 2015, 54, 13604–13608 CrossRef CAS PubMed.
- T. A. D. Nguyen, Z. R. Jones, B. R. Goldsmith, W. R. Buratto, G. Wu, S. L. Scott and T. W. Hayton, J. Am. Chem. Soc., 2015, 137, 13319–13324 CrossRef CAS PubMed.
- J.-H. Liao, R. S. Dhayal, X. Wang, S. Kahlal, J.-Y. Saillard and C. W. Liu, Inorg. Chem., 2014, 53, 11140–11145 CrossRef CAS PubMed.
- R. S. Dhayal, J. H. Liao, H. N. Hou, R. Ervilita, P. K. Liao and C. W. Liu, Dalton Trans., 2015, 44, 5898–5908 RSC.
- T. A. D. Nguyen, B. R. Goldsmith, H. T. Zaman, G. Wu, B. Peters and T. W. Hayton, Chem. – Eur. J., 2015, 21, 5341–5344 CrossRef CAS PubMed.
- P. V. Kishore, J. H. Liao, H. N. Hou, Y. R. Lin and C. W. Liu, Inorg. Chem., 2016, 55, 3663–3673 CrossRef CAS PubMed.
- T. A. D. Nguyen, Z. R. Jones, D. F. Leto, G. Wu, S. L. Scott and T. W. Hayton, Chem. Mater., 2016, 28, 8385–8390 CrossRef CAS.
- S. Liu, M. S. Eberhart, J. R. Norton, X. Yin, M. C. Neary and D. W. Paley, J. Am. Chem. Soc., 2017, 139, 7685–7688 CrossRef CAS PubMed.
- H. Z. Ma, J. Li, A. J. Canty and R. A. O'Hair, Dalton Trans., 2017, 46, 14995–15003 RSC.
- H. H. Nie, Y. Z. Han, Z. Tang, S. Y. Yang and B. K. Teo, J. Cluster Sci., 2018, 29, 837–846 CrossRef CAS.
- A. W. Cook and T. W. Hayton, Acc. Chem. Res., 2018, 51, 2456–2464 CrossRef CAS PubMed.
- T. Nakajima, Y. Kamiryo, K. Hachiken, K. Nakamae, Y. Ura and T. Tanase, Inorg. Chem., 2018, 57, 11005–11018 CrossRef CAS PubMed.
- K. K. Chakrahari, R. P. Silalahi, J. H. Liao, S. Kahlal, Y. C. Liu, J. F. Lee, M. H. Chiang, J. Y. Saillard and C. W. Liu, Chem. Sci., 2018, 9, 6785–6795 RSC.
- P. V. Kishore, D. R. Shi, J. H. Liao, A. K. Gupta and C. W. Liu, Inorg. Chim. Acta, 2019, 496, 119068 CrossRef CAS.
- A. Ghosh, R. W. Huang, B. Alamer, E. Abou-Hamad, M. N. Hedhili, O. F. Mohammed and O. M. Bakr, ACS Mater. Lett., 2019, 1, 297–302 CrossRef CAS.
- A. Chen, X. Kang, S. Jin, W. Du, S. Wang and M. Zhu, J. Phys. Chem. Lett., 2019, 10, 6124–6128 CrossRef CAS PubMed.
- H. Shen, L. Wang, O. López-Estrada, C. Hu, Q. Wu, D. Cao, S. Malola, B. K. Teo, H. Häkkinen and N. Zheng, Nano Res., 2021, 14, 3303–3308 CrossRef CAS.
- H. Xu, Y. Z. Han, J. OuYang, Z. C. Chen, H. J. Chen, H. H. Nie, Z. Tang, S. Y. Yang, R. B. Huang, L. S. Zheng and B. K. Teo, Dalton Trans., 2021, 50, 4028–4035 RSC.
- C. Sun, B. K. Teo, C. Deng, J. Lin, G. G. Luo, C. H. Tung and D. Sun, Coord. Chem. Rev., 2021, 427, 213576 CrossRef CAS.
- R. P. Brocha Silalahi, G. R. Huang, J. H. Liao, T. H. Chiu, K. K. Chakrahari, X. Wang, J. Cartron, S. Kahlal, J. Y. Saillard and C. W. Liu, Inorg. Chem., 2020, 59, 2536–2547 CrossRef CAS PubMed.
- R.-W. Huang, J. Yin, C. Dong, A. Ghosh, M. J. Alhilaly, X. Dong, M. N. Hedhili, E. Abou-Hamad, B. Alamer, S. Nematulloev, Y. Han, O. F. Mohammed and O. M. Bakr, J. Am. Chem. Soc., 2020, 142, 8696–8705 CrossRef PubMed.
- S. K. Barik, S. C. Huo, C. Y. Wu, T. H. Chiu, J. H. Liao, X. Wang, S. Kahlal, J. Y. Saillard and C. W. Liu, Chem. – Eur. J., 2020, 26, 10471–10479 CrossRef CAS PubMed.
- D. A. Ekanayake, A. Chakraborty, J. A. Krause and H. Guan, Inorg. Chem., 2020, 59, 12817–12828 CrossRef CAS PubMed.
- T. Nakajima, K. Nakamae, R. Hatano, K. Imai, M. Harada, Y. Ura and T. Tanase, Dalton Trans., 2019, 48, 12050–12059 RSC.
- K. K. Chakrahari, R. P. Silalahi, T. H. Chiu, X. Wang, N. Azrou, S. Kahlal, Y. C. Liu, M. H. Chiang, J. Y. Saillard and C. W. Liu, Angew. Chem., Int. Ed., 2019, 58, 4943–4947 CrossRef CAS PubMed.
- A. Aloisi, É. Crochet, E. Nicolas, J. C. Berthet, C. Lescot, P. Thuéry and T. Cantat, Organometallics, 2021, 40, 2064–2069 CrossRef CAS.
- R. S. Dhayal, W. E. Van Zyl and C. W. Liu, Dalton Trans., 2019, 48, 3531–3538 RSC.
- R. S. Dhayal, J.-H. Liao, Y.-R. Lin, P.-K. Liao, S. Kahlal, J.-Y. Saillard and C. W. Liu, J. Am. Chem. Soc., 2013, 135, 4704–4707 CrossRef CAS PubMed.
- J. Li, H. Z. Ma, G. E. Reid, A. J. Edwards, Y. Hong, J. M. White, R. J. Mulder and R. A. O'Hair, Chem. – Eur. J., 2018, 24, 2070–2074 CrossRef CAS PubMed.
- J. Li, J. M. White, R. J. Mulder, G. E. Reid, P. S. Donnelly and R. A. O'Hair, Inorg. Chem., 2016, 55, 9858–9868 CrossRef CAS PubMed.
- A. J. Edwards, R. S. Dhayal, P. K. Liao, J. H. Liao, M. H. Chiang, R. O. Piltz, S. Kahlal, J. Y. Saillard and C. W. Liu, Angew. Chem., Int. Ed., 2014, 53, 7214–7218 CrossRef CAS PubMed.
- A. J. Jordan, G. Lalic and J. P. Sadighi, Chem. Rev., 2016, 116, 8318–8372 CrossRef CAS PubMed.
- T. Nakajima, K. Nakamae, Y. Ura and T. Tanase, Eur. J. Inorg. Chem., 2020, 2020, 2211–2226 CrossRef CAS.
- C. Sun, N. Mammen, S. Kaappa, P. Yuan, G. Deng, C. Zhao, J. Yan, S. Malola, K. Honkala, H. Häkkinen, B. K. Teo and N. Zheng, ACS Nano, 2019, 13, 5975–5986 CrossRef CAS PubMed.
- T. Nakajima, Y. Kamiryo, M. Kishimoto, K. Imai, K. Nakamae, Y. Ura and T. Tanase, J. Am. Chem. Soc., 2019, 141, 8732–8736 CrossRef CAS PubMed.
- A. W. Cook, T. A. D. Nguyen, W. R. Buratto, G. Wu and T. W. Hayton, Inorg. Chem., 2016, 55, 12435–12440 CrossRef CAS PubMed.
- C. M. Zall, J. C. Linehan and A. M. Appel, J. Am. Chem. Soc., 2016, 138, 9968–9977 CrossRef CAS PubMed.
- K. Nakamae, M. Tanaka, B. Kure, T. Nakajima, Y. Ura and T. Tanase, Chem. – Eur. J., 2017, 23, 9457–9461 CrossRef CAS PubMed.
- S. Lee, M. S. Bootharaju, G. Deng, S. Malola, W. Baek, H. Häkkinen, N. Zheng and T. Hyeon, J. Am. Chem. Soc., 2020, 142, 13974–13981 CrossRef CAS PubMed.
- K. Nakamae, T. Nakajima, Y. Ura, Y. Kitagawa and T. Tanase, Angew. Chem., Int. Ed., 2020, 59, 2262–2267 CrossRef CAS PubMed.
- P. Yuan, R. Chen, X. Zhang, F. Chen, J. Yan, C. Sun, D. Ou, J. Peng, S. Lin, Z. Tang, B. K. Teo, L. S. Zheng and N. Zheng, Angew. Chem., Int. Ed., 2019, 58, 835–839 CrossRef CAS PubMed.
- R. S. Dhayal, W. E. Van Zyl and C. W. Liu, Acc. Chem. Res., 2016, 49, 86–95 CrossRef CAS PubMed.
- S. Wang, T. Liu and D. E. Jiang, ACS Appl. Mater. Interfaces, 2021, 13, 53468–53474 CrossRef CAS PubMed.
- S. Wang, Z. Wu, S. Dai and D. en Jiang, Angew. Chem., Int. Ed., 2021, 60, 12289–12292 CrossRef CAS PubMed.
- B. Reif, S. E. Ashbrook, L. Emsley and M. Hong, Nat. Rev. Methods Primers, 2021, 1, 2 CrossRef CAS PubMed.
- T. Helgaker, M. Jaszuński and K. Ruud, Chem. Rev., 1999, 99, 293–352 CrossRef CAS PubMed.
- R. S. Dhayal, J.-H. Liao, S. Kahlal, X. Wang, Y.-C. Liu, M.-H. Chiang, W. E. vanZyl, J.-Y. Saillard and C. W. Liu, Chem. – Eur. J., 2015, 21, 8369–8374 CrossRef CAS PubMed.
- O. López-Estrada, E. Selenius, B. Zuniga-Gutierrez, S. Malola and H. Häkkinen, J. Chem. Phys., 2021, 154, 204303 CrossRef PubMed.
- O. López-Estrada, B. Zuniga-Gutierrez, E. Selenius, S. Malola and H. Häkkinen, Nat. Commun., 2021, 12, 2477 CrossRef PubMed.
- R. Bader, Atoms in Molecules, A Quantum Theory, Oxford University Press, 1990 Search PubMed.
- R. Bianchi, G. Gervasio and D. Marabello, Inorg. Chem., 2000, 39, 2360–2366 CrossRef CAS PubMed.
- D. Sundholm, H. Fliegl and R. J. Berger, Wiley Interdiscip. Rev.: Comput. Mol. Sci., 2016, 6, 639–678 CAS.
- P. Calaminici, A. Alvarez-Ibarra, D. Cruz-Olvera, V.-D. Domınguez-Soria, R. Flores-Moreno, G. U. Gamboa, G. Geudtner, A. Goursot, D. Mejıa-Rodrıguez, D. R. Salahub, B. Zuniga-Gutierrez and A. M. Köster, in Auxiliary Density Functional Theory: From Molecules to Nanostructures, ed. J. Leszczynski, A. Kaczmarek-Kedziera, T. Puzyn, M. G. Papadopoulos, H. Reis and M. K. Shukla, Springer International Publishing, Cham, 2017, pp. 795–860 Search PubMed.
- A. D. Becke, Phys. Rev. A, 1988, 38, 3098–3100 CrossRef CAS PubMed.
- J. P. Perdew, Phys. Rev. B: Condens. Matter Mater. Phys., 1986, 33, 8822–8824 CrossRef PubMed.
- F. Weigend and R. Ahlrichs, Phys. Chem. Chem. Phys., 2005, 7, 3297–3305 RSC.
- B. P. Pritchard, D. Altarawy, B. Didier, T. D. Gibson and T. L. Windus, J. Chem. Inf. Model., 2019, 59, 4814–4820 CrossRef CAS PubMed.
- P. Calaminici, F. Janetzko, A. M. Köster, R. Mejia-Olvera and B. Zuniga-Gutierrez, J. Chem. Phys., 2007, 126, 044108 CrossRef PubMed.
- S. Nosé, J. Chem. Phys., 1984, 81, 511–519 CrossRef.
- W. G. Hoover, Phys. Rev. A, 1985, 31, 1695–1697 CrossRef PubMed.
- M. Leboeuf, A. M. Köster, K. Jug and D. R. Salahub, J. Chem. Phys., 1999, 111, 4893–4905 CrossRef CAS.
- J. Perdew, K. Burke and M. Ernzerhof, Phys. Rev. Lett., 1996, 77, 3865–3868 CrossRef CAS PubMed.
- D. E. Woon and T. H. Dunning, J. Chem. Phys., 1993, 98, 1358–1371 CrossRef CAS.
- N. B. Balabanov and K. A. Peterson, J. Chem. Phys., 2005, 123, 064107 CrossRef PubMed.
- B. Zuniga-Gutierrez, G. Geudtner and A. M. Köster, J. Chem. Phys., 2011, 134, 124108 CrossRef PubMed.
- A. Köster, G. Geudtner, A. Alvarez-Ibarra, P. Calaminici, M. Casida, J. Carmona-Espindola, V. Dominguez, R. Flores-Moreno, G. Gamboa, A. Goursot, T. Heine, A. Ipatov, A. de la Lande, F. Janetzko, J. del Campo, D. Mejia-Rodriguez, J. U. Reveles, J. Vasquez-Perez, A. Vela, B. Zuniga-Gutierrez and D. Salahub, deMon2k, Version6, The deMon developers, Cinvestav, Mexico City, 2018, https://www.demon-software.com/ Search PubMed.
Footnote |
| † Electronic supplementary information (ESI) available: Calculated IR spectra, molecular graphs, BOMD bond lengths analyses, BOMD 1H NMR chemical shifts. See DOI: https://doi.org/10.1039/d2nr02415b |
| This journal is © The Royal Society of Chemistry 2022 |