Novel MOF-derived 3D hierarchical needlelike array architecture with excellent EMI shielding, thermal insulation and supercapacitor performance†
Si-Qi
Zhu‡
,
Jin-Cheng
Shu‡
and
Mao-Sheng
Cao
 *
*
School of Materials Science and Engineering, Beijing Institute of Technology, Beijing 100081, China. E-mail: caomaosheng@bit.edu.cn
First published on 10th May 2022
Abstract
The upcoming 5G era will powerfully promote the development of intelligent society in the future, but it will also bring serious electromagnetic pollution. Thus, the development of efficient, lightweight and multifunctional electromagnetic shielding materials and devices is an important research hotspot around the world. Herein, a novel needlelike Co3O4/C array architecture is constructed from MOF precursor via a simple pyrolysis process, and its microstructure is controllably tailored by changing the pyrolysis temperature. The unique 3D hierarchical structure and multiphase components enable the architecture to provide high-efficiency electromagnetic interference (EMI) shielding, along with good thermal insulation. More importantly, the architecture possesses fast ion transport channels, which can be used to construct supercapacitors with high specific capacitance and excellent cycle stability. Obviously, this work offers a new inspiration for the design and construction of multifunctional electromagnetic materials and devices.
1. Introduction
With the advent of the 5G era, electromagnetic pollution emitted by increasingly popular electronic devices has posed a great threat to the global society, which not only seriously threatens the national military security, but also creates potential hazards to human health.1–8 Thus, the development of high-efficiency electromagnetic shielding materials and devices has become a research hotspot around the world. Meanwhile, the rapid development of electronic devices towards miniaturization and intelligence has also put forward new requirements for thermal insulation and energy storage performance. Currently, although considerable efforts have been devoted to searching for new materials capable of achieving electromagnetic interference (EMI) shielding, thermal insulation and energy storage, few works have been reported on the integration of these three functions together.9–12 Therefore, the exploration of high-efficiency and multifunctional EMI shielding materials is an important research topic.13,14Metal–organic framework (MOF) is gathering momentum as versatile materials in many fields, such as electromagnetic protection, battery, catalysis, and supercapacitor.15–21 In particular, benefiting from the designable components, variable structures and tunable electromagnetic properties, it is highly favored in electromagnetic materials and functional devices.22,23 For example, Ji’ group24 reported a highly efficient NC-Co3O4/CP absorber with a minimum reflection loss (RL) of −41.38 dB at 2.3 mm. Che and co-workers25 fabricated Co@NC composites that displayed a minimum RL of −53.0 dB at 1.8 mm. Chen et al.26 produced a core–shell ZnO@C/Co3ZnC and its RL reached −62.9 dB with a bandwidth of 5.5 GHz. Xie’ group27 developed MOFs/SiC nanowire hybrids, and its RL achieved −47 dB. Han et al.28 synthesized hollow carbon microcubes, with a minimum RL of −60.7 dB. Zhang’ group29 prepared ferrite/Co/porous carbon materials, and the optimal RL was −31.05 dB at 1.5 mm. These fantastic MOF-derived functional materials have brought continued prosperity to the field of electromagnetic wave absorption. However, the development of MOFs has barely begun for EMI shielding, let alone the multifunctional shielding materials.
In this work, a novel and hierarchical needlelike Co3O4/C array architecture is successfully constructed from zeolitic imidazolate framework-67 (ZIF-67) precursor on Ni foam (NF@Co/C), and the effect of pyrolysis temperature on the microstructure is dissected in depth. Benefitting from the unique 3D hierarchical structure and multiphase components, this NF@Co/C architecture integrates three functions, including excellent EMI shielding and good thermal insulation as well as stable and efficient supercapacitor performance. Importantly, a deep insight into the connection between structure and functions is given, and the internal response mechanism is reasonably excavated. Undoubtedly, this multifunctional architecture is of great significance to the construction of portable and intelligent devices.
2. Results and discussion
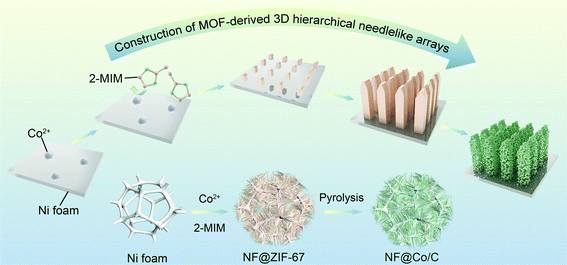
The preparation route of needlelike Co3O4/C arrays on nickel (Ni) foam is given in Fig. 1. Initially, the MOF-based precursors (NF@ZIF-67) are obtained by a simple self-assembly process. Afterwards, the obtained precursors are pyrolyzed in the air to produce 3D hierarchical needlelike Co3O4/C arrays. The microstructure of Co3O4/C arrays can be flexibly adjusted by changing the pyrolysis temperature. Fig. S1a† shows the XRD pattern of ZIF-67 stripped from the NF@ZIF-67, which is in good agreement with the simulated XRD pattern.30 In Fig. S1b,† eight typical diffraction peaks can be indexed to the cubic structure of Co3O4, confirming the successful preparation of NF@Co/C architecture from NF@ZIF-67 precursor by the pyrolysis process.SEM images clearly show the grown ZIF-67 and Co3O4/C arrays on the surface of Ni foam, as shown in Fig. 2. The obtained products pyrolyzed at different temperatures possess various morphologies. The NF@Co/C architectures pyrolyzed at relatively low temperatures inherit the polyhedral shape of ZIF-67, but their surfaces become rough. As the pyrolysis temperature increases, the fracture and decomposition of 2-methylimidazole (2-MIM) ligand aggravate, clearly enlarging the pores on the surface of the product.31–33 Meanwhile, the structure further shrinks, breaks, and tends to form small nanoparticles. As shown in Fig. 2b–f, the resulting Co3O4/C arrays consist of numerous Co3O4/C nanoparticles. In addition, high temperature will destroy the connection between Co3O4/C arrays and Ni foam, causing them to flake off. Fig. 2g shows the distribution of Co, O, C and N elements in the selected area. A uniform distribution of Co and O elements confirms the uniform growth of Co3O4 arrays on the surface of Ni foam.34 Meanwhile, nitrogen atoms are demonstrated to be successfully doped, and a small amount of carbon is retained in the final products.35,36
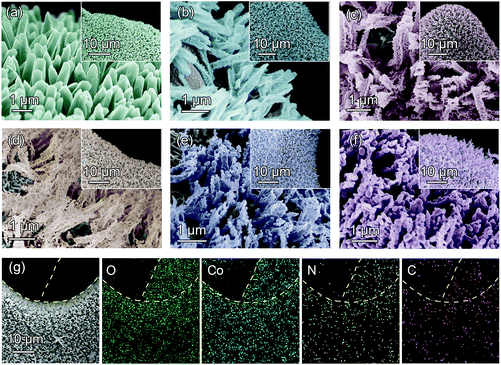 | ||
| Fig. 2 SEM images of (a) NF@ZIF-67, (b) NF@Co/C-450, (c) NF@Co/C-500, (d) NF@Co/C-550, (e) NF@Co/C-600 and (f) NF@Co/C-650. (g) SEM and elemental mapping images of NF@Co/C-550. | ||
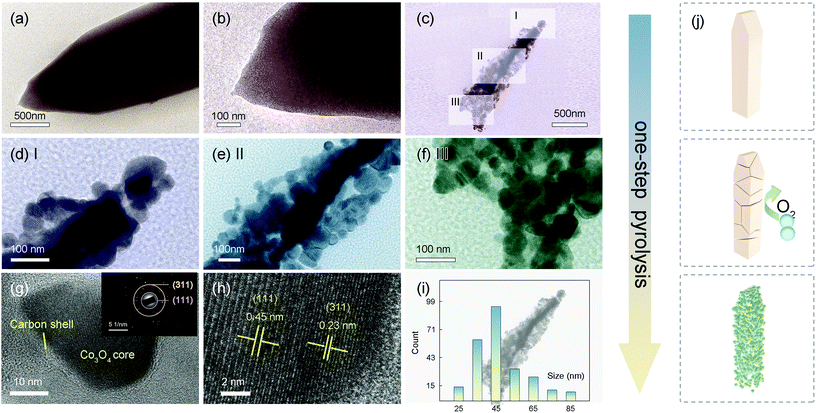
An insight into the morphologies and microstructures of NF@ZIF-67 and NF@Co/C architectures is further given by TEM, HR-TEM and SAED images (Fig. 3). As displayed in Fig. 3a and b, ZIF-67 shows a needlelike morphology with a diameter of ≈1.2 μm. The TEM images in Fig. 3c–f show the morphology of the Co3O4/C-550 sample, once again confirming that the needlelike Co3O4/C arrays consist of small nanoparticles. A thin layer of carbon is observed at the edge of the Co3O4 nanoparticle, which is consistent with elemental mapping (Fig. 3g).37,38 Furthermore, two typical lattice fringes of 0.23 and 0.45 nm are observed in Fig. 3h, corresponding to (311) and (111) crystal planes, respectively.37,38 The size of nanoparticles ranges from 25 nm to 85 nm (Fig. 3i). Fig. 3j illustrates the conversion process from ZIF-67 to Co3O4/C. In this process, the ZIF-67 generates cracks and gradually disintegrates, where Co ion and 2-MIM ligand are converted into Co3O4 nanoparticles and carbon layers, respectively, under the action of high temperature and oxygen.32
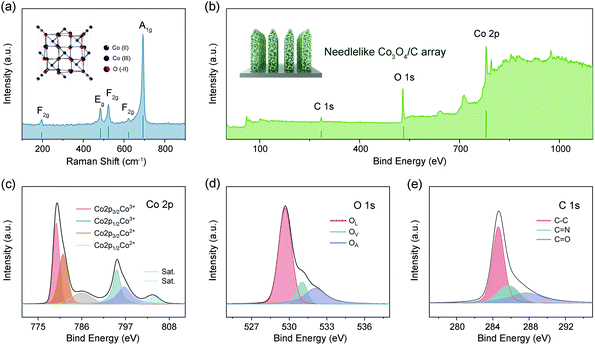
The microstructure of NF@Co/C architecture is investigated by Raman spectrum, as shown in Fig. 4a. The peaks appearing around 194, 482, 522, 618, and 691 cm−1 are attributed to Co3O4.37–39 The XPS spectra further confirm the successful preparation of Co3O4/C (Fig. 4b). The Co 2p spectrum shows two prominent peaks, including 779.8 eV for Co 2p3/2 and 794.9 eV for Co 2p1/2, respectively (Fig. 4c).31,40 Two weak peaks at 786.2 and 804.1 eV may correspond to the shakeup satellite peaks. The energy difference between Co 2p3/2 and Co 2p1/2 is about 15 eV, revealing that the Co element exists mainly in the form of Co3O4.31,38 The peaks of Co 2p3/2 and Co 2p1/2 can be deconvoluted into four fitting peaks. The peaks at 781.2 and 796.7 eV are assigned to Co2+, while the other two peaks at 779.7 and 794.8 eV are attributed to Co3+.34–37 The O 1s spectrum can be resolved into three fitting curves with binding energies at 529.7, 531.1 and 532.1 eV (Fig. 4d). They are assigned to the metal–oxygen bonds (Co–O bonds, OL), oxygen vacancies (OV) and adsorbed oxygen species (OA), respectively.41 In addition, the C 1s spectrum can be deconvoluted into three major peaks (Fig. 4e). The peaks at 284.6, 285.7 and 287.8 eV are assigned to C–C bonds, C![[double bond, length as m-dash]](https://www.rsc.org/images/entities/char_e001.gif) N bonds and C
N bonds and C![[double bond, length as m-dash]](https://www.rsc.org/images/entities/char_e001.gif) O bonds, respectively.31,40
O bonds, respectively.31,40
The total shielding effectiveness (SET), as well as the contribution of absorption (SEA) and reflection (SER), of NF@Co/C architectures is investigated in the frequency range from 8.2 to 12.4 GHz (Fig. S2a–c†). The obtained products demonstrate the fluctuant SET in X band, which may result from the uneven distribution of internal material. The NF@Co/C-550 sample has the optimal SET in the investigated frequency band due to the appropriate structure and component. Among them, Ni foam with high electrical conductivity significantly contributes to the reflection of electromagnetic waves, promoting the improvement of shielding performance (Fig. S3†). The absorption coefficient (A), reflection coefficient (R) and transmission coefficient (T) represent the capability of a shielding material to absorb, reflect and transmit electromagnetic waves, respectively. As shown in Fig. S2d–f,† both R and A coefficients vary to different degrees, and the A coefficient closes to 0.5 at most, indicating the possibility of green EMI shielding. Meanwhile, the T coefficient is less than 0.1, suggesting the high-efficiency EMI shielding of the architectures.
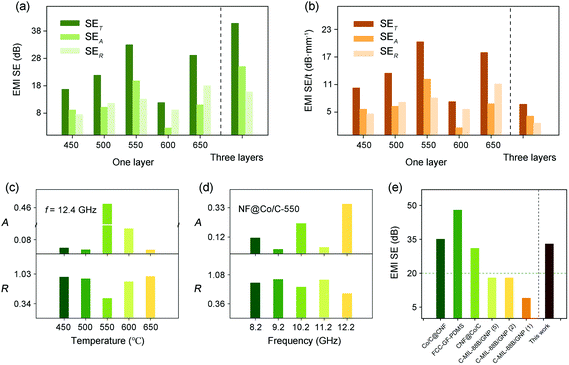
The SET, SEA and SER values of the NF@Co/C architectures are evaluated in Fig. 5a. It can be observed that the pyrolysis temperature has a significant effect on the EMI shielding of the NF@Co/C architecture. The NF@Co/C-550 sample achieves the optimal shielding performance with a maximum EMI SE of 33 dB, suggesting that it can shield 99.95% of electromagnetic waves. The proportion of SEA reaches over 60%. As a result, the pyrolysis temperature should be selected around 550 °C for further application. In addition, the EMI SE of both NF@Co/C-500 and NF@Co/C-650 samples also exceeds 20 dB, enabling them to meet commercial application standards. The EMI SE of three-layer sample achieves 41 dB. More importantly, the NF@Co/C architectures can be directly applied to various electronic devices, which has a greater advantage than powder MOF materials in practical applications. The specific shielding effectiveness (EMI SE/t) can exclude the influence of thickness on the performance. As plotted in Fig. 5b, the NF@Co/C-550 sample also exhibits the highest EMI SE/t.
Absorption and reflection are the two main mechanisms affecting EMI shielding. The influence of pyrolysis temperature on the A and R coefficients is investigated in Fig. 5c. At 12.4 GHz, the NF@Co/C-550 sample shows the largest A coefficient, higher than R coefficient, which means that its green shielding index (gs) is greater than 1.41,42Fig. 5d shows the A and R coefficients of the NF@Co/C-550 sample at different frequencies. The high electrical conductivity (1.2588 × 10⁵ S m−1) is conducive to the reflection of electromagnetic waves, resulting in the larger R coefficient. The gs is adopted to evaluate the environmental friendliness of shielding materials. The result suggests the possibility to achieve green shielding by optimizing the pyrolysis temperature under certain conditions. Compared with other MOF-based shielding materials previously reported, the NF@Co/C-550 sample shows excellent electromagnetic shielding performance and competitiveness, opening new possibilities for the design of green EMI shielding materials (Fig. 5e).43–46
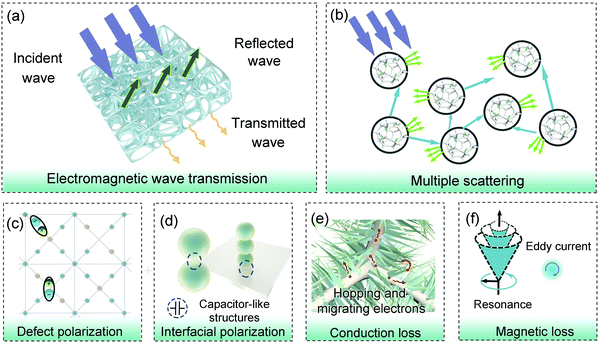
Fig. 6a shows the electromagnetic shielding mechanism of the NF@Co/C architecture. The porous Ni foam and needlelike Co3O4/C arrays provide a large surface area, which promotes the scattering of electromagnetic waves and enhances energy dissipation (Fig. 6b).47,48 Therefore, the constructed 3D hierarchical needlelike architecture can significantly improve the EMI shielding performance. In addition, by tailoring the microstructure and component, the effective absorption of electromagnetic waves by the NF@Co/C architecture can also be reasonably optimized.
To further study the electromagnetic response mechanism, the NF@Co/C-550 sample was mixed with wax and its electromagnetic parameters were measured (Fig. S4†). First, the defects inside the needlelike Co3O4/C arrays cause the charge asymmetric distribution, forming dipoles (Fig. 6c).38,49–54 Meanwhile, the interfaces between Co3O4 core and carbon shell, between Co3O4/C nanoparticles, and between Co3O4/C nanoparticles and Ni foam can be equivalent to capacitor-like structures and generate interfacial dipoles (Fig. 6d). Under an alternating electromagnetic field, these dipoles convert electromagnetic energy into thermal energy due to relaxation loss (Fig. S4a and b†).49,50 Second, electrons are capable of absorbing electromagnetic energy to migrate or hop in the architectures, and cause the energy conversion by colliding and scattering with lattice, i.e. conduction loss (Fig. 6e).1,54 Third, magnetic Co3O4 and Ni foam can bring additional magnetic loss (Fig. 6f). As shown in Fig. S4c,† the eddy current coefficient (μ′′(μ′)−2f−1) varies with frequency, suggesting that the eddy current loss isn't the only source of magnetic loss within the architectures. A peak appears in the complex permeability (Fig. S4d†), which may be indexed to magnetic resonance.38,39,55,56
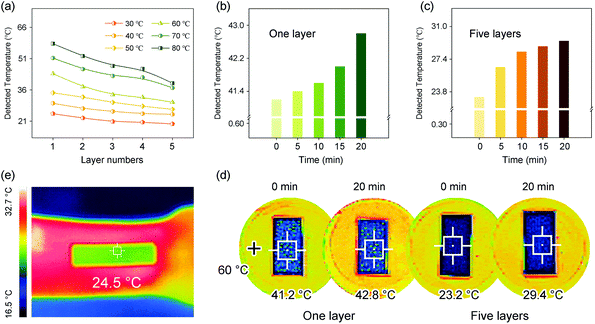
The NF@Co/C architecture also has good thermal insulation performance, which can protect electronic devices from high temperature. The temperature variation of the upper surface of the NF@Co/C architecture with the number of layers is compared at different heating temperatures. The heating temperature is set to 30, 40, 50, 60, 70 and 80 °C, respectively, and the number of layers is increased from one to five. As shown in Fig. 7a, the increment of the number of layers effectively improves the thermal insulation performance. Fig. 7b and c present the detected temperatures of one-layer and five-layer samples that are recorded in the range of 0 to 20 min on a heated platform of 60 °C. The temperature difference maintains a narrow range of variation, reflecting the stable thermal insulation performance of the architecture. The thermal infrared images of one-layer and five-layer samples at 0 and 20 min are captured, respectively, by infrared detection device, as shown in Fig. 7d. Compared with the chartreuse presented by heating platforms, the covered area by the sample turns obvious dark blue, intuitively confirming the excellent thermal insulation performance of the architecture.
Benefiting from the good thermal insulation performance, the NF@Co/C architecture is endowed with infrared stealth function that is worth expecting. Fig. 7e emerges the thermal infrared image of the NF@Co/C architecture placed on the arm. The apparent red of the arm suggests its strong infrared radiation. After the NF@Co/C architecture is placed, the color of the covered area turns from red to green in the thermal infrared image, indicating its excellent radiation suppression. In general, thermal conductivity depends on solid-phase conduction, gas-phase conduction and radiation heat transfer.18 The NF@Co/C architecture features low density and high porosity, and has air with low thermal conductivity insides simultaneously, which is considered to have a great advantage in significantly reducing both the thermal conduction and the heat transfer by radiation. The thermal conductivity of the NF@Co/C-550 sample measured at 60 °C is low to 0.5108 W m−1 k−1, confirming the above analysis.
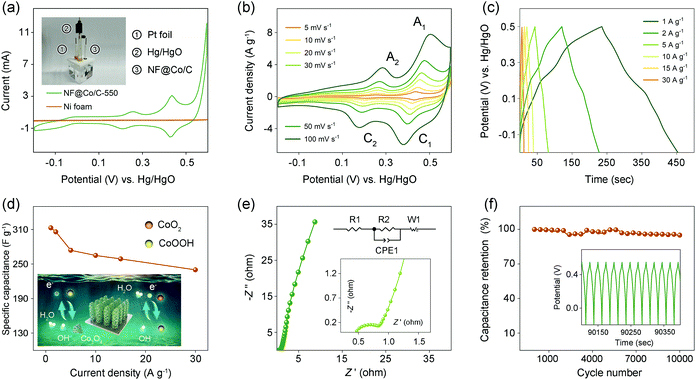
The capacitance performances of the NF@Co/C architecture are evaluated in a 6 M KOH aqueous electrolyte through a three-electrode system, with Pt foil as counter electrode and Hg/HgO as reference electrode (the inset in Fig. 8a). The NF@Co/C architecture can be directly used as an electrode without additional conductive additives and binders, thereby effectively reducing the internal resistance of the electrode and increasing the overall specific capacitance.57 Fig. S5† compares the cyclic voltammetry (CV) curves of five samples at a scan rate of 5 mV s−1. The NF@Co/C-550 sample exhibits the largest CV curve area, the strongest redox peak, and the highest specific capacitance, which is presumably given credit to its appropriate structure and component. Fig. 8a compares the CV curves of the NF@Co/C-550 sample and Ni foam at 5 mV s−1, revealing the little contribution of Ni foam to specific capacitance.
In Fig. 8b, the CV curves of the NF@Co/C-550 sample exhibit two pairs of redox peaks. The kinetics analysis of the NF@Co/C-550 sample is conducted with the data of CV curves. As shown in Fig. S6,† the contribution of surface capacitance increases with the scanning rate. The electrochemical active surface area (ECSA) is calculated according to equation:
 | (1) |
The galvanostatic charge–discharge (GCD) test is conducted in the potential range from −0.2 to 0.5 V at different current densities to evaluate the electrochemical performance (Fig. 8c). The obvious deviation of these charge–discharge curves from the ideal triangular shape reveals the pseudocapacitive nature of the NF@Co/C-550 electrode. The charge–discharge platforms are in good agreement with the redox couples in the CV curves.57,61 Based on the GCD curves, the capacitances at different current densities are readily determined, as shown in Fig. 8d.62 The NF@Co/C-550 sample shows the highest specific capacitance, reaching 313 F g−1 at 1 A g−1. With the increment of current density, the specific capacitance gradually drops, obtaining 306 F g−1 at 2 A g−1, 274 F g−1 at 5 A g−1, 265 F g−1 at 10 A g−1, 259 F g−1 at 15 A g−1 and 240 F g−1 at 30 A g−1, respectively. Nonetheless, 76% of the capacitance can still be retained at a current density as high as 30 A g−1, indicating the excellent rate capability of the architecture.
Electrochemical impedance spectroscopy (EIS) is employed to characterize the NF@Co/C-550 electrode (Fig. 8e). The equivalent series resistance (Rs) is determined from the x-intercept in the high-frequency region, and the charge transfer resistance (Rct) is calculated from the diameter of semicircle. The values of capacitive and resistive components fitting the experimental impedance spectrum based upon the proposed equivalent circuit are given in Table S1.† At a low frequency range, a vertical spike parallel to the Z′′ axis indicates typical capacitance behavior.63 More importantly, the NF@Co/C-550 sample demonstrates extraordinary stability in an alkali solution environment, retaining 95% of the initial capacitance at 10 A g−1 after 10![[thin space (1/6-em)]](https://www.rsc.org/images/entities/char_2009.gif) 000 cycles (Fig. 8f). After cycling tests, the Rs, Rct and Warburg impedance slightly increase (Fig. S8†). Table 1 shows the electrochemical performance of some MOF-derived Co3O4-based electrodes, where specific capacitance and cycle stability are considered.
000 cycles (Fig. 8f). After cycling tests, the Rs, Rct and Warburg impedance slightly increase (Fig. S8†). Table 1 shows the electrochemical performance of some MOF-derived Co3O4-based electrodes, where specific capacitance and cycle stability are considered.
| Materials | Capacitance (F g−1) | Current density (A g−1) | Cycle nubmer | Cycle stability (%) | Ref. |
|---|---|---|---|---|---|
| Co3O4 nanomeshes | 1216.4 | 1 | 8000 | 86.4% | 34 |
| Co3O4@Co-MOF | 1020 | 0.5 | — | — | 60 |
| Co3O4 | 410 | 2 | — | 64 | |
| 3DPC/Co3O4 | 423 | 1 | 2000 | 83% | 65 |
| Reduced Co3O4 | 329 | 1 | — | — | 66 |
| Co3O4 microsphere | 261.1 | 0.5 | 2000 | 90.2% | 67 |
| Nanoporous Co3O4 | 970 | 1 | 5000 | 77.5% | 68 |
| Co3O4 particles | 150 | 1 | 3400 | — | 69 |
| Co3O4@Co-MOF | 797 | 1 | 10![[thin space (1/6-em)]](https://www.rsc.org/images/entities/char_2009.gif) 000 000 |
69% | 70 |
| Co3O4@NPC | 525 | 1.5 | 8000 | 81% | 71 |
| Co3O4 nanotubes | 647 | 1 | 1500 | — | 72 |
| NF@Co/C | 313 | 1 | 10![[thin space (1/6-em)]](https://www.rsc.org/images/entities/char_2009.gif) 000 000 |
95% | This work |
The excellent electrochemical performance of NF@Co/C architecture can be attributed to its unique 3D hierarchical structure and multiphase components. First, the uniform distribution of needlelike Co3O4/C arrays on Ni foam ensures good electrochemical activity. Second, the hierarchical structure of the electrode provides a high specific surface area capable of achieving sufficiently contact with the electrolyte and improves ion transport. Third, the direct contact between Co3O4/C active electrode materials and Ni foam avoids the use of conductive additives and binders, reducing the internal resistance of the electrode and increasing the overall specific capacitance. Finally, the unique 3D hierarchical structure of the NF@Co/C architecture helps to alleviate the volume expansion during the cycle process, which particularly contributes to better maintaining structural integrity and providing outstanding cycle stability.
3. Conclusions
In summary, a novel and hierarchical needlelike Co3O4/C array architecture derived from a MOF-based precursor has been successfully constructed, and its microstructure is controllably tailored by controlling the pyrolysis temperature. Benefiting from the 3D hierarchical structure and multiphase components, the NF@Co/C architecture achieves highly efficient EMI SE, capable of shielding up to 99.95% of electromagnetic radiation, along with good thermal insulation. More importantly, this architecture can be directly used as an excellent electrode for supercapacitors without additional conductive additives and binders, and 95% of the initial capacitance can be retained after 10![[thin space (1/6-em)]](https://www.rsc.org/images/entities/char_2009.gif) 000 cycles. In the future, the novel NF@Co/C architecture will show a bright application prospect as the core of advanced multifunctional devices.
000 cycles. In the future, the novel NF@Co/C architecture will show a bright application prospect as the core of advanced multifunctional devices.
4. Experimental section
4.1 Materials
Ni foam and cobalt nitrate hexahydrate (Co(NO3)2·6H2O) were purchased from Aladdin Reagent Co., LTD (Beijing, China). 2-MIM was purchased from Innochem Technology Co., LTD (Shanghai, China). All chemicals were of analytical grade and used without further purification.4.2 Synthesis of ZIF-67 arrays on Ni foam
Ni foam cut into sheets of 15 mm × 30 mm was ultrasonically cleaned with deionized water and acetone for 30 minutes, respectively, and then dried at 60 °C for 12 h. In a typical process, 40 mL of Co(NO3)2·6H2O solution (0.4 M) was quickly added into 40 mL of 2-MIM solution (25 × 10−3 M). Then, a piece of Ni foam was immersed in the mixture solution for 4 h at room temperature. After being taken out, it was washed with deionized water for three times, and then dried at 60 °C overnight. The obtained product was denoted as NF@ZIF-67.4.3 Synthesis of Co3O4/C arrays on Ni foam
The obtained NF@ZIF-67 precursors were pyrolyzed at different temperatures (450, 500, 550, 600 and 650 °C) for 30 min under air atmosphere with a heating rate of 1 °C min−1. The resulting products were correspondingly denoted as NF@Co/C-450, NF@Co/C-500, NF@Co/C-550, NF@Co/C-600 and NF@Co/C-650, respectively.4.4 Characterizations
The X-ray diffraction (XRD) patterns were recorded using Malvern Panalytical Empyrean X-ray diffractometer with a Cu–K radiation source (0.1546 nm). Raman spectrum was collected using a Renishaw invia Raman microscope with a 532 nm laser beam as the light source. The chemical elements and valence states were characterized by X-ray photoelectron spectrometer (XPS) (ESCALAB 250Xi, Thermo Fisher). The morphology, crystal structure and component of the as-synthesized products were characterized by transmission electron microscopy (TEM, Tecnai G2 F30), high-resolution TEM (HR-TEM), and scanning electron microscope (SEM, Hitachi, S-4800) with energy-dispersive X-ray (EDS) analysis function. The thermal infrared images were visualized with infrared detection device (Sigma ST9660). The electrical conductivity was measured by the four-point probe method (FT-330). The thermal conductivity was measured by the transient plane source method (Hotdisk).4.5 Electromagnetic and electrochemical measurements
The tested NF@Co/C samples were made into a rectangle with a size of 22.86 mm × 10.16 mm and the thickness was measured. The S parameters of the NF@Co/C samples were characterized by the waveguide method by a vector network analyzer (VNA, Anritsu 37269D) in X band (8.2–12.4 GHz). In addition, the sample (10%) was mixed with wax and pressed into a toroidal shape with an outside diameter of 7.03 mm and an inside diameter of 3.00 mm. Then, its complex permittivity and complex permeability were measured by the coaxial method.Electrochemical measurements of the NF@Co/C samples were carried out in a three-electrode system in a 6 M KOH aqueous electrolyte, with Pt foil as counter-electrode and Hg/HgO as reference electrode. CV, EIS and GCD measurements were performed by CHI660E electrochemical workstation. The CV curves were conducted at scan rates of 5, 10, 20, 30, 50, and 100 m V s−1 with the potential window between −0.2 and 0.6 V. The GCD curves were conducted at current densities of 1, 2, 5, 10, 15, and 30 A g−1. The EIS measurements were recorded in the frequency range from 10−2 to 105 Hz with an AC potential amplitude of 5 mV.
Conflicts of interest
There are no conflicts to declare.Acknowledgements
Financial support from the National Natural Science Foundation of China (Grant No. 51977009, 11774027, 51372282, and 51132002).Notes and references
- M. S. Cao, X. X. Wang, M. Zhang, J. C. Shu, W. Q. Cao, H. J. Yang, X. Y. Fang and J. Yuan, Adv. Funct. Mater., 2019, 29, 1807398 CrossRef.
- Y. P. Wang, B. Sou, Y. A. Shi, H. R. Yuan, C. L. Zhu and Y. J. Chen, ACS Appl. Mater. Interfaces, 2020, 12, 40692 CrossRef CAS PubMed.
- O. Balci, E. O. Polat, N. Kakenov and C. Kocabas, Nat. Commun., 2015, 6, 6628 CrossRef CAS PubMed.
- B. Quan, W. H. Shi, S. J. H. Ong, X. C. Lu, P. L. Y. Wang and G. B. Ji, Adv. Funct. Mater., 2019, 29, 1901236 CrossRef.
- D. Ding, Y. Wang, X. D. Li, R. Qiang, P. Xu, W. L. Chu, X. J. Han and Y. C. Du, Carbon, 2017, 111, 722 CrossRef CAS.
- Z. M. Dang, J. K. Yuan, J. W. Zha, T. Zhou, S. T. Li and G. H. Hu, Prog. Mater. Sci., 2012, 57, 660 CrossRef CAS.
- M. Green, Z. Liu, R. Smedley, H. Nawaz, X. Li, F. Huang and X. Chen, Mater. Today Phys., 2018, 5, 78 CrossRef.
- M. Green, L. H. Tian, P. Xiang, J. Murowchick, X. Y. Tan and X. B. Chen, Mater. Today Nano, 2018, 1, 1 CrossRef.
- P. B. Liu, S. Gao, W. H. Huang, J. Ren, D. Y. Yu and W. J. He, Carbon, 2020, 159, 83 CrossRef CAS.
- G. Z. Wang, X. G. Peng, L. Yu, G. P. Wan, S. W. Lin and Y. Qin, J. Mater. Chem. A, 2015, 3, 2734 RSC.
- G. Z. Wang, Z. Gao, S. W. Tang, C. Q. Chen, F. F. Duan, S. C. Zhao, S. W. Lin, Y. H. Feng, L. Zhou and Y. Qin, ACS Nano, 2012, 6, 11009 CrossRef CAS PubMed.
- F. Wu, A. M. Xie, M. X. Sun, Y. Wang and M. Y. Wang, J. Mater. Chem. A, 2015, 2, 14358 RSC.
- Y. Cheng, H. Q. Zhao, H. L. Lv, T. F. Shi, G. B. Ji and Y. L. Hou, Adv. Electron. Mater., 2019, 6, 1900796 CrossRef.
- M. Zhou, W. H. Gu, G. H. Wang, J. Zheng, C. C. Pei, F. Y. Fan and G. B. Ji, J. Mater. Chem. A, 2020, 8, 24267 RSC.
- J. C. Shu, X. Y. Yang, X. R. Zhang, X. Y. Huang, M. S. Cao, L. Li, H. J. Yang and W. Q. Cao, Carbon, 2020, 162, 157 CrossRef CAS.
- J. C. Shu, W. Q. Cao and M. S. Cao, Adv. Funct. Mater., 2021, 31, 2100470 CrossRef CAS.
- R. Qiang, Y. C. Du, H. T. Zhao, Y. Wang, C. H. Tian, Z. G. Li, X. J. Han and P. Xu, J. Mater. Chem. A, 2015, 3, 13426 RSC.
- J. C. Shu, S. Q. Zhu, W. Q. Cao and M. S. Cao, Mater. Chem. Front., 2021, 5, 6553 RSC.
- P. B. Liu, S. Gao, Y. Wang, Y. Huang, W. J. He and W. H. Huang, Chem. Eng. J., 2020, 381, 122653 CrossRef CAS.
- R. Banerjee, A. Phan, B. Wang, C. Knobler, H. Furukawa, M. O'Keeffe and O. M. Yaghi, Science, 2008, 319, 939 CrossRef CAS PubMed.
- L. Wang, Y. Z. Han, X. Feng, J. W. Zhou, P. F. Qi and B. Wang, Coord. Chem. Rev., 2016, 307, 361 CrossRef CAS.
- L. Wang, X. Feng, L. T. Ren, Q. H. Piao, J. Q. Zhong, Y. B. Wang, H. W. Li, Y. F. Chen and B. Wang, J. Am. Chem. Soc., 2015, 137, 4920 CrossRef CAS PubMed.
- L. Wang, M. Q. Huang, X. F. Yu, W. B. You, J. Zhang, X. H. Liu, M. Wang and R. C. Che, Nano-Micro Lett., 2020, 12, 150 CrossRef CAS PubMed.
- B. Quan, X. H. Liang, X. Zhang, G. Y. Xu, G. B. Ji and Y. W. Du, ACS Appl. Mater. Interfaces, 2018, 10, 41535 CrossRef CAS PubMed.
- M. Q. Huang, L. Wang, K. Pei, W. B. You, X. F. Yu, Z. C. Wu and R. C. Che, Small, 2020, 16, 2000158 CrossRef CAS PubMed.
- W. Feng, Y. M. Wang, Y. C. Zou, J. C. Chen, D. C. Jia and Y. Zhou, Chem. Eng. J., 2018, 324, 364 CrossRef.
- K. Zhang, F. Wu, A. M. Xie, M. X. Sun and W. Dong, ACS Appl. Mater. Interfaces, 2017, 9, 33042 Search PubMed.
- H. H. Zhao, X. Z. Xu, Y. H. Wang, D. G. Fan, D. W. Liu, K. F. Lin, P. Xu, X. J. Han and Y. C. Du, Small, 2020, 16, 2003407 CrossRef CAS PubMed.
- L. X. Wang, Y. K. Guan, X. Qiu, H. L. Zhu, S. B. Pan, M. X. Yu and Q. T. Zhang, Chem. Eng. J., 2017, 326, 945 CrossRef CAS.
- J. N. Qin, S. B. Wang and X. C. Wang, Appl. Catal., B, 2017, 209, 476 CrossRef CAS.
- R. R. Salunkhe, J. Tang, Y. Kamachi, T. Nakato, J. H. Kim and Y. Yamauchi, ACS Nano, 2015, 9, 6288 CrossRef CAS PubMed.
- J. Shao, Z. M. Wan, H. M. Liu, H. Y. Zheng, T. Gao, M. Shen, Q. T. Qu and H. H. Zheng, J. Mater. Chem. A, 2014, 2, 12194 RSC.
- H. C. Wang, L. Xiang, W. Wei, J. An, J. He, C. H. Gong and Y. L. Hou, ACS Appl. Mater. Interfaces, 2017, 9, 42102 CrossRef CAS PubMed.
- G. J. Wei, Z. Zhou, X. X. Zhao, W. Q. Zhang and C. H. An, ACS Appl. Mater. Interfaces, 2018, 10, 23721 CrossRef CAS PubMed.
- X. B. Yang, J. Chen, Y. Q. Chen, P. J. Feng, H. X. Lai, J. T. Li and X. T. Luo, Nano-Micro Lett., 2018, 10, 15 CrossRef PubMed.
- G. Y. Zhao, L. Tang, L. Zhang, X. Chen, Y. C. Mao and K. N. Sun, J. Alloys Compd., 2018, 746, 277 CrossRef CAS.
- Z. Y. Xiao, L. L. Fan, B. Xu, S. Q. Zhang, W. P. Kang, Z. X. Kang, H. Lin, X. P. Liu, S. Y. Zhang and D. F. Sun, ACS Appl. Mater. Interfaces, 2017, 9, 41827 CrossRef CAS PubMed.
- J. C. Shu, X. Y. Huang and M. S. Cao, Carbon, 2021, 174, 638 CrossRef CAS.
- D. Q. Zhang, T. T. Liu, M. Zhang, H. B. Zhang, X. Y. Yang, J. Y. Cheng, J. C. Shu, L. Li and M. S. Cao, Nanotechnology, 2020, 31, 325703 CrossRef CAS PubMed.
- X. H. Liang, Z. M. Man, B. Quan, J. Zheng, W. H. Gu, Z. Zhang and G. B. Ji, Nano-Micro Lett., 2020, 12, 102 CrossRef CAS PubMed.
- M. Zhang, H. J. Yang, Y. Li, W. Q. Cao, X. Y. Fang, J. Yuan and M. S. Cao, Appl. Phys. Lett., 2019, 115, 212902 CrossRef.
- X. X. Wang, J. C. Shu, W. Q. Cao, M. Zhang, J. Yuan and M. S. Cao, Chem. Eng. J., 2019, 369, 1068 CrossRef CAS.
- Y. Fei, M. Liang, Y. Chen and H. W. Zou, Ind. Eng. Chem. Res., 2020, 59, 154 CrossRef CAS.
- C. C. Yu, S. P. Zhu, C. T. Xing, X. C. Pan, X. B. Zuo, J. F. Liu, M. L. Chen, L. W. Liu, G. H. Tao and Q. Li, J. Alloys Compd., 2020, 820, 153108 CrossRef CAS.
- Y. Fei, M. Liang, L. W. Yan, Y. Chen and H. W. Zou, Chem. Eng. J., 2020, 392, 124815 CrossRef CAS.
- Y. Fei, M. Liang, T. Zhou, Y. Chen and H. W. Zou, Carbon, 2020, 167, 575 CrossRef CAS.
- Z. C. Wu, K. Pei, L. S. Xing, X. F. Yu, W. B. You and R. C. Che, Adv. Funct. Mater., 2019, 29, 1901448 CrossRef.
- B. Wen, M. S. Cao, Z. L. Hou, W. L. Song, L. Zhang, M. M. Lu, H. B. Jin, X. Y. Fang, W. Z. Wang and J. Yuan, Carbon, 2013, 65, 124 CrossRef CAS.
- M. S. Cao, W. L. Song, Z. L. Hou, B. Wen and J. Yuan, Carbon, 2010, 48, 788 CrossRef CAS.
- M. M. Lu, W. Q. Cao, H. L. Shi, X. Y. Fang, J. Yang, Z. L. Hou, H. B. Jin, W. Z. Wang, J. Yuan and M. S. Cao, J. Mater. Chem. A, 2014, 2, 10540 RSC.
- Q. H. Liu, Q. Cao, H. Bi, C. Y. Liang, K. P. Yuan, W. She, Y. J. Yang and R. C. Che, Adv. Mater., 2016, 28, 486 CrossRef CAS PubMed.
- H. Sun, R. C. Che, X. You, Y. S. Jiang, Z. B. Yang, J. Deng, L. B. Qiu and H. S. Peng, Adv. Mater., 2014, 26, 8120 CrossRef CAS PubMed.
- R. C. Che, L. M. Peng, X. F. Duan, Q. Chen and X. L. Liang, Adv. Mater., 2004, 16, 401 CrossRef CAS.
- B. Wen, M. S. Cao, M. M. Lu, W. Q. Cao, H. L. Shi, J. Liu, X. X. Wang, H. B. Jin, X. Y. Fang, W. Z. Wang and J. Yuan, Adv. Mater., 2014, 26, 34843489 Search PubMed.
- J. W. Liu, R. C. Che, H. J. Chen, F. Zhang, F. Xia, Q. S. Wu and M. Wang, Small, 2012, 23, 1214 CrossRef PubMed.
- R. C. Che, Appl. Phys. Lett., 2006, 88, 033105 CrossRef.
- C. Z. Yuan, L. Yang, L. R. Hou, L. F. Shen, X. G. Zhang and X. W. (David) Lou, Energy Environ. Sci., 2012, 5, 7883 RSC.
- C. C. L. McCrory, S. Jung, I. M. Ferrer, S. M. Chatman, J. C. Peters and T. F. Jaramillo, J. Am. Chem. Soc., 2015, 13, 4347 CrossRef PubMed.
- J. Yan, C. E. Ren, K. Maleski, C. B. Hatter, B. Anasori, P. Urbankowski, A. Sarycheva and Y. Gogotsi, Adv. Funct. Mater., 2017, 27, 1701264 CrossRef.
- S. S. Zheng, Q. Li, H. G. Xue, H. Pang and Q. Xu, Natl. Sci. Rev., 2020, 7, 305 CrossRef CAS PubMed.
- C. Guan, W. Zhao, Y. T. Hu, Z. C. Lai, X. Li, S. J. Sun, H. Zhang, A. K. Cheetham and J. Wang, Nanoscale Horiz., 2017, 2, 99 RSC.
- L. Q. Mai, A. M. Khan, X. C. Tian, K. M. Hercule, Y. L. Zhao, X. Lin and X. Xu, Nat. Commun., 2013, 4, 2923 CrossRef PubMed.
- R. B. Rakhi, W. Chen, D. Cha and H. N. Alshareef, Nano Lett., 2012, 12, 2559 CrossRef CAS PubMed.
- F. Zhang, J. L. Zhang, J. Song, Y. You, X. L. Jin and J. J. Ma, Ceram. Int., 2021, 47, 14001 CrossRef CAS.
- S. M. Li, K. Yang, P. W. Ye, K. R. Ma, Z. Zhang and Q. Huang, Appl. Surf. Sci., 2020, 503, 144090 CrossRef CAS.
- S. J. Liu, T. Deng, X. Y. Hu, X. Y. Shi, H. X. Wang, T. T. Qin, X. X. Zhang, J. G. Qi, W. Zhang and W. T. Zheng, Electrochim. Acta, 2018, 289, 319 CrossRef CAS.
- D. X. Guo, X. M. Song, F. B. Li, L. C. Tan, H. Y. Ma, L. L. Zhang and Y. Q. Zhao, Colloids Surf., A, 2018, 546, 1 CrossRef CAS.
- Y. Lu, Y. B. Liu, J. M. Mo, B. L. Deng, J. X. Wang, Y. Q. Zhu, X. D. Xiao and G. Xu, J. Alloys Compd., 2021, 853, 157271 CrossRef CAS.
- F. L. Meng, Z. G. Fang, Z. X. Li, W. W. Xu, M. J. Wang, Y. P. Liu, J. Zhang, W. R. Wang, D. Y. Zhao and X. H. Guo, J. Mater. Chem. A, 2013, 1, 7235 RSC.
- S. R. Chen, M. Xue, Y. Q. Li, Y. Pan, L. K. Zhu and S. L. Qiu, J. Mater. Chem. A, 2015, 3, 20145 RSC.
- R. K. Devi, G. Muthusankar, S. Chen and G. Gopalakrishnan, Microchim. Acta, 2021, 188, 196 CrossRef CAS PubMed.
- H. Li, F. Yue, C. Yang, P. Qiu, P. Xue, Q. Xu and J. D. Wang, Ceram. Int., 2016, 42, 3121 CrossRef CAS.
Footnotes |
| † Electronic supplementary information (ESI) available. See DOI: https://doi.org/10.1039/d2nr01024k |
| ‡ These authors contributed equally to this work. |
| This journal is © The Royal Society of Chemistry 2022 |

