 Open Access Article
Creative Commons Attribution 3.0 Unported Licence
Towards custom built double core carbon nanothreads using stilbene and pseudo-stilbene type systems†
Sebastiano
Romi
 a,
Samuele
Fanetti
 *ab,
Frederico
Alabarse
 c,
Antonio M.
Mio
 d,
Julien
Haines
 e and
Roberto
Bini
 *abf
*abf
aLENS, European Laboratory for Non-linear Spectroscopy, Via N. Carrara 1, I-50019 Sesto Fiorentino, Firenze, Italy
bICCOM-CNR, Istituto di Chimica dei Composti OrganoMetallici, Via Madonna del Piano 10, I-50019 Sesto Fiorentino, Firenze, Italy. E-mail: fanetti@lens.unifi.it
cELETTRA, Elettra Sincrotrone Trieste S.C.p.A, in AREA Science Park, 34149 Basovizza, Trieste, Italy
dIMM-CNR, Istituto per la Microelettronica e Microsistemi, VIII Strada 5 – Zona Industriale, 95121 Catania, Italy
eInstitut Charles Gerhardt Montpellier, CNRS, Université de Montpellier, 34095 Montpellier, France
fDipartimento di Chimica “Ugo Schiff”, Università di Firenze, Via della Lastruccia 3, I-50019 Sesto Fiorentino, Italy. E-mail: roberto.bini@unifi.it
First published on 21st February 2022
Abstract
Until recently, saturated carbon nanothreads were the missing tile in the world of low-dimension carbon nanomaterials. These one-dimensional fully saturated polymers possess superior mechanical properties by combining high tensile strength with flexibility and resilience. They can be obtained by compressing aromatic and heteroaromatic crystals above 15 GPa exploiting the anisotropic stress that can be achieved by the diamond anvil cell technique. Recently, double-core nanothreads were synthesized by compressing azobenzene crystals, achieving the remarkable result of preserving the azo group as a linker of the resulting double thread. Herein, we demonstrate the generality of these findings through the synthesis of double carbon nanothreads from trans stilbene and azobenzene-stilbene mixed crystals. Employment of Fourier transform infrared spectroscopy and synchrotron X-ray diffraction enabled a comprehensive characterization of the reactivity identifying threshold conditions, kinetics and structure–reaction relationship. In particular, the reaction is anticipated by a phase transition characterized by a sudden increase of the monoclinic angle and a collapse along the b axis direction. Large bidimensional crystalline areas extending several tens of nanometers are evidenced by transmission electron microscopy also confirming the monoclinic unit cell derived from X-ray diffraction data in which threads possessing the polymer 1 structure, as suggested by density functional theory calculations, are packed. The most exciting result of this study is the demonstration of viable synthesis of double nanothreads where the number and the nature of chromophoric groups linking the threads can be tuned by preparing starting crystals of desired composition, thanks to the isomorphism typical of the pseudo-stilbene molecules. This is extremely important in tailoring nanothreads with tunable optical properties and an adjustable band gap, also exploiting the possibility of introducing substituents in the phenyl groups.
Introduction
The number and the applications of pure or hybrid carbon nanomaterials have impressively grown in the last few years encompassing many different research areas like energy storage, biomedical and environmental applications, organic solar cells, sensors and biosensors, imaging, materials science and many others.1–3 These applications mainly involve the use of pure or composite materials based on graphene,4 nanotubes5,6 and nanodiamonds.7 Among pure carbon nanomaterials, saturated carbon nanothreads are the last discovered, filling the gap concerning the existence of fully sp3 carbon 1D diamond-like chains. These materials are expected to be characterized by extraordinary mechanical properties combining stiffness only slightly less than diamond, with flexibility, resilience and excellent tensile strength.8 Saturated carbon nanothreads were predicted9–11 well in advance with respect to the first reported synthesis realized by compressing benzene in a Paris-Edinburgh press.12 After this first achievement the number of syntheses and the comprehension of reaction mechanisms impressively grew thus providing the basis for potential technological applications.13,14 Nanothreads were indeed produced by compressing different aromatics like pyridine,15,16 aniline,17 thiophene,18 furan,19para disubstituted benzenes,20 arene-perfluoroarene21,22 and phenol-pentafluorophenol23 co-crystals, but also fully saturated strained molecules like cubane.24 This number further increases when computational studies are taken into account, since fully saturated carbon nanothreads have been reported from polycyclic aromatic hydrocarbons,25 substituted benzenes (–CH3, –NH2, –OH, –F),26 and also from five-membered heteroaromatics.27 As far as the mechanism is concerned, the nanothread formation is often non-topochemical mostly benefiting the uniaxial stress intrinsic to the use of the DAC while avoiding any hydrostatic compression medium.28,29 Consequently, the competition between topochemical and stress driven reactivity limits the nanothread yield and the exploitation of temperature to improve the quality and to increase the reaction yield.16,30 The reaction mechanism reflects in the nanothreads’ structure which exhibits a relatively parallel arrangement forming pseudohexagonal 2D lattice domains with a correlation length of tens of nm but definitely much shorter (≤2.5 nm) along the threads.31,32 This is due to the presence of unsaturation and defects which determine the quality and length of the threads,8,33 but, on the other hand, can also be used for tuning the electronic properties.34 Designing and tailoring nanothreads with customized features is presently the main challenge from the experimental point of view and its realization requires the knowledge of the structure–reaction relationships of the starting crystal and the control of the number and type of unsaturation or substituent group. In fact, the heteroatoms or substituents present outside the thread backbone can be readily available as potential linkers or active sites for doping, besides concurring to determine the electronic properties of the nanothread, without altering its mechanical characteristics.34Recently, a double nanothread linked by azo groups was synthesized by compressing azobenzene above 20 GPa.35 X-ray diffraction studies suggest a polymerization process involving equivalent molecules stacked along the b axis36 and leading to the formation of high quality double core nanothreads presenting a polymer-1 geometry. The nanothreads obtained are arranged in large bundles having a pseudohexagonal 2D ordered structure with the distance between the planes, identified by the centres of the threads, of 5.6 Å. However, the most relevant result concerns the preservation of the azo group, an occurrence having two-fold importance. The first one is related to the photophysical and photochemical properties of azobenzenes which represent a versatile class of dyes and thanks to the efficient photo-isomerization are employed for the realization of molecular devices, and functional and composite materials.37–41 The second aspect is represented by the close similarities of azobenzene with the pseudo-stilbene class of molecules, characterized by a similar molecular structure, where only the linking group changes (for example, ethyl, ethenyl, ethynyl), presenting an isostructural crystal packing making possible the formation of substitutionally mixed crystals.42–44 The composition of the starting crystal can therefore be adjusted by changing, for example the relative concentration of pseudo stilbene molecules or introducing ring substituents, for tuning the optical and electronic properties of the synthesized material.
The ambient pressure crystal structures of t-azobenzene (TA) and t-stilbene (TS) are monoclinic, P21/c, with two molecules in the asymmetric unit cell42,43 located at inversion centers and with one of them characterized by dynamic orientational disorder.45 The TA structure has also been characterized up to 12 GPa using nitrogen as the pressure transmitting medium.36 The P21/c structure holds up to about 9.5 GPa where a phase transition is observed likely related to a structural adjustment of the precursor of the nanothread formation. In addition to being isostructural and exhibiting the same kind and degree of disorder, TA and TS are also characterized by almost identical packing coefficients, thus making the formation of mixed crystals possible with continuously adjustable relative concentration. Mixed crystals having four different compositions (from TS![[thin space (1/6-em)]](https://www.rsc.org/images/entities/char_2009.gif) :
:![[thin space (1/6-em)]](https://www.rsc.org/images/entities/char_2009.gif) TA ∼ 2
TA ∼ 2![[thin space (1/6-em)]](https://www.rsc.org/images/entities/char_2009.gif) :
:![[thin space (1/6-em)]](https://www.rsc.org/images/entities/char_2009.gif) 1 to TS
1 to TS![[thin space (1/6-em)]](https://www.rsc.org/images/entities/char_2009.gif) :
:![[thin space (1/6-em)]](https://www.rsc.org/images/entities/char_2009.gif) TA ∼ 1
TA ∼ 1![[thin space (1/6-em)]](https://www.rsc.org/images/entities/char_2009.gif) :
:![[thin space (1/6-em)]](https://www.rsc.org/images/entities/char_2009.gif) 3) were structurally characterized at ambient pressure by X-ray and neutron diffraction.44 Besides confirming the perfect miscibility and the retention of the crystal structure, this study pointed out that stilbene molecules preferentially occupy the disordered site, which presents a more available volume, and that the evolution of the lattice parameters with the composition nicely fits Vegard's law therefore indicating a perfect substitution without volume excess.
3) were structurally characterized at ambient pressure by X-ray and neutron diffraction.44 Besides confirming the perfect miscibility and the retention of the crystal structure, this study pointed out that stilbene molecules preferentially occupy the disordered site, which presents a more available volume, and that the evolution of the lattice parameters with the composition nicely fits Vegard's law therefore indicating a perfect substitution without volume excess.
Here, we show the formation of double nanothreads by compressing TS and 1![[thin space (1/6-em)]](https://www.rsc.org/images/entities/char_2009.gif) :
:![[thin space (1/6-em)]](https://www.rsc.org/images/entities/char_2009.gif) 1 TS–TA mixed crystals. The reaction has been characterized by Fourier transform infrared spectroscopy (FTIR) and the crystal evolution was monitored by X-ray diffraction (XRD). An extensive characterization of the nanothreads has been achieved by XRD, FTIR and transmission electron microscopy (TEM) and further supported by density functional theory (DFT) calculations. Different pressure and temperature conditions have also been followed to identify where the quality and the yield of double nanothreads are maximized. This is the first attempt to synthesize a fully saturated carbon nanothread by controlling the concentration of specific chromophores, a prerequisite for achieving an efficient tuning of the optical properties.
1 TS–TA mixed crystals. The reaction has been characterized by Fourier transform infrared spectroscopy (FTIR) and the crystal evolution was monitored by X-ray diffraction (XRD). An extensive characterization of the nanothreads has been achieved by XRD, FTIR and transmission electron microscopy (TEM) and further supported by density functional theory (DFT) calculations. Different pressure and temperature conditions have also been followed to identify where the quality and the yield of double nanothreads are maximized. This is the first attempt to synthesize a fully saturated carbon nanothread by controlling the concentration of specific chromophores, a prerequisite for achieving an efficient tuning of the optical properties.
Results and discussion
The pressure evolution of different pure TS and TS-TA mixed crystals was monitored at ambient temperature by using both FTIR spectroscopy and synchrotron XRD up to pressures exceeding 30 GPa. In all the cases, a reaction was observed and in some experiments we also characterized the kinetics. High-temperature (up to 430 K) isothermal compression experiments were also performed in an attempt to discover the optimal reaction conditions in terms of yield and product quality. In view of the large number of samples investigated, we will present the results separating the different aspects of characterization and, within each of them, presenting separately the results for pure TS and TS–TA mixed crystals.Characterization of the reaction by FTIR spectroscopy
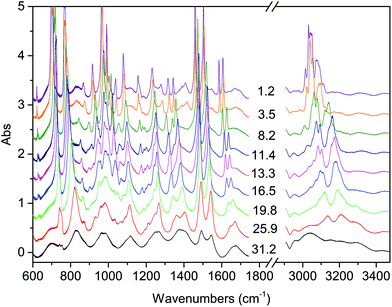 | ||
| Fig. 1 Representative spectra showing the evolution of the IR absorption spectrum of the TS crystal with increasing pressure at ambient temperature. The pressure values reported are expressed in GPa. | ||
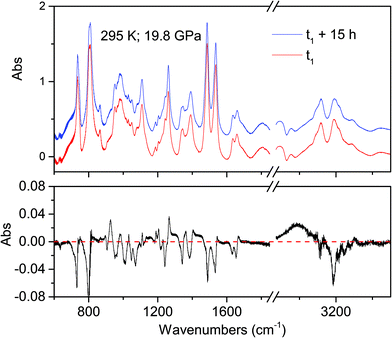
The onset of the reaction slightly changes depending on the waiting time between two consecutive spectra (see Fig. 2), sample and compression rate, but in all the ambient temperature studies ranged between 16 and 20 GPa. The reaction onset cannot be directly identified by the spectral changes because of the broadness of the monomer and product bands at high pressure and by the sluggishness of the transformation. However, a comparison of subsequent spectra acquired at the same, or very close, pressure values, allows for the precise identification of the onset. In Fig. 2 we report the difference spectrum obtained by the subtraction of two spectra registered at the same pressure, 19.8 GPa, but separated by about 15 hours. The sharp negative peaks in the difference spectrum mark the reduction of the monomer amount, whereas the much broader positive peak just below 3000 cm−1 is due to the saturated carbon atoms which characterize the product. The sensitivity of the method can be noticed, since the intensity variations are in the order of hundredth of absorbance units.
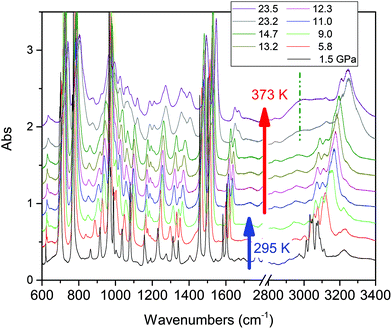
Compression at higher temperatures entails a significant decrease of the threshold pressure as observed in aniline,30 pyridine16 and also azobenzene.35 In Fig. 3 we report some IR absorption spectra measured during an isothermal compression at 373 K. The sample was first compressed at ambient temperature up to 10 GPa, thus well below the reaction onset, and then isobarically heated to 373 K and then compressed again. In this case the signatures of the chemical transformation were observed at 14.5 GPa.
The transformation rate at the reaction onset is extremely slow therefore, once the latter was identified, the samples were rapidly (2–4 minutes) compressed at a few GPa higher to study the kinetics. For this purpose we measured the decrease in the absorbance of selected intense TS bands presenting a reduced width and not overlapping with other monomers or product absorptions. These requirements are satisfied by the strong doublet characterizing the spectrum at around 1500 cm−1 (1460 and 1503 cm−1 at 1.2 GPa; 1495 and 1549 cm−1 at 24 GPa) assigned to ring stretching modes.46 The time evolution of the absorbance of these bands was reproduced by using the Avrami model originally developed to describe the crystal growth from the melt47–49 and then extended to the study of diffusion controlled solid-state reactions.50 Using R(t) = [I(0) − I(t)]/I(0) to indicate the fraction of the TS monomer reacted as a function of time, where the intensity I is relative to the selected TS bands, the fitting relation is given by:
| R(t) = R∞[1 − e[−k(t−t0)n]] | (1) |
The fit parameters are R∞, corresponding to [I(0) − I(∞)]/I(0), the reaction starting time is t0, the rate constant is k1/n and n is related to the dimensionality of the growth process. In Fig. 4 we report the time evolution of the R(t) data as obtained by the fit of the ring stretching absorption bands at about 1500 cm−1 in two different experiments where the kinetics was studied at comparable pressure values but different temperatures: ambient (upper panel) and 373 K (middle panel). As it can be seen by the values of the fitting parameters, reported as insets, we observe a very reproducible behavior in the two cases with almost 30% of reacted monomer, a very similar rate constant and the same n value which attests the unidimensional growth of the reaction product.50,51
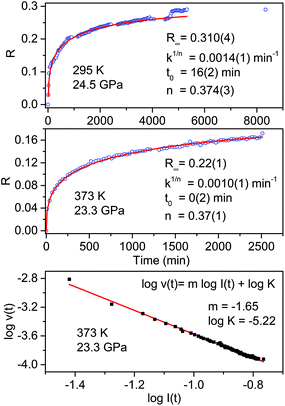 | ||
| Fig. 4 Kinetics of the reactions performed at ambient temperature and 24.5 GPa (upper panel) and at 373 K and 23.3 GPa (middle panel) in pure TS. The fraction of the monomer reacted, determined by the absorption of selected stilbene bands (see text), is plotted as a function of time. The red lines in these two panels are the fit of the experimental data using Avrami's law (eqn (1)), the fitting parameters are reported in both cases as an inset. The clear step after about 5000 hours in the room temperature reaction is related to photochemical effects caused by the laser employed to excite the ruby fluorescence. In the lower panel the log–log plot from which the molecularity of the process, the slope value of the linear evolution, is determined (see text). | ||
A very interesting element to be discussed is represented by the small step clearly visible in the data evolution reported in the upper panel after about 5000 minutes. This occurrence is directly related to the prolonged laser irradiation of the sample for measuring the sample pressure by ruby luminescence. In spite of using only 1 mW of 532 nm cw laser emission, a clear sudden increase in the amount of reacted monomer occurred thus indicating a photoinduced reactivity whose origin is, however, difficult to ascribe to the reaction with other monomers or with the reaction product.
Further insight into the reaction mechanism can be derived by the analysis of the molecularity of the process. To this purpose, we adopted a simple kinetic relation where the reaction rate v is assumed to be proportional to the monomer concentration I through the rate constant K and the process’ molecularity m: v = KIm.52 The analysis is performed using the log–log form log![[thin space (1/6-em)]](https://www.rsc.org/images/entities/char_2009.gif) v(t) = m
v(t) = m![[thin space (1/6-em)]](https://www.rsc.org/images/entities/char_2009.gif) log
log![[thin space (1/6-em)]](https://www.rsc.org/images/entities/char_2009.gif) I + log
I + log![[thin space (1/6-em)]](https://www.rsc.org/images/entities/char_2009.gif) K. In order to calculate the value of the reaction rate along the entire transformation process, we reproduced by a stretched exponential the time evolution of the monomer concentration, i.e. the absorbance value of the selected monomer bands, so as to have an analytical function to derive. In the lower panel of Fig. 4 the log–log plot is reported for the high temperature reaction. The data are nicely reproduced by a single straight line with a slope value, the molecularity, of 1.65 consistent with a rate limiting step involving two molecules and with a linear accretion of the product.
K. In order to calculate the value of the reaction rate along the entire transformation process, we reproduced by a stretched exponential the time evolution of the monomer concentration, i.e. the absorbance value of the selected monomer bands, so as to have an analytical function to derive. In the lower panel of Fig. 4 the log–log plot is reported for the high temperature reaction. The data are nicely reproduced by a single straight line with a slope value, the molecularity, of 1.65 consistent with a rate limiting step involving two molecules and with a linear accretion of the product.
After the reaction equilibrium was reached, the samples were decompressed down to ambient conditions (see Fig. S1†).
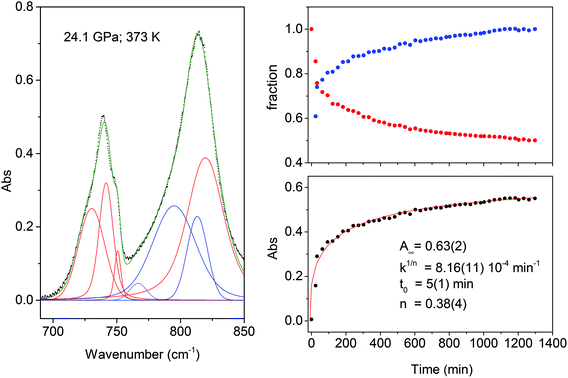
Finally, in the last panel of Fig. 5 we report the total area of the product band vs. reaction time and the relative fit performed using Avrami's law. In this case the relation is written as:
| A(t) = A∞e[−k(t−t0)n] | (2) |
X-ray diffraction
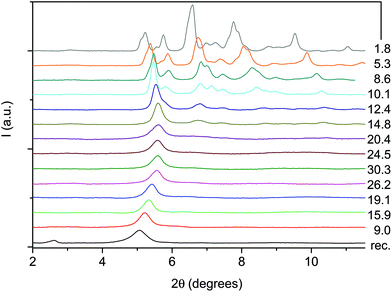
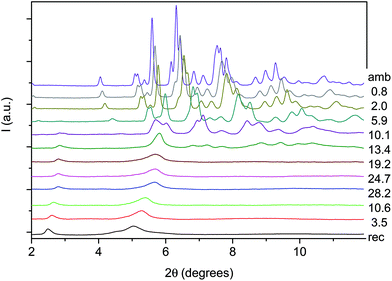
An angle dispersive X-ray diffraction (ADXRD) synchrotron study, recently carried out as a function of pressure on the parent TA crystal, disclosed the structure–reaction relationship identifying the direction along which the molecules interact to form the double core carbon nanothreads.36 The reaction is anticipated by a reversible phase transition occurring at around 9.5 GPa when the TA powder is quasi-hydrostatically compressed, and at slightly lower pressure, ∼7 GPa, when no pressure transmitting medium is employed. This transition consists of a sudden increase, of 5–6 degrees, of the monoclinic angle and a decrease of the b length, leading to a volume reduction of about 12%. After the transition all the cell parameters remain practically unchanged with the exception of the b length that shortens further ∼7% up to 19 GPa. As a consequence, the distance among nearly parallel phenyl rings along the b axis is estimated, once the phonon dynamics is taken into account,30,53,54 to be 2.5 Å at around 19–20 GPa pressure where we locate the reaction onset, a distance short enough to allow the formation of inter-ring C–C σ-bonds. The b axis is therefore identified as a preferential axis for reaction propagation, thus becoming the nanothread axis.According to the isomorphism existing among the pseudo-stilbenes class crystals, similar behavior is expected also for TS and TS–TA mixed crystals. As reported in S2,† the initial patterns could be successfully and completely assigned using the monoclinic P21/c structure suitable for both TS42,43 and TS–TA mixed crystals.44 The pressure evolution of the integrated patterns of pure TS and TS–TA mixed samples compressed without pressure transmitting medium is reported in Fig. 6 and 7. In both cases it is evident, as already observed for pure TA,36 a rapid deterioration of the pattern quality between 6 and 10 GPa, and the correlation existing between the higher angle diffraction peak of the product, one of the two observable after decompression, and specific reflections of the monomeric crystal. In addition, the lowest 2θ reflection of the product is already visible, especially in the TS–TA mixed crystal, far below the reaction onset, which is precisely located by the FTIR absorption measurements, thus evidencing the close relation between the molecular arrangement in the high-pressure phase and in the nanothread.
In spite of a Rietveld refinement being prevented above 6 GPa by the powder quality, strongly preferred orientation and non-hydrostatic stress, a monoclinic structure provides the best fit of the observed diffraction peaks position (see S2†). Accordingly, we determined the lattice parameters and the volume at each pressure value, and their evolution with pressure is reported in Fig. 8 and compared to those- of relatively pure TA crystal data.36 Although the data are considerably scattered, a sudden jump of the monoclinic angle, about 5 degrees, is evident between 9 and 10 GPa, pressure range where the volume also presents a discontinuity. Both features, particularly evident in the TS crystal, suggest the occurrence of a phase transition. Above this pressure, despite the additional difficulties for indexing the patterns due to the probable presence of a mixture of phases with overlapping peaks, all the parameters are nearly constant with the exception of the b axis which instead undergoes a remarkable reduction, especially in the case of a mixed TS–TA crystal, which appears as the only cause of the further volume decrease. All these features are common to all the investigated TA, TS and mixed crystals.
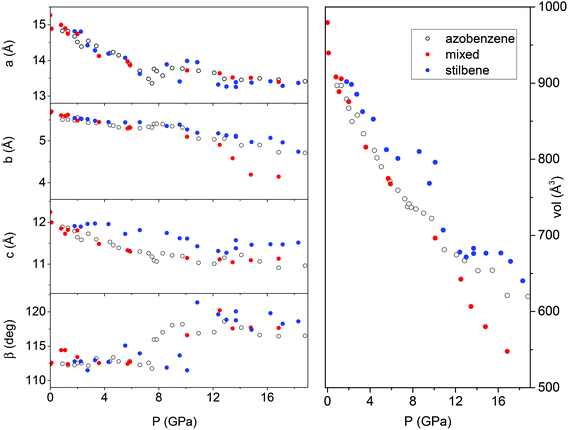 | ||
| Fig. 8 Pressure evolution of the lattice parameters as derived by Le Bail refinement of the XRD integrated patterns of TA, TS and TS–TA mixed crystals all compressed without the pressure transmitting medium. The data for TA crystals are from ref. 36. | ||
Recovered materials
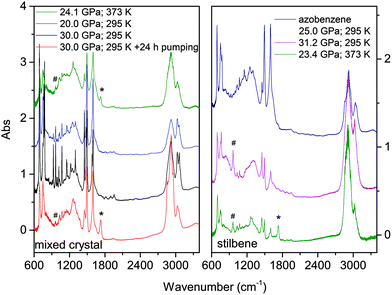
The materials synthesized in different experiments have been recovered under ambient conditions and characterized by FTIR spectroscopy, XRD and high-resolution TEM. We also attempted to measure Raman spectra but the huge fluorescence background and the sudden damage of the sample using a few mW at 660 nm prevented this characterization. Once the decompression was completed, FTIR spectra were measured before and after cell opening, and after keeping the recovered materials in vacuum for several hours to remove a consistent amount of the residual monomer. FTIR spectroscopy was also used to test over time the chemical stability of the recovered materials which was found unaltered after several weeks of the opening of the cell. In Fig. 9 we report the IR absorption spectra of representative TS and TS–TA samples recovered from both room and high temperature experiments.As expected from the only partial transformation of the starting crystal during the reaction, about 30%, monomer bands are observed in the quenched material. This is clearly visible in the left panel of Fig. 9 by comparing the black and red traces which are relative to the same sample recovered under ambient conditions but registered before opening the cell, and after the cell aperture and after pumping the sample for several hours to remove the unreacted monomer. Interestingly, a new band appears in many samples after cell opening at 1730 cm−1, a feature that can be assigned to the formation of a very small amount of carbonyl terminations. The spectral similarities among the materials recovered from the transformation of pure TS, TA and TS–TA mixed crystals clearly indicate common bonding characteristics and hybridization of the carbon atoms pointing to the successful synthesis of double-core carbon nanothreads. Particular differences are represented by the strong intensity of the high frequency doublet (1495 and 1600 cm−1) in the products from TS–TA mixed crystals observed also in pure TA deriving from the contribution of the N![[double bond, length as m-dash]](https://www.rsc.org/images/entities/char_e001.gif) N stretching mode connecting the double nanothreads,35 and by the peak just above 960 cm−1 clearly visible in the product of TS (marked by hashes) and slightly weaker in that from mixed TS–TA crystals. This band is characteristic of the CH wagging mode of trans-dialkyl ethylene groups,55 thus providing evidence of the ethylenic group preservation in the final product in perfect agreement to that observed in azobenzene.35
N stretching mode connecting the double nanothreads,35 and by the peak just above 960 cm−1 clearly visible in the product of TS (marked by hashes) and slightly weaker in that from mixed TS–TA crystals. This band is characteristic of the CH wagging mode of trans-dialkyl ethylene groups,55 thus providing evidence of the ethylenic group preservation in the final product in perfect agreement to that observed in azobenzene.35
The formation of double-core carbon nanothreads linked by ethylenic and azo groups is also supported by the ADXRD patterns of the samples quenched under ambient conditions. The spotty nearly hexagonal XRD pattern, always taken as evidence of the 2D ordered packing in the plane perpendicular to the nanothread axis,15,16,29,35 characterizes many of the recovered products. Some of these patterns are reported in Fig. 10. They are fully compatible with those obtained in pure TA where the double nanothreads were arranged in a distorted pseudo-hexagonal 2D lattice with axes of 13.05 and 6.45 Å, forming an angle very close to 120°.35,36 This structure was identified by three diffraction peaks, (001), (10−1) and (100) adopting the same axes choice as in ref. 36, whose position in the pure TA case is also indicated by dashed lines in Fig. 10. From the comparison of the different recovered materials an appreciable dispersion of the peak position is observed, varying from 5.6 to 6.0 and from 10.8 to 11.4 Å for the (001) and (100) reflections, respectively. As already reported in the TA case, the width of the (001) and (10−1) reflections are narrower than (100) which, in turn, is often asymmetric or even split. All these features are likely related to the presence of some type of disorder in the 2D arrangement particularly pronounced along the longer axis, however, they cannot be rationalized on the basis of the P–T conditions of the synthesis and are suggestive of a greater complexity ruling the nanothread packing. It is also important to recall that the beam dimension used (∼80 and ∼150 μm for the experiments conducted at Xpress and in-house, respectively) probes, almost the entire sample, thus providing an average information about the structural properties of the sample. As shown in Fig. 10 not all the recovered materials present hexagonal spotty patterns, but in many cases they are characterized by homogeneous diffraction rings indicating a powdered sample showing no evidence of preferred orientations. This occurrence is strictly related to the pressure of the synthesis and to the characteristics of starting samples; at lower pressure and larger monomer crystallites, better defined hexagonal spotty patterns are obtained. In contrast, when the sample was finely ground, as in the case of the two TS–TA mixed crystals shown in Fig. 10, perfect homogeneous rings were obtained.
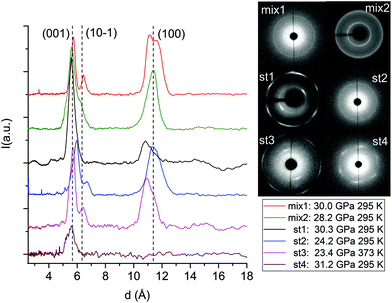 | ||
| Fig. 10 1D azimuthally integrated diffraction patterns reported as a function of the d spacing measured under ambient conditions for the samples recovered by different experiments with both pure TS and TS–TA mixed crystals. On the right side the corresponding 2D images are also reported. Samples mix2 and st1 have been acquired with synchrotron light whereas all the remaining patterns have been recorded with the in-house set-up. The baseline of integrated patterns has been obtained by subtracting the Compton background. The three dashed lines indicate the position of the (001), (10−1) and (100) diffraction peaks of the distorted pseudo-hexagonal 2D monoclinic cell in which the azobenzene nanothreads are arranged.35,36 The pressures and temperatures reported in the legend are relative to the conditions under which the reaction was performed. | ||
We also checked the effect of thermal annealing on the structural characteristics of the recovered material by heating in a vacuum to 433 K the product of the reaction performed at 23.4 GPa and 373 K in pure TS (st3 in Fig. 10). The sample was kept for approximately one hour at the annealing temperature while we monitored the IR spectrum to check possible chemical changes that were not detected. The ADXRD pattern, recorded once the ambient temperature was recovered (S2), did not show significant changes in the lineshape of the different peaks indicating that no substantial improvement of the threads and of the lattice quality is achieved. On the other hand, a consistent increase in the d spacings (0.2–0.3 Å) takes place likely ascribable to the relaxation of the residual stress inherent to the compression–decompression cycle and to the chemical transformation.
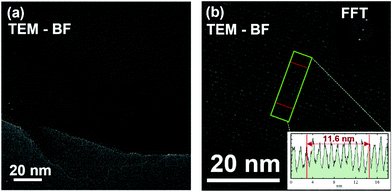
A better definition of the extension and quality of the nanothread produced in the reaction of pure TS and mixed TS–TA crystals is provided by high resolution transmission electron microscopy (HRTEM). In Fig. 11, we report some selected TEM micrographs collected for the product obtained by the reaction of TS performed at 373 K and 23.3 GPa. The fragments analyzed have been obtained by grinding into small pieces the samples recovered from the different experiments and the thinner ones have been selected to maximize the transmission. As already observed in other cases and in agreement with the only partial chemical transformation of the pristine crystal, we have found large areas dominated by the presence of amorphous hydrogenated carbon (S3) and sample portions showing perfectly parallel features located at an average distance of 1.16 nm therefore in perfect agreement with the (100) diffraction peak measured by XRD (Fig. 11). These ordered regions extend for tens of nanometers. The presence of two product typologies is reasonable in view of the competing mechanisms which characterize these reactions. Moreover, the presence of amorphous regions could also be ascribed to the not yet clear interactions between nanothreads and the electron beam. In the present experiment we have used a JEOL ARM200F, operating at an accelerating voltage of 60 kV, to avoid the knock-on damage. It has been shown that at this voltage, well below the critical voltage of 80 kV,56 the knock-on damage in graphene is practically zero. In benzene derived nanothreads an expansion of the 2D lattice arrangement has been detected for electron doses larger than 30 electrons per Å2 (ref. 57) thus evidencing the importance of this issue. As a matter of fact, even at a low voltage the periodicity observable in Fig. 11 disappeared after some minute of exposure, indicating a possible amorphization induced by the electron beam.
As a final step of our analysis we optimized the structure and computed, using density functional theory (DFT), the energy and the IR spectra of the nanothread composed of six molecular units. Among the four polymeric structures identified as the most probable, tube (3,0), polymer I, polytwistane and zipper,28,58 we can rule out the last two because they are incompatible with the formation of double nanothreads as extensively discussed in the azobenzene case.35 The Gibbs energy obtained for TS and TS–TA oligomers (S4) after subtracting the electronic contribution and that, of a vibrational nature, related to the different number of hydrogen atoms required to saturate the chain terminations (six more H in the tube (3,0) with respect to polymer I), is lower for the polymer I structure both for TS (0.58 eV) and TS–TA 1![[thin space (1/6-em)]](https://www.rsc.org/images/entities/char_2009.gif) :
:![[thin space (1/6-em)]](https://www.rsc.org/images/entities/char_2009.gif) 1 oligomers (2.54 eV). Remarkably, in both oligomers with the tube (3,0) structure the azo and ethylenic groups linking the threads are polymerized along the thread direction driven by the bonding geometry of the carbon atom of the thread to which the linker group is connected (see Fig. S9†). This occurrence determines relevant differences in the computed spectra of the tube (3,0) and polymer I oligomers consisting of the intensification of the region between 1000 and 1400 cm−1 in the tube (3,0) structure, whereas the strong bands around 800 cm−1, present in the computed spectra of polymer I and assigned to bending modes involving the hydrogen atoms bound to the ethylenic groups, consistently disappear. As shown in the ESI† the comparison between the computed IR spectra and those of recovered nanothreads from the experiment sharply indicates that polymer I is the preferred structure. The latter is shown, together with the suggested zipping mechanism, in Fig. S10.†
1 oligomers (2.54 eV). Remarkably, in both oligomers with the tube (3,0) structure the azo and ethylenic groups linking the threads are polymerized along the thread direction driven by the bonding geometry of the carbon atom of the thread to which the linker group is connected (see Fig. S9†). This occurrence determines relevant differences in the computed spectra of the tube (3,0) and polymer I oligomers consisting of the intensification of the region between 1000 and 1400 cm−1 in the tube (3,0) structure, whereas the strong bands around 800 cm−1, present in the computed spectra of polymer I and assigned to bending modes involving the hydrogen atoms bound to the ethylenic groups, consistently disappear. As shown in the ESI† the comparison between the computed IR spectra and those of recovered nanothreads from the experiment sharply indicates that polymer I is the preferred structure. The latter is shown, together with the suggested zipping mechanism, in Fig. S10.†
The present results unambiguously outline the common behavior that TA, TS and TS–TA mixed crystals exhibit as far as the structural evolution with pressure, the instability thresholds and the reaction mechanisms are concerned. Pressures in excess of 20 GPa are necessary to induce the chemical transformation of 15–30% of the monomer with an appreciable rate (2–3 days). Kinetic data acquired during the transformation of the mixed TS–TA crystals attest high selectivity of the process. The resulting saturated carbon nanothread is stable in time under ambient conditions likely adopting, on the basis of the comparison between the computed IR spectra of short oligomers and those of the recovered materials, the polymer I structure. The reaction is anticipated, as reported in the case of azobenene,36 by a sluggish phase transition observed both in TS and in TS–TA mixed crystals between 7 and 10 GPa when no hydrostatic pressure transmitting medium is employed. The transition to the new phase is characterized by an increase of the monoclinic angle to about 120° and a consistent reduction of the unit cell due to the strong contraction occurring along the b axis. A further compression of the new phase produces a marked anisotropic cell contraction along the b axis, a feature particularly evident in the mixed crystal where both the volume and the b parameter undergo to a 20% reduction between 9 and 16 GPa. Despite the pressure of the phase transition being much lower (about 10 GPa) than the reaction onset, which is accurately identified by IR absorption spectroscopy (see Fig. 2), it is unquestionable that the corresponding changes are strictly related to the reaction since the b axis indeed coincides with the direction along which the nanothreads develop. This phase transition, firstly reported in TA, was suggested to be a kind of prereactive stage where the equivalent molecules aligned along the b axis form stacks of nearly parallel molecules interacting through the π densities.36 A quantification of the entire process requires single crystal studies compressed in hydrostatic pressure transmitting media like helium or neon or, this can alternatively, indirectly be proved by the remarkable change in the electronic properties that such interactions likely entail.59
As expected, according to the isomorphism characterizing the pseudo-stilbene crystals, the nanothreads obtained from TS and TS–TA mixed crystals arrange in a 2D crystal lattice with the same packing reported in the azobenzene case.35 In that case the lattice parameters of the 2D monoclinic cell were a = 6.46 Å; c = 13.05 Å and β = 120°, whereas here we found for TS: a = 6.4–6.8 Å and c = 12.5–13.0 Å; whereas for TS–TA mixed crystals: a = 6.5–6.6 Å and c = 13.0–13.2 Å, with β = 120° in both cases. The larger range of observed values in the TS case is only due to the largest number of samples investigated. Thermal annealing of the recovered carbon nanothread is accompanied by a limited (≤5%) structural relaxation of the 2D arrangement whereas no effects are detectable in the thread structure. The high resolution TEM images confirm the formation of large areas, extending also several tens of nanometers, characterized by regular stripes in the product obtained by TS. In this case it was possible to identify the in-plane separation between the threads of 1.16 nm in excellent agreement with the data from XRD. Interestingly, in spite of XRD providing the same information for all the samples, we were not able to identify in the samples recovered from the reaction in the TS–TA mixed crystals any region where the striped pattern characterizing the nanothreads was visible in the TEM images. The reason can be related to the reduced accessible portion of the sample, only the thinner fragments can be studied and to the microprobing intrinsically characterizing the technique, or to the lower damage threshold of this material.
Conclusions
In this work we have demonstrated the possibility of synthesizing double-core carbon nanothreads from the most representative molecules of the pseudo-stilbene class both from pure and mixed crystals. In all the cases, azo and ethylene groups linking the two threads are preserved during the reaction, an impressive achievement in view of designing new materials where these groups can be possibly employed for further functionalization and can define targeted electronic properties. The extent of this result is further highlighted by the ease of obtaining mixed crystals of the desired relative concentration by exploiting the isomorphism of all the pseudo-stilbenes. In addition, the use of starting molecules where substituents are present in the phenyl rings may open the way to selective functionalization of the thread itself. The large number of industrial and biomedical applications of nanodiamonds helped in getting an idea of the potential of this new material. In fact, besides exhibiting similar enhanced mechanical and thermal properties, the possibility to produce bundles of micron size fibers opens the way to their use as real fibers where, as in the case of the double-core nanothreads reported here, the threads represent an efficient protective sheath of chromophores introduced in the desired concentration by adjusting the starting composition of the crystal.Methods
Crystalline TS from Sigma-Aldrich (purity >99%) was used without any further treatment. TS–TA mixed crystals were prepared by dissolving in acetone the two crystalline powders (TA from Sigma-Aldrich purity >99%) in the desired ratio. The saturated solution was filtered and then slowly (3–4 days) evaporated until a single light red crystal, having a size of several millimeters, formed. All the samples were produced by milling fragments of this crystal and the powder obtained was loaded without any compression medium into a membrane diamond anvil cell (MDAC) equipped with IIas type diamonds (Almax-Easylab) together with a ruby chip for pressure calibration by the ruby fluorescence method.60 Samples were laterally contained by stainless steel gaskets drilled to have an initial sample diameter of 150 μm and a thickness of about 50 μm. A high temperature was obtained by resistive heating, and the sample temperature was measured with a K-type thermocouple placed close to the diamonds with a 0.1 K accuracy.Angle-dispersive synchrotron X-ray diffraction measurements were performed on the recovered products at the Xpress beamline at the Elettra Italian synchrotron with a beam energy of 25.0 keV, a focal spot diameter of about 80 μm (FWHM) and an image plate detector (MAR345). In-house X-ray diffraction measurements were performed with a custom made, laboratory diffractometer, equipped with a focused Xenocs-GeniX Mo small spot microsource with a wavelength of 0.7107 Å and a beam diameter on the focal plane of 150 μm. A PI-SCX 4300 CCD was employed as the detector. Le Bail fittings were performed using the GSAS-II program.61
Fourier transform infrared absorption spectra were recorded using a Bruker-IFS 120 HR spectrometer suitably modified for experiments in a diamond anvil cell, with an instrumental resolution set to 1 cm−1.62 Ruby fluorescence was excited using a few mW of a 532 nm laser line from a doubled Nd:YAG laser source.
Transmission electron microscopy (TEM) investigation was performed with a JEOL ARM200F Cs-corrected microscope, equipped with a cold-field emission gun having an energy spread of 0.3 eV and operating at 60 keV. In conventional TEM (CTEM) mode, micrographs have been acquired in bright field (BF), while in STEM mode imaging has also been performed in the Z-contrast mode using a high-angle annular dark field (HAADF) detector, with a probe size of 1.0 Å. The recovered material was mechanically removed from the gasket with a needle and placed directly onto the surface of a standard TEM lacey carbon film, covering a 300-mesh copper grid.
Quantum chemistry calculations were performed using the Gaussian16 software63 to obtain the optimized structures and vibrational frequencies for the isolated fully sp3 nanothread fragments composed of six molecular units having polymer I and the tube (3,0) structures. The calculations were performed using density functional theory (DFT), adopting Becke's three-parameter hybrid exchange functional and Lee–Yang–Parr correlation functional (B3LYP)64,65 using the 6-311G(d,p) basis set. No imaginary vibrational frequencies were obtained indicating that the optimized vacuum geometries were at the minimum of the potential surface.
Conflicts of interest
There are no conflicts to declare.Acknowledgements
We thank the European Laboratory for Nonlinear Spectroscopy (LENS) for hosting the research, the Deep Carbon Observatory and the “Fondazione CR Firenze” for strong support. The research has been supported by the following grants: Extreme Physics and Chemistry of Carbon: Forms, Transformations, and Movements in Planetary Interiors funded by the Alfred P. Sloan Foundation; Fondazione Cassa di Risparmio di Firenze under the project “Utilizzo dell'anisotropia strutturale nella sintesi di nanofili di carbonio diamond-like ad alta pressione”. The TEM analyses were performed at Beyond-Nano laboratory of the CNR-IMM, which is supported by the Italian Ministry of Education and Research (MIUR) under the “Beyond-Nano” project (PON a3_00363). This project has received funding from the European Union's Horizon 2020 research and innovation programme under grant agreement no. 823717 – ESTEEM3. We also thank the Elettra Italian synchrotron for hosting our experiment under the proposal number 20200230.References
-
Carbon Nanomaterials: Modeling, Design, and Applications, ed. K. Zhou, CRC Press, Boca Raton, Florida, 2nd edn, 2019 Search PubMed
.
-
Carbon Nanomaterials, ed. Y. Gogotsi and V. Presser, CRC Press, Boca Raton, Florida, 2nd Ed., 2017 Search PubMed
.
-
Carbon Nanomaterials for Advanced Energy Systems, ed. W. Lu, J.-B. Baek and L. Da, John Wiley & Sons, Inc., Hoboken, New Jersey, 2015 Search PubMed
.
- A. C. Ferrari,
et al.
, Nanoscale, 2015, 7, 4587–5062 RSC
.
- J. L. Blackburn, A. J. Ferguson, C. Cho and J. C. Grunlan, Adv. Mater., 2018, 30, 1704386 CrossRef PubMed
.
- T. Lv, M. Liu, D. Zhu, L. Gan and T. Chen, Adv. Mater., 2018, 30, 1705489 CrossRef PubMed
.
- V. N. Mochalin, O. Shenderova, D. Ho and Y. Gogotsi, Nat. Nanotechnol., 2011, 7, 11–23 CrossRef PubMed
.
- R. E. Roman, K. Kwan and S. W. Cranford, Nano Lett., 2015, 15, 1585–1590 CrossRef CAS PubMed
.
- D. Stojkovic, P. Zhang and V. H. Crespi, Phys. Rev. Lett., 2001, 87, 125502 CrossRef CAS PubMed
.
- X.-D. Wen, R. Hoffmann and N. W. Ashcroft, J. Am. Chem. Soc., 2011, 133, 9023–9035 CrossRef CAS PubMed
.
- S. R. Barua, H. Quanz, M. Olbrich, P. R. Schreiner, D. Trauner and W. D. Allen, Chem. – Eur. J., 2014, 20, 1638–1645 CrossRef CAS PubMed
.
- T. C. Fitzgibbons, M. Guthrie, E. S. Xu, V. H. Crespi, S. K. Davidowski, G. D. Cody, N. Alem and J. V. Badding, Nat. Mater., 2015, 14, 43–47 CrossRef CAS PubMed
.
- H. Zhan, G. Zhang, J. M. Bell, V. B. C. Tan and Y. Gu, Nat. Commun., 2020, 11, 1905 CrossRef CAS PubMed
.
- H. Zhan, G. Zhang, G. Zhuang, R. Timon and Y. Gu, Carbon, 2020, 165, 216–224 CrossRef CAS
.
- X. Li, T. Wang, P. Duan, M. Baldini, H.-T. Huang, B. Chen, S. J. Juhl, D. Koeplinger, V. H. Crespi, K. Schmidt-Rohr, R. Hoffmann, N. Alem, M. Guthrie, X. Zhang and J. V. Badding, J. Am. Chem. Soc., 2018, 140, 4969–4972 CrossRef CAS PubMed
.
- S. Fanetti, M. Santoro, F. Alabarse, E. Berretti and R. Bini, Nanoscale, 2020, 12, 5233–5242 RSC
.
- M. M. Nobrega, E. Teixeira-Neto, A. B. Cairns, M. L. A. Temperini and R. Bini, Chem. Sci., 2018, 9, 254–260 RSC
.
- A. Biswas, M. D. Ward, T. Wang, L. Zhu, H.-T. Huang, J. V. Badding, V. H. Crespi and T. A. Strobel, J. Phys. Chem. Lett., 2019, 10, 7164–7171 CrossRef CAS PubMed
.
- S. Huss, S. Wu, B. Chen, T. Wang, M. C. Gerthoffer, D. J. Ryan, S. E. Smith, V. H. Crespi, J. V. Badding and E. Elacqua, ACS Nano, 2021, 15, 4134–4143 CrossRef CAS PubMed
.
- W. S. Tang and T. A. Strobel, J. Phys. Chem. C, 2020, 124, 25062–25070 CrossRef CAS
.
- M. D. Ward, W. S. Tang, L. Zhu, D. Popov, G. D. Cody and T. A. Strobel, Macromolecules, 2019, 52, 7557–7563 CrossRef CAS
.
- A. Friedrich, I. E. Collings, K. Dziubek, S. Fanetti, K. Radacki, J. Ruiz-Fuertes, J. Pellicer-Porres, M. Hanfland, D. Sieh, R. Bini, S. J. Clark and T. B. Marder, J. Am. Chem. Soc., 2020, 142, 18907–18923 CrossRef CAS PubMed
.
- M. C. Gerthoffer, S. Wu, B. Chen, T. Wang, S. Huss, S. M. Oburn, V. H. Crespi, J. V. Badding and E. Elacqua, Chem. Sci., 2020, 11, 11419–11424 RSC
.
- H.-T. Huang, L. Zhu, M. D. Ward, T. Wang, B. Chen, B. L. Chaloux, Q. Wang, A. Biswas, J. L. Gray, B. Kuei, G. D. Cody, A. Epshteyn, V. H. Crespi, J. V. Badding and T. A. Strobel, J. Am. Chem. Soc., 2020, 142, 17944–17955 CrossRef CAS PubMed
.
- P. G. Demingos and A. R. Muniz, Carbon, 2018, 140, 644–652 CrossRef CAS
.
- J. F. R. V. Silveira and A. R. Muniz, Phys. Chem. Chem. Phys., 2017, 19, 7132–7137 RSC
.
- P. G. Demingos, N. M. Balzaretti and A. R. Muniz, Phys. Chem. Chem. Phys., 2021, 23, 2055–2062 RSC
.
- B. Chen, R. Hoffmann, N. W. Ashcroft, J. Badding, E. S. Xu and V. H. Crespi, J. Am. Chem. Soc., 2015, 137, 14373–14386 CrossRef CAS PubMed
.
- X. Li, M. Baldini, T. Wang, B. Chen, E. S. Xu, B. Vermilyea, V. H. Crespi, R. Hoffmann, J. J. Molaison, C. A. Tulk, M. Guthrie, S. Sinogeikin and J. V. Badding, J. Am. Chem. Soc., 2017, 139, 16343–16349 CrossRef CAS PubMed
.
- S. Fanetti, M. M. Nobrega, E. Teixeira-Neto, M. L. A. Temperini and R. Bini, J. Phys. Chem. C, 2018, 122, 29158–29164 CrossRef CAS
.
- P. Duan, X. Li, T. Wang, B. Chen, S. J. Juhl, D. Koeplinger, V. H. Crespi, J. V. Badding and K. Schmidt-Rohr, J. Am. Chem. Soc., 2018, 140, 7658–7666 CrossRef CAS PubMed
.
- S. J. Juhl, T. Wang, B. Vermilyea, X. Li, V. H. Crespi, J. V. Badding and N. Alem, J. Am. Chem. Soc., 2019, 141, 6937–6945 CrossRef CAS PubMed
.
- H. Zhan, G. Zhang, V. B. C. Tan, Y. Cheng, J. M. Bell, Y. W. Zhang and Y. Gu, Nanoscale, 2016, 8, 11177–11184 RSC
.
- P. G. Demingos and A. R. Muniz, J. Phys. Chem. C, 2019, 123, 3886–3891 CrossRef CAS
.
- S. Romi, S. Fanetti, F. Alabarse, A. M. Mio and R. Bini, Chem. Sci., 2021, 12, 7048–7057 RSC
.
- S. Romi, S. Fanetti, F. Alabarse and R. Bini, J. Phys. Chem. C, 2021, 125, 17174–17182 CrossRef CAS
.
- E. Wagner-Wysiecka, N. Łukasik, J. F. Biernat and E. Luboch, J. Inclusion Phenom. Macrocyclic Chem., 2018, 90, 189–257 CrossRef CAS PubMed
.
- D. Bléger and S. Hecht, Angew. Chem., Int. Ed., 2015, 54, 11338–11349 CrossRef PubMed
.
- S. Crespi, N. A. Simeth and B. König, Nat. Rev. Chem., 2019, 3, 133–146 CrossRef CAS
.
- M. Dong, A. Babalhavaeji, S. Samanta, A. A. Beharry and G. A. Woolley, Acc. Chem. Res., 2016, 7, 11090 Search PubMed
.
- M. Döbbelin,
et al.
, Nat. Commun., 2015, 48, 2662–2670 CrossRef PubMed
.
- J. A. Bouwstra, A. Schouten and J. Kroon, Acta Crystallogr., Sect. C: Cryst. Struct. Commun., 1983, 39, 1121–1123 CrossRef
.
- J. A. Bouwstra, A. Schouten, J. Kroon and R. B. Helmholdt, Acta Crystallogr., Sect. C: Cryst. Struct. Commun., 1984, 40, 428–431 CrossRef
.
- J. A. Bouwstra, A. Schouten, J. Kroon and R. B. Helmholdt, Acta Crystallogr., Sect. C: Cryst. Struct. Commun., 1985, 41, 420–426 CrossRef
.
- J. Harada and K. Ogawa, J. Am. Chem. Soc., 2004, 126, 3539–3544 CrossRef CAS PubMed
.
- Z. Meić and H. Güsten, Spectrochim. Acta, Part A, 1978, 34, 101–111 CrossRef
.
- M. Avrami, J. Chem. Phys., 1939, 7, 1103–1112 CrossRef CAS
.
- M. Avrami, J. Chem. Phys., 1940, 8, 212–224 CrossRef CAS
.
- M. Avrami, J. Chem. Phys., 1941, 9, 177–184 CrossRef CAS
.
- S. F. Hulbert, J. Br. Ceram. Soc., 1969, 6, 11–20 CAS
.
-
R. Bini and V. Schettino, Materials Under Extreme Conditions: Molecular Crystals at High Pressure, Imperial College Press, London, 2013 Search PubMed
.
- S. Romi, S. Fanetti and R. Bini, J. Phys. Chem. B, 2020, 124, 8149–8157 CrossRef CAS PubMed
.
- L. Ciabini, M. Santoro, R. Bini and V. Schettino, J. Chem. Phys., 2002, 116, 2928–2935 CrossRef CAS
.
- M. Citroni, S. Fanetti, C. Bazzicalupi, K. Dziubek, M. Pagliai, M. M. Nobrega, M. Mezouar and R. Bini, J. Phys. Chem. C, 2015, 119, 28560–28569 CrossRef CAS
.
-
D. Lin-Vien, N. B. Colthup, W. G. Fateley and J. G. Grasselli, Handbook of Infrared and Raman Characteristic Frequencies of Organic Molecules, Academic Press, San Diego, CA, 1991 Search PubMed
.
- J. C. Meyer, F. Eder, S. Kurasch, V. Skakalova, J. Kotakoski, H. J. Park, S. Roth, A. Chuvilin, S. Eyhusen, G. Benner, A. V. Krasheninnikov and U. Kaiser, Phys. Rev. Lett., 2012, 108, 196102 CrossRef PubMed
.
- S. J. Juhl, T. Wang, B. Vermilyea, X. Li, V. H. Crespi, J. V. Badding and N. Alem, J. Am. Chem. Soc., 2019, 141, 6937–6945 CrossRef CAS PubMed
.
- B. Chen, T. Wang, V. H. Crespi, X. Li, J. Badding and R. Hoffmann, J. Chem. Theory Comput., 2018, 14, 1131–1140 CrossRef CAS PubMed
.
- M. Citroni, R. Bini, P. Foggi and V. Schettino, Proc. Natl. Acad. Sci. U. S. A., 2008, 105, 7658–7663 CrossRef CAS PubMed
.
- H. K. Mao, P. M. Bell, J. V. Shaner and D. J. Steinberg, J. Appl. Phys., 1978, 49, 3276 CrossRef CAS
.
- B. H. Toby and R. B. Von Dreele, J. Appl. Crystallogr., 2013, 46, 544–549 CrossRef CAS
.
- R. Bini, R. Ballerini, G. Pratesi and H. J. Jodl, Rev. Sci. Instrum., 1997, 68, 3154–3160 CrossRef CAS
.
-
M. J. Frisch, et al., Gaussian 16, Revision B.01, Gaussian, Inc., Wallingford CT, 2016 Search PubMed
.
- A. D. Becke, J. Chem. Phys., 1993, 98, 1372–1377 CrossRef CAS
.
- C. Lee, W. Yang and R. G. Parr, Phys. Rev. B: Condens. Matter Mater. Phys., 1988, 37, 785–789 CrossRef CAS PubMed
.
Footnote |
| † Electronic supplementary information (ESI) available. See DOI: 10.1039/d1nr08188h |
| This journal is © The Royal Society of Chemistry 2022 |

