 Open Access Article
Evidence for stereoelectronic effects in ligand exchange reactions on Au25 nanoclusters†
Yanan
Wang
 and
Thomas
Bürgi
 *
*
Department of Physical Chemistry, University of Geneva, 30 Quai Ernest-Ansermet, 1211 Geneva 4, Switzerland. E-mail: thomas.buergi@unige
First published on 24th January 2022
Abstract
Ligand exchange reaction (LER) is an important post-synthesis strategy and has been studied widely. The mechanism of this dynamic process for gold nanoclusters proved to be associative (SN2). Many factors affect the LER of clusters, including stability, solubility, chirality, electronic properties and so on. Some of these factors are not well understood and need further exploration. Here, we use a chiral fluoro-substituted ligand (R)-5,5′,6,6′,7,7′,8,8′-octafluoro-[1,1′-binaphthalene]-2,2′-dithiol (8F-R-BINAS) to investigate the stereoelectronic and stereospecific effects during LER on achiral Au25 cluster. It is demonstrated that the fluorine-substituted BINAS significantly decreases the LER reactivity both at the molecule and the related cluster level. The stereoelectronic effect is global and can be transmitted to the cluster surface. In contrast, the stereospecific effect is marginal.
Introduction
Monolayer-protected metal cluster, are ultra-small, large specific surface area multifunctional materials, and have gained large interest during the past decades.1 Among them, thiolate-protected gold nanoclusters are the most prominent attracting wide interest from chemists,2 biologist,3,4 and medical scientists. The progress in the field, for example, on precise synthesis,5–9 metal doping,10,11 and applications of gold nanoclusters has shown huge acceleration.12,13 In general, the chemical properties of gold nanoclusters, like solubility and interactions with the environment, mainly depend on the ligand shell. The latter also determines physical properties and how the clusters interact with cells.14,15 In order to impart complex properties to the nanoclusters, modifying the ligand shell with the desired function is a promising strategy. However, precise control of the ligand shell remains a challenge.Ligand substitution reactions, in which one or more ligands in a complex are replaced by a different ligand, is a conventional process in inorganic and organic chemistry.16–18 This reaction is also called ligand exchange reaction (LERs) in some fields. During the past decades, the mechanism of this dynamic process has been explored widely, and two possible pathways, dissociative (SN1) and associative (SN2), have been demonstrated.19–21 This process has been revealed for traditional transition metal-complexes or organic frameworks, but after that it also has been shown for thiolate-protected gold nanoclusters, as first studied by Murray and coworkers.22–27 Until now LERs developed into an important post-synthesis method, which has been used for extending the properties and functions of nanoclusters.27–29 Much research has also focused on the reaction sites of LERs and the related effects.30–36 In addition, the mechanism of LERs on nanoclusters is thought to follow an associative (SN2) pathway, according related experimental and computational studies.27,37,38 Understanding the mechanism and the factors that affect this reaction will help the design of atomically precise metal clusters with mixed ligand shells.
LERs on gold nanoclusters are strongly influenced by the chemical properties of the involved ligands and the flexibility of the gold–sulfur interface.39,40 Other factors involved in this dynamic process which affect the reaction rate are the stability of the samples,41 length of surface ligand,26 metal doping,42 diastereoselective interactions,43 and electronic properties of the ligand,24,44 and nanoclusters.23 In 2002, Murray and coworkers demonstrated that the rate of LERs increased with increasing positive electronic charge on the Au core.23 Later they also revealed that ligands with electron-withdrawing substituents reacted faster at shorter reaction time, and ligands with electron-donating substituents were more efficient at longer reaction times.24 However, other work revealed that the ligands with electron-donating groups reacted faster with the cluster.45 After two decades of research the influence of electronic structure on LER seems not completely understood, which calls for more effort.44 Furthermore, in contrast to the diastereoselective LERs with intrinsically chiral nanoclusters,43 the stereospecific effects in LERs of chiral ligands on achiral nanoclusters have not been quantified yet.
Here, using a chiral fluoro-substituted ligand (R)-5,5′,6,6′,7,7′,8,8′-octafluoro-[1,1′-binaphthalene]-2,2′-dithiol (named 8F-R-BINAS in the following), the electronic and stereospecific effects of the ligand during exchange the reaction on achiral Au25 will be systematically investigated. Compared with parent ligand 1,1′-binaphthalene-2,2′-dithiol (BINAS), the fluoro-substituted molecule exhibits higher electron-withdrawing ability without large size change. In addition, the rigid structures of the two chiral ligands also represent good models for the investigation of stereospecific effects. The distance between the two sulfur atoms in the BINAS molecule matches very well the distance between two sulfur atoms in the cluster. Also dithiol ligand prohibit the intercluster ligand exchange at room temperature. Therefore, BINAS is an excellent candidate for the LERs study. We show that the electronic property of ligand induces significant discrimination to the LERs, however, the absolute configuration of the ligand did not significantly affect the rate of exchange, at least at the early stage of exchange where only few chiral ligands are adsorbed on the achiral cluster.
Results and discussion
The Au25(2-PET)18 (2-PET: 2-phenylethylthiolate) nanocluster was synthesized according a previous protocol.46 The purity of the clusters was proved by the UV-vis spectroscopy (Fig. S1A†) and MALDI-mass spectrometry (Fig. S1B†). The chemical structures and corresponding CD spectra (except 2-PET) of ligands 2-PET, R/S-BINAS and 8F-R-BINAS are shown in Fig. S2.† The synthesis protocol of 8F-R-BINAS is displayed in Scheme S1† and followed a previous report.47 The 1H NMR spectrum of 8F-R-BINAS is provided in Fig. S3.†47To investigate the electronic effect of the ligand during the exchange process, Au25(2-PET)18 was first mixed with R-BINAS and 8F-R-BINAS separately. Toluene was used as solvent for the reaction, and the molar ratio of cluster to ligand was equal to 1![[thin space (1/6-em)]](https://www.rsc.org/images/entities/char_2009.gif) :
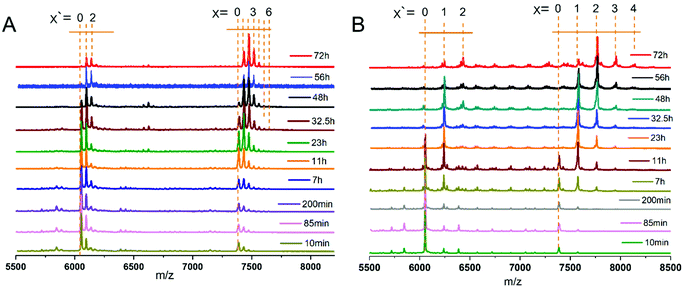
:![[thin space (1/6-em)]](https://www.rsc.org/images/entities/char_2009.gif) 20. A small amount of sample was taken from the reaction mixture at different reaction time and the corresponding MALDI-TOF mass spectra were recorded (Fig. 1). The calculated mass of different species after Au25(2-PET)18 exchange with BINAS (Fig. 1A) and 8F-R-BINAS (Fig. 1B) are listed in Table S1.† As confirmed before, BINAS acts as a bidentate ligand thus substituting two 2-PET ligands on the cluster.48,49 Ligand exchange numbers (x = number of BINAS/8F-R-BINAS in the ligand shell) are marked in Fig. 1. The clusters show fragmentation, notably by losing Au4(2-PET)4. The corresponding fragments are also visible in Fig. 1 and the related exchange numbers (x′) were also labelled. Since the fragments are formed during the MALDI measurement, the signals of the fragments were also considered for the quantitative analysis by adding them to the ones of the corresponding intact cluster.
20. A small amount of sample was taken from the reaction mixture at different reaction time and the corresponding MALDI-TOF mass spectra were recorded (Fig. 1). The calculated mass of different species after Au25(2-PET)18 exchange with BINAS (Fig. 1A) and 8F-R-BINAS (Fig. 1B) are listed in Table S1.† As confirmed before, BINAS acts as a bidentate ligand thus substituting two 2-PET ligands on the cluster.48,49 Ligand exchange numbers (x = number of BINAS/8F-R-BINAS in the ligand shell) are marked in Fig. 1. The clusters show fragmentation, notably by losing Au4(2-PET)4. The corresponding fragments are also visible in Fig. 1 and the related exchange numbers (x′) were also labelled. Since the fragments are formed during the MALDI measurement, the signals of the fragments were also considered for the quantitative analysis by adding them to the ones of the corresponding intact cluster.
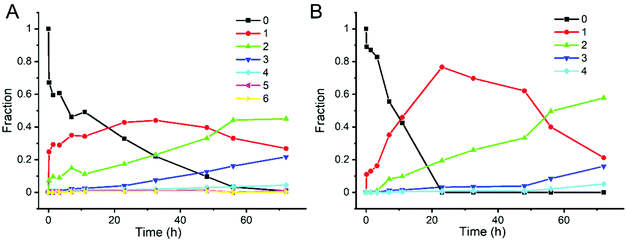
In order to study the kinetics of ligand exchange reactions, the intensity of mass peaks in Fig. 1 were quantified (taking into consideration also fragment peaks as mentioned above) and the results are given in Table S2† (Au25(2-PET)18 + R-BINAS) and Table S3† (Au25(2-PET)18 + 8F-R-BINAS). When reacted with R-BINAS, clusters with up to six R-BINAS ligands were observed after 72 h reaction time, whereas for the ligand exchange reaction with 8F-R-BINAS up to four 8F-R-BINAS ligands could be detected on the cluster. The fractions of the different cluster species were calculated, and their evolution as function of time are shown in Fig. 2. LER can be considered as a consecutive reaction, where a first ligand is exchanged followed by a second one etc. The equations for the related LERs are shown in the ESI (ESI Note 1†). The time-dependent concentration of the species with x = 1 (one BINAS/8F-R-BINAS in the ligand shell of the cluster), red data points in Fig. 2, depends on the two rate constants k1, which describes the first ligand exchange, and k2, which describes the second ligand exchange. The time dependence of the one ligand-substituted species (x = 1) was quantitatively different in the two cases. The maximum fractions of this species were 0.44 for the experiment with R-BINAS and 0.74 in the case of 8F-R-BINAS, which shows that the ratio of the rate constants k1/k2 is different for the two ligands. In order to extract these ratios, the abundance of the parent cluster and the cluster with one exchanged ligand in its shell were fit to a kinetics of a consecutive reaction (pseudo first order) using MATLAB (the code is shown in the ESI, Note 2†). The raw data extracted from the MALDI experiments are given in Tables S2 and S3,† and the fitting curves of these two LERs process are shown in Fig. S4.† From the fit it emerges that the related ratio of rate constants k1/k2 is 2.4 for LERs between Au25(2-PET)18 and R-BINAS, and changes to 4.7 when 8F-R-BINAS is used as the incoming ligand. This means that the second ligand exchange performed slower with 8F-R-BINAS compared to R-BINAS. The significant difference for these two ligands can also be discovered at the initial stage (before 5 h) of the exchange, where the species with two exchanged BINAS ligands (x = 2, green curve) can already be observed before 5 h (Fig. 2A), whereas for the experiment with 8F-R-BINAS the corresponding species arises after 5 h (Fig. 2B). In addition, also the species with three exchanged ligands were delayed for 8F-R-BINAS compared to BINAS. All these observations are consistent with an increasing slowing down of the further ligand exchange reaction once 8F-R-BINAS is incorporated in the ligand shell of the cluster.
The distinct difference in the LER with the two ligands, described above, is ascribed to the electronic effect of fluorine. The 8 fluorine atoms in 8F-R-BINAS have strong electron-withdrawing ability and change the electron density of the aromatic ring. After incorporation of 8F-R-BINAS into the ligand shell, the electronic effect may also extend to the whole cluster (surface). As mentioned before, the mechanism for ligand exchange reaction follows an associative (SN2) pathway.27 The first step for the ligand exchange is nucleophilic attack by the incoming thiol, creating a bimolecular intermediate. Consequently, the 8F-substituted BINAS molecule has lower electron density at the sulfur atom compared with BINAS, which decreases its ability to act as nucleophile. The data shown above indicates that the fluorinated ligand may also affect the reactivity of the cluster, decreasing its ability for subsequent ligand exchange. However, the electronic effect of fluorinated ligand on the clusters may be more complex.
To further study the different properties of BINAS and 8F-R-BINAS in LER and to better distinguish the electronic effects of the fluorinated ligand and the cluster containing the fluorinated ligand, mixtures of R-BINAS and 8F-R-BINAS were used. Here, the molar ratio of Au25(2-PET)18 clusters and free ligand was 1![[thin space (1/6-em)]](https://www.rsc.org/images/entities/char_2009.gif) :
:![[thin space (1/6-em)]](https://www.rsc.org/images/entities/char_2009.gif) 15, and the ratio between R-BINAS and 8F-R-BINAS was chosen as 1
15, and the ratio between R-BINAS and 8F-R-BINAS was chosen as 1![[thin space (1/6-em)]](https://www.rsc.org/images/entities/char_2009.gif) :
:![[thin space (1/6-em)]](https://www.rsc.org/images/entities/char_2009.gif) 2 and 1
2 and 1![[thin space (1/6-em)]](https://www.rsc.org/images/entities/char_2009.gif) :
:![[thin space (1/6-em)]](https://www.rsc.org/images/entities/char_2009.gif) 4, respectively in two separate experiments. The calculated mass values of the different cluster species after ligand exchange of Au25(2-PET)18 with R-BINAS and 8F-R-BINAS are listed in Table S4.† The MALDI-TOF spectra as a function of time for the experiment with 1
4, respectively in two separate experiments. The calculated mass values of the different cluster species after ligand exchange of Au25(2-PET)18 with R-BINAS and 8F-R-BINAS are listed in Table S4.† The MALDI-TOF spectra as a function of time for the experiment with 1![[thin space (1/6-em)]](https://www.rsc.org/images/entities/char_2009.gif) :
:![[thin space (1/6-em)]](https://www.rsc.org/images/entities/char_2009.gif) 4 R-BINAS
4 R-BINAS![[thin space (1/6-em)]](https://www.rsc.org/images/entities/char_2009.gif) :
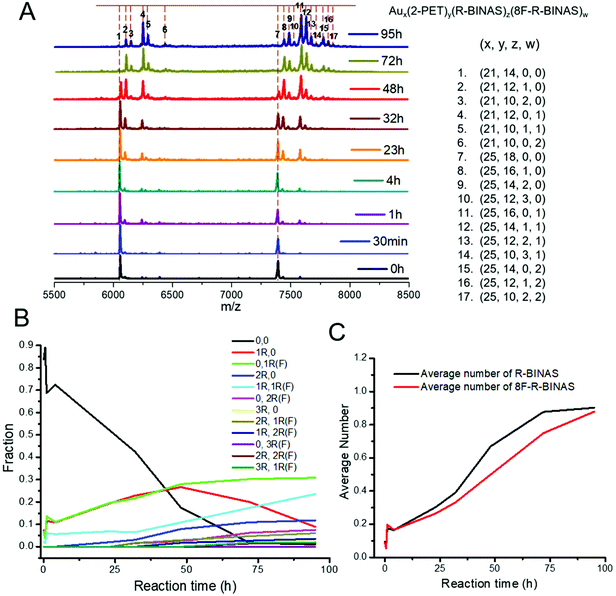
:![[thin space (1/6-em)]](https://www.rsc.org/images/entities/char_2009.gif) 8F-R-BINAS ratio are shown in Fig. 3A. The peaks have been labelled using numbers, and the corresponding compositions are given at the right side of the spectra. The mass peak intensities were determined and the percentage of different species were quantified and listed in Table S5.† For the calculation of the percentage, the fragmentation peaks (Au21 species) were also taken into account. The relative abundance of the different species as a function of time are illustrated in Fig. 3B. As expected the fraction of the parent cluster (marked as 0,0) decreased with time and the fractions related to ligand-exchanged species raised. More interesting is the comparison between the cluster species containing one R-BINAS (marked as 1R,0, red trace) and one 8F-R-BINAS molecule (marked as 0,1R(F), green trace) in their ligand shell. Whereas both species increase at about the same rate initially, the abundance of the species containing one R-BINAS ligand decreased again after about 50 h while the abundance of the cluster containing one 8F-R-BINAS ligand continued to increase. At the same time the cluster with both one R-BINAS and one 8F-R-BINAS (light blue line in Fig. 3B) increased strongly. The different behavior shows that the cluster containing one 8F-R-BINAS is less reactive compared to the cluster containing one R-BINAS ligand, which is ascribed to the effect of 8F-R-BINAS on the electronic properties of the cluster.
8F-R-BINAS ratio are shown in Fig. 3A. The peaks have been labelled using numbers, and the corresponding compositions are given at the right side of the spectra. The mass peak intensities were determined and the percentage of different species were quantified and listed in Table S5.† For the calculation of the percentage, the fragmentation peaks (Au21 species) were also taken into account. The relative abundance of the different species as a function of time are illustrated in Fig. 3B. As expected the fraction of the parent cluster (marked as 0,0) decreased with time and the fractions related to ligand-exchanged species raised. More interesting is the comparison between the cluster species containing one R-BINAS (marked as 1R,0, red trace) and one 8F-R-BINAS molecule (marked as 0,1R(F), green trace) in their ligand shell. Whereas both species increase at about the same rate initially, the abundance of the species containing one R-BINAS ligand decreased again after about 50 h while the abundance of the cluster containing one 8F-R-BINAS ligand continued to increase. At the same time the cluster with both one R-BINAS and one 8F-R-BINAS (light blue line in Fig. 3B) increased strongly. The different behavior shows that the cluster containing one 8F-R-BINAS is less reactive compared to the cluster containing one R-BINAS ligand, which is ascribed to the effect of 8F-R-BINAS on the electronic properties of the cluster.
Importantly, the average numbers of exchanged R-BINAS (black curve) and 8F-R-BINAS (red curve) in the cluster (Fig. 3C) are comparable in the course of the time, showing that the behavior described above is not due to the deactivation of the free 8F-R-BINAS ligand.
At R-BINAS![[thin space (1/6-em)]](https://www.rsc.org/images/entities/char_2009.gif) :
:![[thin space (1/6-em)]](https://www.rsc.org/images/entities/char_2009.gif) 8F-R-BINAS ratio of 1
8F-R-BINAS ratio of 1![[thin space (1/6-em)]](https://www.rsc.org/images/entities/char_2009.gif) :
:![[thin space (1/6-em)]](https://www.rsc.org/images/entities/char_2009.gif) 2 the behavior was found to be qualitatively similar (Fig. S5†). The MALDI-TOF spectra at species are listed in Table S6.† From the evolution plots of the different times are shown in Fig. S5A† and the derived values of different mass peaks and calculated fractions of the different species in these two experiments (Fig. 3B and Fig. S5B†), some conclusions can be drawn. By increasing the R-BINAS fraction from 20% (ratio 1
2 the behavior was found to be qualitatively similar (Fig. S5†). The MALDI-TOF spectra at species are listed in Table S6.† From the evolution plots of the different times are shown in Fig. S5A† and the derived values of different mass peaks and calculated fractions of the different species in these two experiments (Fig. 3B and Fig. S5B†), some conclusions can be drawn. By increasing the R-BINAS fraction from 20% (ratio 1![[thin space (1/6-em)]](https://www.rsc.org/images/entities/char_2009.gif) :
:![[thin space (1/6-em)]](https://www.rsc.org/images/entities/char_2009.gif) 4) to 33.3% (ratio 1
4) to 33.3% (ratio 1![[thin space (1/6-em)]](https://www.rsc.org/images/entities/char_2009.gif) :
:![[thin space (1/6-em)]](https://www.rsc.org/images/entities/char_2009.gif) 2), the species with one R-BINAS ligand (1R,0) becomes predominant. Furthermore, the species with two R-BINAS ligands (2R,0) exceeds the abundance of the hybrid species (1R,1R(F)), which is opposite at 1
2), the species with one R-BINAS ligand (1R,0) becomes predominant. Furthermore, the species with two R-BINAS ligands (2R,0) exceeds the abundance of the hybrid species (1R,1R(F)), which is opposite at 1![[thin space (1/6-em)]](https://www.rsc.org/images/entities/char_2009.gif) :
:![[thin space (1/6-em)]](https://www.rsc.org/images/entities/char_2009.gif) 4 ratio. At lower ratio, considerably more R-BINAS was incorporated in the ligand shell compared to 8F-R-BINAS, which is reflected in the average number of exchanged R-BINAS and 8F-R-BINAS, which is lower for the fluorinated ligand (Fig. S5C†). The observations described above are also in agreement with the associative pathway for the ligand exchange process, the rate constant being dependent on the concentration of incoming ligands.
4 ratio. At lower ratio, considerably more R-BINAS was incorporated in the ligand shell compared to 8F-R-BINAS, which is reflected in the average number of exchanged R-BINAS and 8F-R-BINAS, which is lower for the fluorinated ligand (Fig. S5C†). The observations described above are also in agreement with the associative pathway for the ligand exchange process, the rate constant being dependent on the concentration of incoming ligands.
The ligand exchange leads to some changes in the optical properties. The absorbance spectra of Au25 after reaction with R-BINAS or R-BINAS/8F-R-BINAS mixture have similar features as shown in Fig. S6A & B,† however, the characteristic features of Au25 become less distinct as the LER proceeds. The spectral changes seem more important for clusters containing 8F-R-BINAS (even for lower exchange numbers). In addition, the circular dichroism spectra of (Au25(2-PET)18−2x(R/S-BINAS)x and Au25(2-PET)18−2x−2y(R-BINAS)x(8F-R-BINAS)y) are provided in Fig. S6C.† The chiral ligands induce optical activity in the clusters. The bands at 350 nm and above are due to the cluster (and not due to transitions within the ligand alone), as comparison with the CD spectra of the ligands shows (see Fig. S2†). The incorporation of 8F-R-BINAS into the ligand shell does not lead to drastic changes of the CD spectrum. However, the band around 350 nm is shifted to higher wavelengths by about 10 nm for the cluster containing 8F-R-BINAS and the feature at around 475 nm is less pronounced. We should mentioned that, the average number of exchanged ligand for Au25(2-PET)18−2x−2y(R-BINAS)x(8F-R-BINAS)y is higher than for Au25(2-PET)18−2x(R/S-BINAS)x here. But the spectral changes also show that 8F-R-BINAS has some influence on the electronic structure of the cluster.
Since the two ligands show distinct behaviour in separate LERs, we may anticipate that using a mixture of the two ligands will not simply lead to a statistical distribution of the two ligands on the cluster. In other words, some combinations of ligands may be more (less) abundant than expected based on the average composition. In order to verify this hypothesis, we calculated the statistical distribution (multinomial distribution). For this we first determined the average composition (average x and average y) for a specific sample by considering all the detected species. Having these numbers from the experiment, one can determine the probabilities required for the calculation of the multinomial distribution. (The program code and related values of probabilities are shown in ESI Note 3.†) This can be done for every sample collected as a function of time during the experiment. We took the data extracted from the experiment shown in Fig. 3 (average number of exchanged R-BINAS and 8F-R-BINAS, Fig. 3C) to calculate the statistical distribution of the cluster species. It should be noted that this calculation requires knowledge of the total number of available sites. It has been shown that only up to seven BINAS ligands can adsorb on Au25 (Ag25) nanoclusters,50 due to steric hindrance, and therefore we chose seven as the number of available sites for the dithiols. The calculated statistical distributions of the different species are illustrated in Fig. S7.† The comparison between the experimental evolution of species and the evolution based on the statistical distribution are shown in Fig. 4.
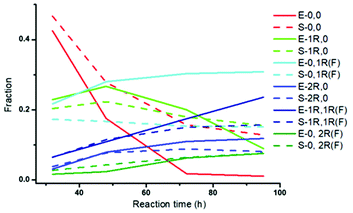 | ||
Fig. 4 Evolution of different species during Au25(2-PET)18 ligand exchange with R-BINAS and 8F-R-BINAS mixture as function of time. The solid curves are extracted from Fig. 3B (experimental (E) values, 1![[thin space (1/6-em)]](https://www.rsc.org/images/entities/char_2009.gif) : :![[thin space (1/6-em)]](https://www.rsc.org/images/entities/char_2009.gif) 4 R-BINAS to 8F-R-BINAS ratio) and the dash curves are calculated (S) by multinomial distribution program (ESI Note 2†). For clarity, only the species with at least two ligands exchanged are shown (other species are much less abundant) in the time range 32 h–95 h. 4 R-BINAS to 8F-R-BINAS ratio) and the dash curves are calculated (S) by multinomial distribution program (ESI Note 2†). For clarity, only the species with at least two ligands exchanged are shown (other species are much less abundant) in the time range 32 h–95 h. | ||
As demonstrated by Fig. 4, there are clear differences between experiment (solid curves, E) and simulation (dash curves, S), demonstrating that the distribution is not statistical. For example, the species containing one 8F-R-BINAS ligand (0,1R(F)) shows significantly higher abundance than expected based on the statistical distribution. The ligand with one R-BINAS in its ligand shell is initially more abundant than expected based on statistical distribution and then becomes less abundant than expected. The above shows that the LERs between Au25(2-PET)18 (0,0) and a mixture of R-BINAS and 8F-R-BINAS ligands do not lead to statistical distributions of cluster species. There seems to be some specificity, either due to steric of electronic effects. To shed some more light on this issue we analyzed the kinetics of the reaction in more detail.
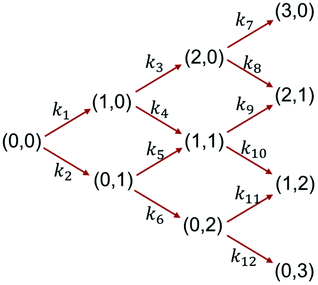
The reaction network of ligand exchange reactions between Au25(2-PET)18 (0,0) and mixtures of R-BINAS and 8F-R-BINAS ligands is illustrated in Scheme 1. The different involved species of general formula Au25(2-PET)18−2x−2y(R-BINAS)x(8F-R-BINAS)y were labelled as (x, y) in the scheme, and only the initial part of the process with maximum total ligand exchange number equal to 3 (maximum x + y = 3) is considered. The reaction network in Scheme 1 is a simplification, as it does not consider isomers of clusters, which differ in the relative position of the adsorbed R-BINAS and 8F-R-BINAS ligands on the cluster. The reaction network was modelled assuming each ligand exchange reaction as a pseudo first order reaction, which seems reasonable, taking into account the excess of the ligands. The experimental data of the LERs were fit to the model outlined in Scheme 1 using MATLAB (the code is shown in the ESI Note 4†). For example, Fig. 5 shows the fit of the experiments depicted in Fig. 3B (raw data extracted from Table S5;† ratio between R-BINAS and 8F-R-BINAS as 1![[thin space (1/6-em)]](https://www.rsc.org/images/entities/char_2009.gif) :
:![[thin space (1/6-em)]](https://www.rsc.org/images/entities/char_2009.gif) 4). The model fits well the experimental data. Similar fitting was done for the experiment with 1
4). The model fits well the experimental data. Similar fitting was done for the experiment with 1![[thin space (1/6-em)]](https://www.rsc.org/images/entities/char_2009.gif) :
:![[thin space (1/6-em)]](https://www.rsc.org/images/entities/char_2009.gif) 2 ratio of R-BINAS and 8F-R-BINAS (raw data taken from Table S6 and Fig. S9A†). The obtained rate constants are given in Fig. S9D.†
2 ratio of R-BINAS and 8F-R-BINAS (raw data taken from Table S6 and Fig. S9A†). The obtained rate constants are given in Fig. S9D.†
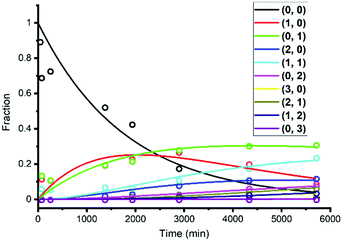 | ||
Fig. 5 MATLAB fitting curves of Au25(2-PET)18 ligand exchange with R-BINAS and 8F-R-BINAS mixture with ratio as 1![[thin space (1/6-em)]](https://www.rsc.org/images/entities/char_2009.gif) : :![[thin space (1/6-em)]](https://www.rsc.org/images/entities/char_2009.gif) 4. The dots represent the experimental results (taken from Table S5†) and solid curves are the fit. 4. The dots represent the experimental results (taken from Table S5†) and solid curves are the fit. | ||
The ratio of the rate constants describing the consecutive exchange of R-BINAS (k1/k3) and 8F-R-BINAS (k2/k6) also are in good agreement with the corresponding ratio extracted in the experiments with the individual ligands (Fig. 2), which underlines the reliability of the approach. The electronic effect of the 8F-R-BINAS modified cluster on the exchange rate can be appreciated by comparing k4 and k6, as k4 describes the reaction of Au25(2-PET)16(R-BINAS)1 with 8F-R-BINAS and k6 the reaction of Au25(2-PET)16(8F-R-BINAS)1 with 8F-R-BINAS. The ratio k4/k6 is about 2.0 for both experiments (1![[thin space (1/6-em)]](https://www.rsc.org/images/entities/char_2009.gif) :
:![[thin space (1/6-em)]](https://www.rsc.org/images/entities/char_2009.gif) 4 and 1
4 and 1![[thin space (1/6-em)]](https://www.rsc.org/images/entities/char_2009.gif) :
:![[thin space (1/6-em)]](https://www.rsc.org/images/entities/char_2009.gif) 2 ligand ratios). The effect is also illustrated by the ratio of k3/k5. In this case, however, the fit gave very low values for k5. The kinetic constants indicate the ligand as well as the (ligand-exchanged) Au25 cluster exert an electronic effect on the rate of LERs: the 8F-R-BINAS ligand and the related substituted cluster, Au25(2-PET)16(8F-R-BINAS)1, show lower reactivity compared to non-fluorinated counterparts (R-BINAS and Au25(2-PET)16(R-BINAS)1).
2 ligand ratios). The effect is also illustrated by the ratio of k3/k5. In this case, however, the fit gave very low values for k5. The kinetic constants indicate the ligand as well as the (ligand-exchanged) Au25 cluster exert an electronic effect on the rate of LERs: the 8F-R-BINAS ligand and the related substituted cluster, Au25(2-PET)16(8F-R-BINAS)1, show lower reactivity compared to non-fluorinated counterparts (R-BINAS and Au25(2-PET)16(R-BINAS)1).
R-BINAS and 8F-R-BINAS have the same configuration, and the discrimination during LERs is mainly due to electronic effects. By replacing R-BINAS with S-BINAS in the ligand mixture, the stereospecific effect can be investigated as well. Here the conditions for LERs follow the previous experiments, with molar ratio between cluster and ligand set as 1![[thin space (1/6-em)]](https://www.rsc.org/images/entities/char_2009.gif) :
:![[thin space (1/6-em)]](https://www.rsc.org/images/entities/char_2009.gif) 15, and molar ratio between S-BINAS to 8F-R-BINAS set as 1
15, and molar ratio between S-BINAS to 8F-R-BINAS set as 1![[thin space (1/6-em)]](https://www.rsc.org/images/entities/char_2009.gif) :
:![[thin space (1/6-em)]](https://www.rsc.org/images/entities/char_2009.gif) 2 (Fig. S8†) and 1
2 (Fig. S8†) and 1![[thin space (1/6-em)]](https://www.rsc.org/images/entities/char_2009.gif) :
:![[thin space (1/6-em)]](https://www.rsc.org/images/entities/char_2009.gif) 4 (Fig. 6), respectively. The MALDI-TOF results for 1
4 (Fig. 6), respectively. The MALDI-TOF results for 1![[thin space (1/6-em)]](https://www.rsc.org/images/entities/char_2009.gif) :
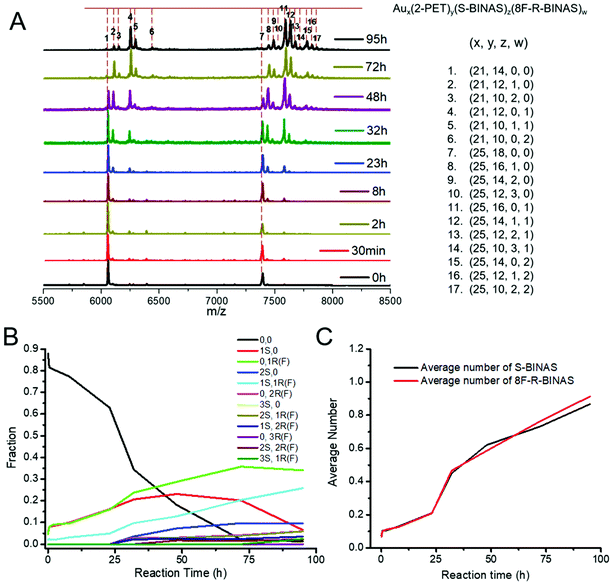
:![[thin space (1/6-em)]](https://www.rsc.org/images/entities/char_2009.gif) 4 ratio are shown in Fig. 6A and the evolution of different species are represented in Fig. 6B (data given in Table S7†). Comparison with the experiment shown in Fig. 3B with the other enantiomer of BINAS (mixture of R-BINAS and 8F-R-BINAS) did not reveal significant differences. Furthermore, the average number of S-BINAS and 8F-R-BINAS on the cluster evolved similarly with time (Fig. 6C). Also for the experiment with 1
4 ratio are shown in Fig. 6A and the evolution of different species are represented in Fig. 6B (data given in Table S7†). Comparison with the experiment shown in Fig. 3B with the other enantiomer of BINAS (mixture of R-BINAS and 8F-R-BINAS) did not reveal significant differences. Furthermore, the average number of S-BINAS and 8F-R-BINAS on the cluster evolved similarly with time (Fig. 6C). Also for the experiment with 1![[thin space (1/6-em)]](https://www.rsc.org/images/entities/char_2009.gif) :
:![[thin space (1/6-em)]](https://www.rsc.org/images/entities/char_2009.gif) 2 ratio of S-BINAS
2 ratio of S-BINAS![[thin space (1/6-em)]](https://www.rsc.org/images/entities/char_2009.gif) :
:![[thin space (1/6-em)]](https://www.rsc.org/images/entities/char_2009.gif) 8F-R-BINAS, the related evolution of the different species (Fig. S8 and Table S8†) was very similar to the one with the other BINAS enantiomer (Fig. S5†). Both experiments were fit using the MATLAB program (Fig. S9B & C†). The related rate constants as shown in Fig. S9† D also revealed the stereoelectronic effect of 8F-R-BINAS ligand as described above. From these experiments we can conclude that diastereospecific interactions are negligible under these conditions, which is not surprising, considering the fact that in our experiments only very few chiral ligands are adsorbed on the achiral cluster, leaving many “achiral sites” free for further incoming ligands. The stereospecific effect originating from the adsorbed chiral ligand is a local effect, unlike the stereoelectronic effect which seems to extend over the whole cluster.
8F-R-BINAS, the related evolution of the different species (Fig. S8 and Table S8†) was very similar to the one with the other BINAS enantiomer (Fig. S5†). Both experiments were fit using the MATLAB program (Fig. S9B & C†). The related rate constants as shown in Fig. S9† D also revealed the stereoelectronic effect of 8F-R-BINAS ligand as described above. From these experiments we can conclude that diastereospecific interactions are negligible under these conditions, which is not surprising, considering the fact that in our experiments only very few chiral ligands are adsorbed on the achiral cluster, leaving many “achiral sites” free for further incoming ligands. The stereospecific effect originating from the adsorbed chiral ligand is a local effect, unlike the stereoelectronic effect which seems to extend over the whole cluster.
Experimental section
All chemicals were purchased from commercial suppliers and used as received without any further treatment. R-BINAS was synthesized from BINOL according to reported method.43,51 8F-R-BINAS was synthesized starting from 1-chloro-2,3,4,5,6-pentafluorobenzene, and the whole synthesis is described in Scheme S1.†47Synthesis and purification of [Au25(2-PET)18]0
In order to obtain [Au25(2-PET)18]0, the anion species [Au25(2-PET)18]− was synthesized first, followed by oxidation by a silica gel column under aerobic conditions. Typically, HAuCl4·3H2O (1 g, 2.54 mmol) and TOAB (1.641 mg, 0.30 mmol) were combined in a 1 L round bottom flask, to which 250 mL THF solvent was added. After vigorous stirring for 15 min, the solution color changed from yellow to red. Then, C8H9SH (2-PET, 1.62 mL, 7.25 mmol) was slowly added to the flask at room temperature without changing the stirring speed. The solution color gradually changed from red to yellow and then to colorless within ∼30 min. After that, an aqueous solution of NaBH4 (0.918 g, 0.5 mmol, freshly dissolved in 50.0 mL of ice-cold mili-Q water) was added to the flask all at once. The reaction generated some bubbles and the solution turned black immediately, indicating the formation of Au nanoclusters. The reaction was allowed to proceed under constant stirring for ca. 2 days. Afterwards, the THF was removed by rotary evaporation to leave a red-brownish oil covered by an aqueous phase. The latter was removed by adding 200 mL of cold methanol and then filtered on paper. To remove excess thiol and other by-products, the product was washed with methanol, filtered and dissolved in dichloromethane (DCM) at least three times. Finally, the product was dried in a vacuum rotary evaporator at room temperature. By this procedure, we obtained [Au25(2-PET)18]−. The product was then further oxidized by dissolution in dichloromethane (DCM, 5 ml) followed by passage through a silica gel column under aerobic conditions. Finally, the sample [Au25(2-PET)18]0 was stored at −18 °C until used. Characterization of the pure samples was carried out by UV-vis spectroscopy and matrix-assisted laser desorption ionization time-of-flight (MALDI-TOF) mass spectrometry (Fig. S1A and B†).Ligand exchange reactions
Purified Au25(2-PET)18 clusters were reacted with enantiopure ligands and mixture ligands separately. For the reaction between Au25(2-PET)18 clusters and R-BINAS or 8F-R-BINAS, the molar ratio between clusters and ligand was 1![[thin space (1/6-em)]](https://www.rsc.org/images/entities/char_2009.gif) :
:![[thin space (1/6-em)]](https://www.rsc.org/images/entities/char_2009.gif) 20. For the reaction between Au25(2-PET)18 clusters and mixture of R-BINAS/8F-R-BINAS or S-BINAS/8F-R-BINAS, the molar ratio between clusters and ligand was 1
20. For the reaction between Au25(2-PET)18 clusters and mixture of R-BINAS/8F-R-BINAS or S-BINAS/8F-R-BINAS, the molar ratio between clusters and ligand was 1![[thin space (1/6-em)]](https://www.rsc.org/images/entities/char_2009.gif) :
:![[thin space (1/6-em)]](https://www.rsc.org/images/entities/char_2009.gif) 15. The reaction was carried out in toluene, and the final concentration of Au25(2-PET)18 keep at 1 mg mL−1 and room temperature. During reaction, drops of sample were taken for the MALDI-TOF measurement at various times. The reactions were followed for at least 95 h.
15. The reaction was carried out in toluene, and the final concentration of Au25(2-PET)18 keep at 1 mg mL−1 and room temperature. During reaction, drops of sample were taken for the MALDI-TOF measurement at various times. The reactions were followed for at least 95 h.
UV-vis and CD spectroscopy
UV-vis spectra were measured on a Varian Cary 50 spectrometer. Limited by the amount of the clusters, a quartz cuvette of 2 mm path length was used. CD spectra of different ligands were measured on a JASCO J-815 CD-spectrometer. For each CD spectrum, ten scans were recorded (and averaged) at a scanning speed of 200 nm min−1 with a data pitch of 1 nm.MALDI-TOF-MS
Mass spectra were recorded by a Bruker Autoflex mass spectrometer in a positive linear mode with a nitrogen laser at near-threshold laser intensity. The matrix applied is trans-2-[3-(4-tert-butylphenyl)-2-methyl-2-propenylidene]-malononitrile. 3.5 mg of matrix was dissolved in 100 μL toluene. Matrix and sample were mixed at ratio 1![[thin space (1/6-em)]](https://www.rsc.org/images/entities/char_2009.gif) :
:![[thin space (1/6-em)]](https://www.rsc.org/images/entities/char_2009.gif) 1 and 2 μL of the mixture was dropped on a MALDI plate and air-dried.
1 and 2 μL of the mixture was dropped on a MALDI plate and air-dried.
Simulation of kinetics and multinomial distribution
The kinetics of the LERs were simulated using MATLAB. The corresponding codes are shown in the ESI Note 2 (monomer free ligand) and Note 4 (mixed ligands).† The multinomial distribution simulation of LERs was set up at Note 3.†Conclusions
In summary, depending on the enantiopure BINAS ligand and the corresponding fluorine-substituted molecule, the electronic and stereospecific effect during LERs with achiral Au25(2-PET)18 nanoclusters have been investigated. The results show that the electronic properties of ligand induce large discrimination to the LERs. Adsorbed fluorine-substituted BINAS significantly slows down the further ligand exchange on Au25 clusters compared to adsorbed parent BINAS. Both electronic effects of the substituted cluster and the (incoming) ligand were important. However, compared with the electronic effect, stereoselectivity was negligible as the two enantiomers did not display visible difference during LERs with the achiral clusters, at least for the initial stage of the ligand exchange investigated here. This finding indicates that the stereospecific effect is a local property at the surface of the cluster whereas the electronic effect due to the adsorbed ligand extends over the whole cluster and significantly influences the kinetics of further LERs. Our discovery offers new insight for the design of new ligands and a strategy to control LERs.Author contributions
Thomas Bürgi designed and supervised the project. Yanan Wang carried out the experiments and analyzed the raw data. All authors discussed the results and contributed to writing of the manuscript.Conflicts of interest
There are no conflicts to declare.Acknowledgements
T. B. acknowledges the generous support of the Swiss Nation-al Science Foundation (grants 200020_172511 and 200020_192232) and the University of Geneva. Y. W. thanks the China Scholarship Council fellowship (201706450070).References
- A. C. Templeton, W. P. Wuelfing and R. W. Murray, Acc. Chem. Res., 2000, 33, 27–36 CrossRef CAS PubMed.
- Y. Liu, K. Ai, X. Cheng, L. Huo and L. Lu, Adv. Funct. Mater., 2010, 20, 951–956 CrossRef CAS.
- D. Luo, X. Wang, S. Zeng, G. Ramamurthy, C. Burda and J. P. Basilion, Small, 2019, 15, 1900968 CrossRef PubMed.
- A. Cifuentes-Rius, A. Ivask, S. Das, N. Penya-Auladell, L. Fabregas, N. L. Fletcher, Z. H. Houston, K. J. Thurecht and N. H. Voelcker, ACS Appl. Mater. Interfaces, 2017, 9, 41159–41167 CrossRef CAS PubMed.
- R. Jin, Nanoscale, 2010, 2, 343–362 RSC.
- R. Jin, H. Qian, Z. Wu, Y. Zhu, M. Zhu, A. Mohanty and N. Garg, J. Phys. Chem. Lett., 2010, 1, 2903–2910 CrossRef CAS.
- H. Qian, M. Zhu, Z. Wu and R. Jin, Acc. Chem. Res., 2012, 45, 1470–1479 CrossRef CAS PubMed.
- R. Jin, C. Zeng, M. Zhou and Y. Chen, Chem. Rev., 2016, 116, 10346–10413 CrossRef CAS PubMed.
- I. Chakraborty and T. Pradeep, Chem. Rev., 2017, 117, 8208–8271 CrossRef CAS PubMed.
- A. Ghosh, O. F. Mohammed and O. M. Bakr, Acc. Chem. Res., 2018, 51, 3094–3103 CrossRef CAS PubMed.
- X. Kang, Y. Li, M. Zhu and R. Jin, Chem. Soc. Rev., 2020, 49, 6443–6514 RSC.
- X.-R. Song, N. Goswami, H.-H. Yang and J. Xie, Analyst, 2016, 141, 3126–3140 RSC.
- S. Maity, D. Bain and A. Patra, Nanoscale, 2019, 11, 22685–22723 RSC.
- Q. Ong, Z. Luo and F. Stellacci, Acc. Chem. Res., 2017, 50, 1911–1919 CrossRef CAS PubMed.
- M. Perić, Ž. Sanader Maršić, I. Russier-Antoine, H. Fakhouri, F. Bertorelle, P.-F. Brevet, X. le Guével, R. Antoine and V. Bonačić-Koutecký, Phys. Chem. Chem. Phys., 2019, 21, 23916–23921 RSC.
- M. Kim, J. F. Cahill, Y. Su, K. A. Prather and S. M. Cohen, Chem. Sci., 2012, 3, 126–130 RSC.
- M. Taddei, R. J. Wakeham, A. Koutsianos, E. Andreoli and A. R. Barron, Angew. Chem., Int. Ed., 2018, 57, 11706–11710 CrossRef CAS PubMed.
- W. Zheng, W. Wang, S.-T. Jiang, G. Yang, Z. Li, X.-Q. Wang, G.-Q. Yin, Y. Zhang, H. Tan, X. Li, H. Ding, G. Chen and H.-B. Yang, J. Am. Chem. Soc., 2019, 141, 583–591 CrossRef CAS PubMed.
- C. Amatore, D. Lexa and J. M. Savéant, J. Electroanal. Chem. Interfacial Electrochem., 1980, 111, 81–89 CrossRef CAS.
- T. A. Hamlin, M. Swart and F. M. Bickelhaupt, ChemPhysChem, 2018, 19, 1315–1330 CrossRef CAS PubMed.
- T. Lund and H. Lund, Tetrahedron Lett., 1986, 27, 95–98 CrossRef CAS.
- A. C. Templeton, M. J. Hostetler, C. T. Kraft and R. W. Murray, J. Am. Chem. Soc., 1998, 120, 1906–1911 CrossRef CAS.
- Y. Song and R. W. Murray, J. Am. Chem. Soc., 2002, 124, 7096–7102 CrossRef CAS PubMed.
- R. L. Donkers, Y. Song and R. W. Murray, Langmuir, 2004, 20, 4703–4707 CrossRef CAS PubMed.
- R. Guo, Y. Song, G. Wang and R. W. Murray, J. Am. Chem. Soc., 2005, 127, 2752–2757 CrossRef CAS PubMed.
- M. J. Hostetler, A. C. Templeton and R. W. Murray, Langmuir, 1999, 15, 3782–3789 CrossRef CAS.
- C. L. Heinecke, T. W. Ni, S. Malola, V. Mäkinen, O. A. Wong, H. Häkkinen and C. J. Ackerson, J. Am. Chem. Soc., 2012, 134, 13316–13322 CrossRef CAS PubMed.
- Y. Wang and T. Bürgi, Nanoscale Adv., 2021, 3, 2710–2727 RSC.
- C. A. Hosier, I. D. Anderson and C. J. Ackerson, Nanoscale, 2020, 12, 6239–6242 RSC.
- Y. Li, R. Juarez-Mosqueda, Y. Song, Y. Zhang, J. Chai, G. Mpourmpakis and R. Jin, Nanoscale, 2020, 12, 9423–9429 RSC.
- M. P. Maman, A. S. Nair, H. Cheraparambil, B. Pathak and S. Mandal, J. Phys. Chem. Lett., 2020, 11, 1781–1788 CrossRef CAS PubMed.
- W. Du, X. Kang, S. Jin, D. Liu, S. Wang and M. Zhu, Inorg. Chem., 2020, 59, 1675–1681 CrossRef CAS PubMed.
- Z. Huang, Y. Ishida, K. Narita and T. Yonezawa, J. Phys. Chem. C, 2018, 122, 18142–18150 CrossRef CAS.
- Q. Yao, Y. Feng, V. Fung, Y. Yu, D.-e. Jiang, J. Yang and J. Xie, Nat. Commun., 2017, 8, 1555 CrossRef PubMed.
- M.-B. Li, S.-K. Tian, Z. Wu and R. Jin, Chem. Mater., 2016, 28, 1022–1025 CrossRef CAS.
- A. Fernando and C. M. Aikens, J. Phys. Chem. C, 2015, 119, 20179–20187 CrossRef CAS.
- V. Rojas-Cervellera, L. Raich, J. Akola and C. Rovira, Nanoscale, 2017, 9, 3121–3127 RSC.
- G. Salassa, A. Sels, F. Mancin and T. Bürgi, ACS Nano, 2017, 11, 12609–12614 CrossRef CAS PubMed.
- S. Knoppe, I. Dolamic and T. Bürgi, J. Am. Chem. Soc., 2012, 134, 13114–13120 CrossRef CAS PubMed.
- B. Varnholt, I. Dolamic, S. Knoppe and T. Bürgi, Nanoscale, 2013, 5, 9568–9571 RSC.
- N. Yan, N. Xia and Z. Wu, Small, 2020, 2000609 Search PubMed.
- N. Barrabés, B. Zhang and T. Bürgi, J. Am. Chem. Soc., 2014, 136, 14361–14364 CrossRef PubMed.
- S. Knoppe, R. Azoulay, A. Dass and T. Bürgi, J. Am. Chem. Soc., 2012, 134, 20302–20305 CrossRef CAS PubMed.
- S. Hossain, W. Kurashige, S. Wakayama, B. Kumar, L. V. Nair, Y. Niihori and Y. Negishi, J. Phys. Chem. C, 2016, 120, 25861–25869 CrossRef CAS.
- P. Pengo, C. Bazzo, M. Boccalon and L. Pasquato, Chem. Commun., 2015, 51, 3204–3207 RSC.
- Y. Wang, B. Nieto-Ortega and T. Bürgi, Chem. Commun., 2019, 55, 14914–14917 RSC.
- A. Sels, R. Azoulay, W. J. Buma, M. A. J. Koenis, V. P. Nicu and T. Bürgi, J. Phys. Chem. C, 2019, 123, 22586–22594 CrossRef CAS.
- S. Knoppe, A. Dass and T. Bürgi, Nanoscale, 2012, 4, 4211–4216 RSC.
- B. Molina, A. Sánchez-Castillo, S. Knoppe, I. L. Garzón, T. Bürgi and A. Tlahuice-Flores, Nanoscale, 2013, 5, 10956–10962 RSC.
- K. R. Krishnadas, L. Sementa, M. Medves, A. Fortunelli, M. Stener, A. Fürstenberg, G. Longhi and T. Bürgi, ACS Nano, 2020, 14, 9687–9700 CrossRef CAS PubMed.
- D. Fabbri, G. Delogu and O. De Lucchi, J. Org. Chem., 1993, 58, 1748–1750 CrossRef CAS.
Footnote |
| † Electronic supplementary information (ESI) available. See DOI: 10.1039/d1nr07602g |
| This journal is © The Royal Society of Chemistry 2022 |

