
 Open Access Article
 This Open Access Article is licensed under a Creative Commons Attribution-Non Commercial 3.0 Unported Licence
Quantifying interfacial tensions of surface nanobubbles: How far can Young's equation explain?†
Hideaki
Teshima
 *ab,
Hiroki
Kusudo
c,
Carlos
Bistafa
c and
Yasutaka
Yamaguchi
cd
*ab,
Hiroki
Kusudo
c,
Carlos
Bistafa
c and
Yasutaka
Yamaguchi
cd
aDepartment of Aeronautics and Astronautics, Kyushu University, Nishi-Ku, Motooka 744, Fukuoka 819-0395, Japan. E-mail: hteshima05@aero.kyushu-u.ac.jp
bInternational Institute for Carbon-Neutral Energy Research (WPI-I2CNER), Kyushu University, Nishi-Ku, Motooka 744, Fukuoka 819-0395, Japan
cDepartment of Mechanical Engineering, Osaka University, 2-1 Yamadaoka, Suita, 565-0871, Japan
dWater Frontier Research Center (WaTUS), Tokyo University of Science, Shinjuku-Ku, Kagurazaka 1-3, 162-8601, Japan
First published on 5th January 2022
Abstract
Nanobubbles at solid–liquid interfaces play a key role in various physicochemical phenomena and it is crucial to understand their unique properties. However, little is known about their interfacial tensions due to the lack of reliable calculation methods. Based on mechanical and thermodynamic insights, we quantified for the first time the liquid–gas, solid–liquid, and solid–gas interfacial tensions of submicron-sized nitrogen bubbles at graphite–water interfaces using molecular dynamics (MD) analysis. It was revealed that Young's equation holds even for nanobubbles with different radii. We found that the liquid–gas and solid–liquid interfacial tensions were not largely affected by the gas density inside the nanobubbles. In contrast, the size effect on the solid–gas interfacial tension was observed, namely, the value dramatically decreased upon an increase in the gas density due to gas adsorption on the solid surface. However, our quantitative evaluation also revealed that the gas density effect on the contact angles is negligible when the footprint radius is larger than 50 nm, which is a typical range observed in experiments, and thus the flat shape and stabilization of submicron-sized surface bubbles observed in experiments cannot be explained only by the changes in interfacial tensions due to the van der Waals interaction-induced gas adsorption, namely by Young's equation without introducing the pinning effect. Based on our analysis, it was clarified that additional factors such as the differences in the studied systems are needed to explain the unresolved open issues – a satisfactory explanation for the nanobubbles in MD simulations being ultradense, non-flat, and stable without pinning.
Introduction
Bubbles at solid–liquid interfaces are ubiquitous and important both in nature and in industry. Accordingly, a rigorous understanding of their physics from the molecular scale is of fundamental importance for various physicochemical phenomena involving bubble nucleation, such as boiling, cavitation, chemical reactions, and water splitting. In particular, small bubbles at solid–liquid interfaces with a submicron-sized footprint radius and a height of tens of nanometers, which are called surface/interfacial nanobubbles,1 were first reported a quarter century ago2 and have attracted increasing attention because of their roles for a wide range of phenomena, such as long-range hydrophobic interactions,3 fluid slippage,4 and stabilization of water thin films in nanoscale spaces under vacuum.5 The utilization of surface nanobubbles is also a promising way for engineering applications including the wafer-scale transfer of graphene films,6 the onset of nucleate boiling at a low superheat,7 the drag reduction of fluid flow inside a microchannel,8 and inhibition of metal corrosion in acidic geothermal fluids.9To date, a number of studies have reported the unique properties of surface nanobubbles, such as the unexpected day-order long-lifetime,10–12 significantly larger contact angles than those observed on a macroscale,13 and superstability against the disturbance.14,15 Subsequently, a variety of theories have been proposed to explain them.1,16 So far, it has been speculated that pinning of their three-phase contact line and local gas oversaturation are essential factors to explain the characteristics,17,18 which was first proposed by Liu and Zhang in 2013.19 Indeed, it has been experimentally confirmed that surface nanobubbles are strongly pinned even on atomically flat surfaces.13,15,20,21 However, some have questioned the necessity of the pinning for the long-lifetime of surface nanobubbles. Chen et al. carried out molecular dynamics (MD) simulations of steady argon surface nanobubbles without pinning sites and argued that the pinning was not necessarily needed for their stabilization.22 Nag et al. experimentally observed a free growth/shrinkage of surface nanobubbles for longer than 1000 seconds in a nano-confined water film using an in situ liquid phase electron microscopy (LPEM) technique, which indicated the existence of non-pinned surface nanobubbles.23 Thus, it is still under debate whether the pinning is necessary to explain the unique properties of surface nanobubbles.
In addition to the aforementioned properties, a new characteristic of surface nanobubbles was experimentally reported: an ultrahigh density of inner gas molecules. Zhou et al. revealed using scanning transmission X-ray microscopy (STXM) that oxygen surface nanobubbles with a footprint diameter as large as 500–800 nm had a density one to two orders of magnitude higher than that under ambient conditions, which cannot be explained by the ideal gas law and the Laplace pressure.24 This new feature would lead to innovations such as effective oxygen transport, storage of hydrogen gases at room temperature and pressure, and improvement in chemical reactions. However, the cause for the ultrahigh density has not been understood yet. Moreover, Zhang et al. using attenuated total internal reflection-Fourier transform infrared (ATR-FTIR) spectroscopy reported that the average density inside the CO2 surface nanobubbles was 44 ± 16 mol m−3 (i.e., 1.2 ± 0.4 kg m−3), equivalent to the gas density at atmospheric pressure,25 which is in contrast to the aforementioned STXM results.
The ultrahigh inner density of surface nanobubbles also raises a new question whether their interfacial tensions change. Because interfacial tensions originate from the interaction among molecules at the interfaces, it is natural to expect that the values of ultradense nanobubbles deviate from those of macroscopic bubbles. Such a change in the interfacial tensions could rationalize the unique characteristics of surface nanobubbles without introducing pinning as an additional cause. For example, Zhang et al. proposed that the theoretical lifetime of surface nanobubbles would approach the timescale observed in experiments if the liquid–gas interfacial tension could be reduced due to the high inner pressure.26 Petsev et al. also theoretically predicted that the adsorption of gas molecules onto the solid surface just under the surface nanobubbles could reduce the solid–gas interfacial tension, leading to their distinctive flat shape.27
To reveal the mechanisms underlying the properties of surface nanobubbles, quantification of their interfacial tensions is highly desired. However, direct experimental measurement of the interfacial tensions of surface nanobubbles is extremely difficult. Specifically, the liquid–gas interfacial tension has been measured in a few studies, but the results are inconsistent: one study reported that the value was not changed,28 while another reported that it was changed.29 More importantly, quantitative values of the solid–gas and solid–liquid interfacial tensions of such nanobubbles have never been reported. To calculate the reliable interfacial tensions of surface nanobubbles, it is desirable to employ a theoretical approach applicable at the molecular scale, rather than experiments that inherently involve various uncertainties.
In this study, by integrating well-proven mechanical and thermodynamic insights30–37 into MD simulations, we quantified the liquid–gas, solid–gas, and solid–liquid interfacial tensions of nitrogen surface nanobubbles at graphite/water interfaces. The resulting contact angles evaluated by substituting these three interfacial tensions into Young's equation agreed well with those measured from the apparent shapes of the surface nanobubbles. We further extended our method to estimate the contact angles not only for quasi-two-dimensional nanobubbles but also for semispherical submicron-sized bubbles, which enabled us to directly compare our simulation results with the previous experimental results. Based on this analysis, as well as the interfacial tensions, we shed light on the unresolved issues of surface nanobubbles mentioned above: the necessity of the pinning and the effect of the inner gas molecules on the flatness and long-lifetime.
Results and discussion
Density-dependence of the contact angles of surface nanobubbles
We have carried out MD simulations of quasi-two-dimensional hemi-cylindrical surface nanobubbles composed of nitrogen molecules (referred to as N2 molecules hereafter) in water, which are confined between the top graphene and the bottom AB stacked four-layer graphene (referred to as graphite hereafter). Fig. 1 presents an example of the nanobubble simulation systems in the present study. Five cases were tested for the number of N2 molecules in the system NN2, as NN2 = 400, 300, 250, 200, and 150 with a constant number of water molecules NH2O = 11![[thin space (1/6-em)]](https://www.rsc.org/images/entities/char_2009.gif) 000. The top graphene worked as a piston to attain the pressure in the liquid at the atmospheric pressure P0 = 1 atm, as it has been successfully used in previous studies.22,38,39 The Lennard-Jones (LJ) energy between the carbon atoms in the bottom graphite and N2 molecules was changed by multiplying a coupling parameter η = 1.0 or 1.5 to investigate the influence of the solid–gas interaction. The details of the setup of these nanobubble simulations are described in the Methods section.
000. The top graphene worked as a piston to attain the pressure in the liquid at the atmospheric pressure P0 = 1 atm, as it has been successfully used in previous studies.22,38,39 The Lennard-Jones (LJ) energy between the carbon atoms in the bottom graphite and N2 molecules was changed by multiplying a coupling parameter η = 1.0 or 1.5 to investigate the influence of the solid–gas interaction. The details of the setup of these nanobubble simulations are described in the Methods section.
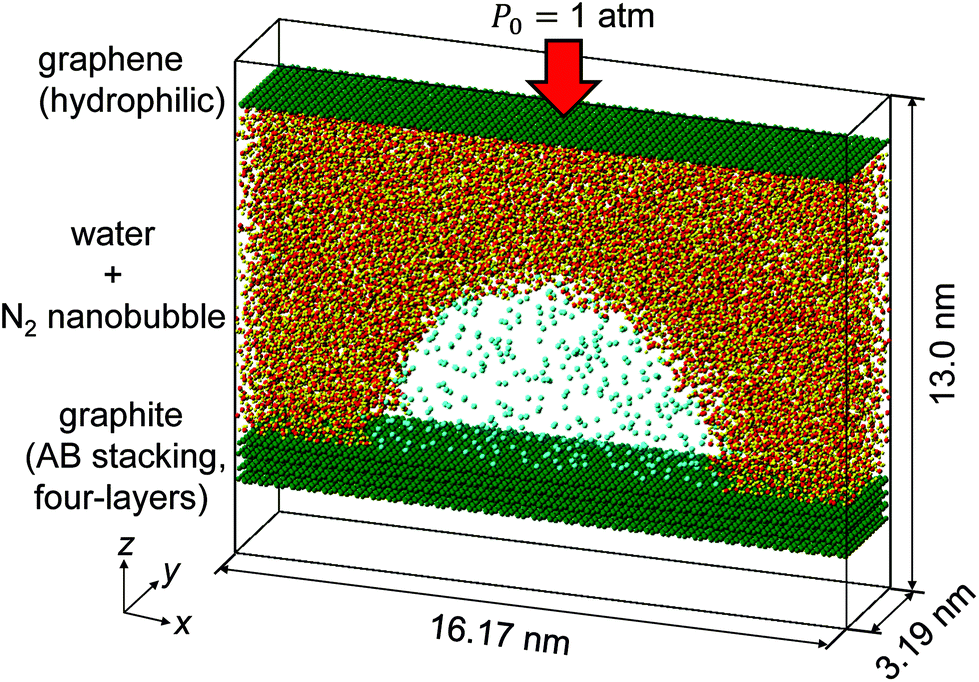 | ||
| Fig. 1 Simulation system of an N2 nanobubble in water confined between graphite and hydrophilic graphene with a number of N2 molecules NN2 = 400. | ||
Fig. 2 shows (i) equilibrium MD snapshots and (ii) the time averaged density distributions of N2 surface nanobubbles and a nanodroplet with only 5000 water molecules on the graphite surface. As the number of N2 molecules decreased, the nanobubbles became smaller and the N2 density in the bulk of the nanobubbles,  , increased. The values were approximately 130–230 kg m−3 and 100–170 kg m−3 for η = 1.0 and 1.5, which are two orders of magnitude higher than the nitrogen gas density under room conditions (1.14 kg m−3) and reaches 12–28% of liquid nitrogen density (809 kg m−3). This ultrahigh density is caused by the high Laplace pressure generated by their small radii of curvature. The inner pressures of these nanobubbles Pgas, which were calculated from the normal stress working on the graphite underneath them, were indeed very high, ranging from 9.0 to 23.7 MPa (see ESI Fig. S1†). In addition, adsorbed layers with higher concentrations of N2 molecules were observed near the solid surface underneath the nanobubbles, which is consistent with the experimental results.40
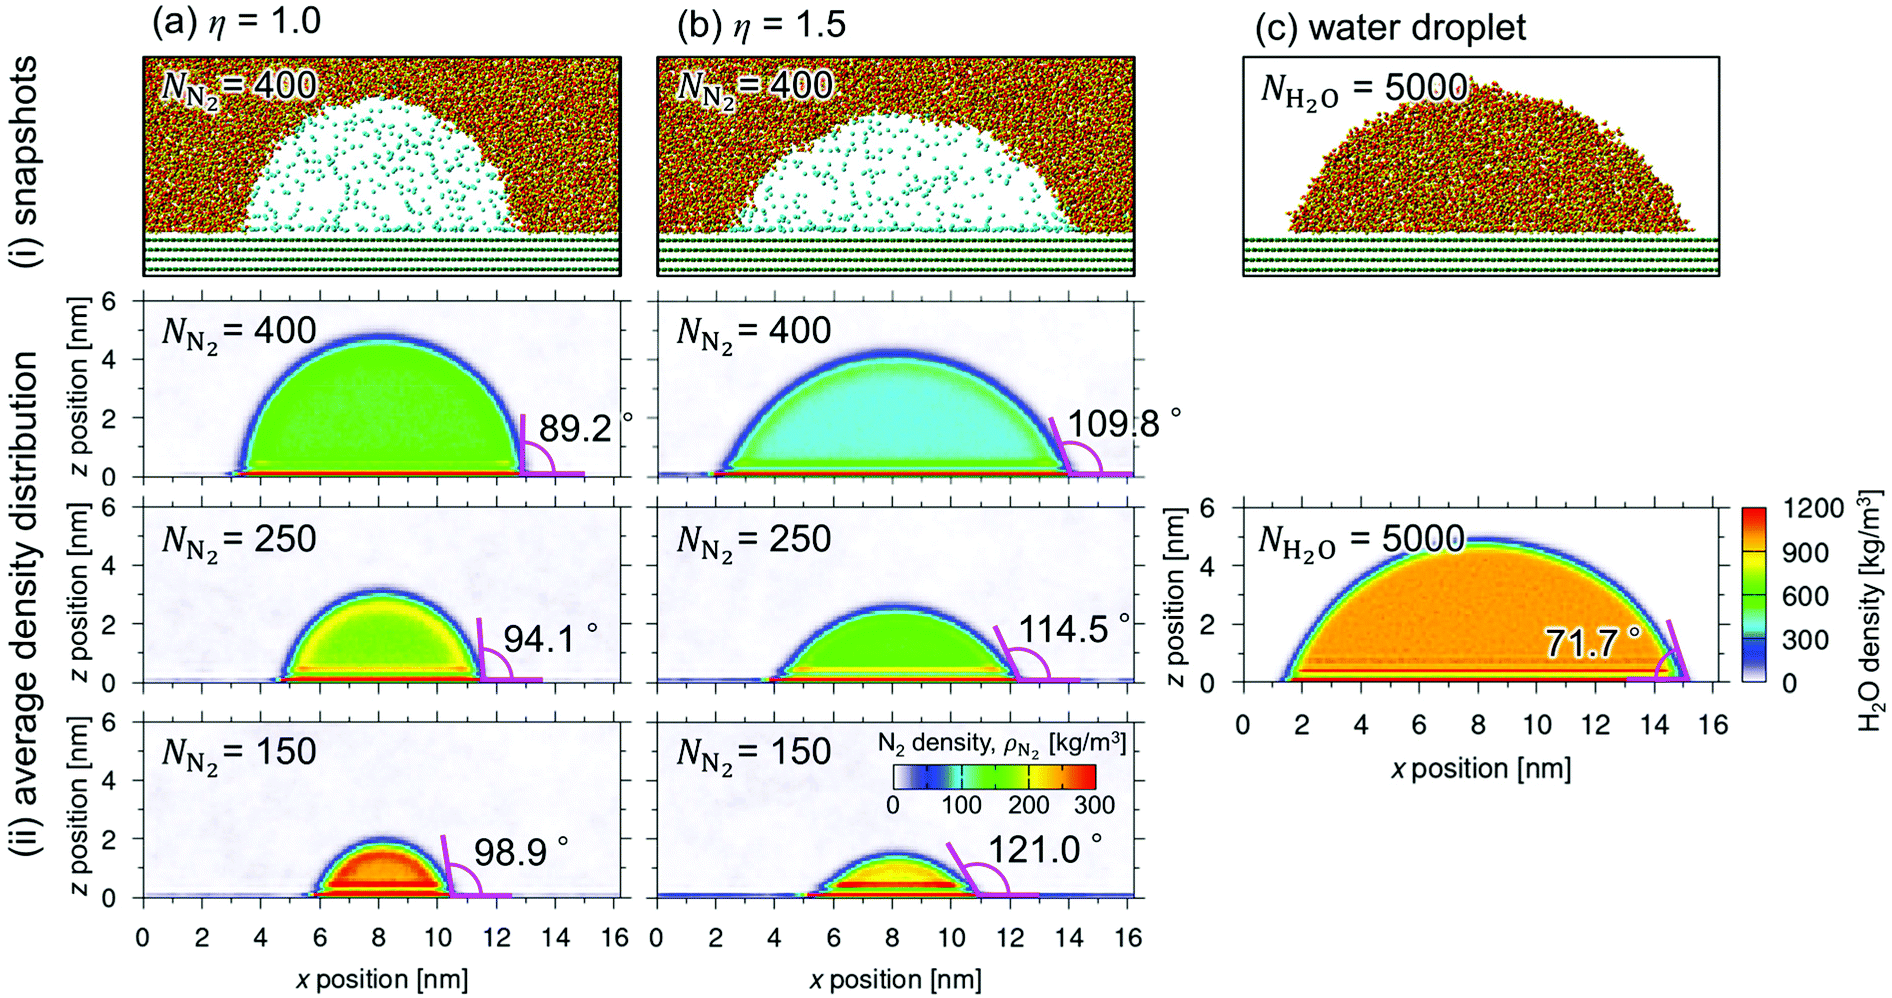 | ||
| Fig. 2 (i) MD snapshots of nanobubbles with a number of gas molecules NN2 = 400, and (ii) density distributions of nanobubbles with NN2 = 400, 250, and 150 (from the top) in the cases of (a) η = 1.0 and (b) η = 1.5, and (c) a water nanodroplet equilibrated on the same graphite. Time average was taken for 20 ns after 40 ns equilibration for the calculation of the density distribution. | ||
Furthermore, we evaluated the apparent contact angle of the nanobubbles θapp and that of the nanodroplet θdroplet by least-squares circular fitting to a contour of the gas–liquid interface away from the wall.30,33–35 Masuduzzaman and Kim reported the importance of the definition of the solid–liquid boundary position for the evaluation of the apparent contact angle.41 In this study, the solid–liquid interface was defined as the position where the fluid density becomes zero which gives a consistent mechanical balance near the three-phase contact lines.30 The contact angle θapp increased as the nanobubbles became smaller, i.e., as  increased (89.2–98.9° for η = 1.0 and 109.8–121.0° for η = 1.5). They were much smaller than those observed in experiments (160–175°)1 but clearly higher than the contact angle of the nanodroplet θdroplet = 71.7° shown in Fig. 2(c-ii), which is within a range of that on graphite surfaces experimentally reported.42 Because the pinning effect can be negligible on an atomically smooth solid surface,30 this density-dependent change in the contact angles indicates that the gas molecules inside the nanobubbles induced the change in their interfacial tensions.
Quantitative evaluation of interfacial tensions
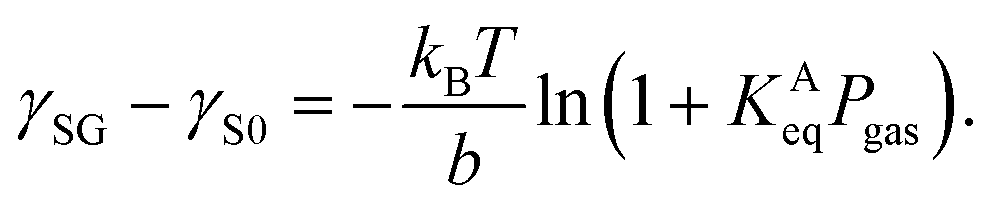
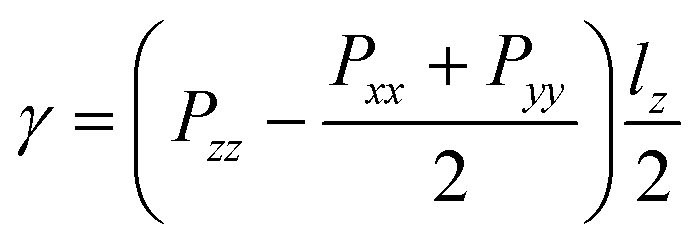
To quantitatively investigate the effect of gas molecules on the interfacial tensions, we employed quasi-one-dimensional liquid–gas, solid–gas, and solid–liquid systems that mimic the interfaces of surface nanobubbles shown in Fig. 2. Specifically, the liquid–gas and solid–gas interfacial tensions were calculated based on Bakker's equation,30–37 which describes the relationships between the fluid stress anisotropy and interfacial tensions. The solid–liquid interfacial tension was quantified by the thermodynamic integration (TI) method that calculates the minimum work needed to separate the liquid from the solid surface per area, which corresponds to the interfacial free energy.30,34,35,43 These types of calculation methods of interfacial tensions are called the “mechanical route”32 and “thermodynamic route”,30,34,35,43 respectively. The details of the methods used for the calculation of interfacial tensions are described in the Methods section.The liquid–gas, solid–gas, and solid–liquid interfacial tensions of the nanobubbles calculated for various bulk N2 densities are shown in Fig. 3(a). Although the value of the liquid–gas interfacial tension γLG decreased from that of the liquid–vapor interfacial tension γLV = 53.9 ± 0.4 × 10⁻³ N m−1 (95% confidence interval) with the increase of  , the difference γLV − γLG was as small as about 4 × 10⁻³ N m−1 (7% of γLV). This may be because the strong Coulomb force among the water molecules governed the interfacial tension and the effect of the weak van der Waals force between the water and N2 molecules was relatively small. The value of γLV obtained by the present SPC/E water model is consistent with other calculated values previously reported in the literature.44,45 The calculated values of γLV obtained with several water models and at different temperatures are known to be underestimated compared to the established experimental values.46 On the other hand, the solid–gas interfacial tension relative to the solid–vacuum interfacial tension, γSG – γS0, dramatically decreased in both cases of η = 1.0 and 1.5 with increasing
  , i.e., with increasing pressure in the nanobubbles Pgas. This is because the density inside the gas molecule-adsorbed layer increased as Pgas increased (shown in ESI Fig. S2†). Although such an adsorption of gas molecules was also observed for the liquid–gas interfaces (Fig. 2(ii)), the density increase was much smaller than that for the solid–gas interfaces, resulting in a small effect on γLG. These results imply that the change in the contact angles observed in Fig. 2 was attributed to the significant decrease in the solid–gas interfacial tension caused by the strong adsorption of N2 molecules.
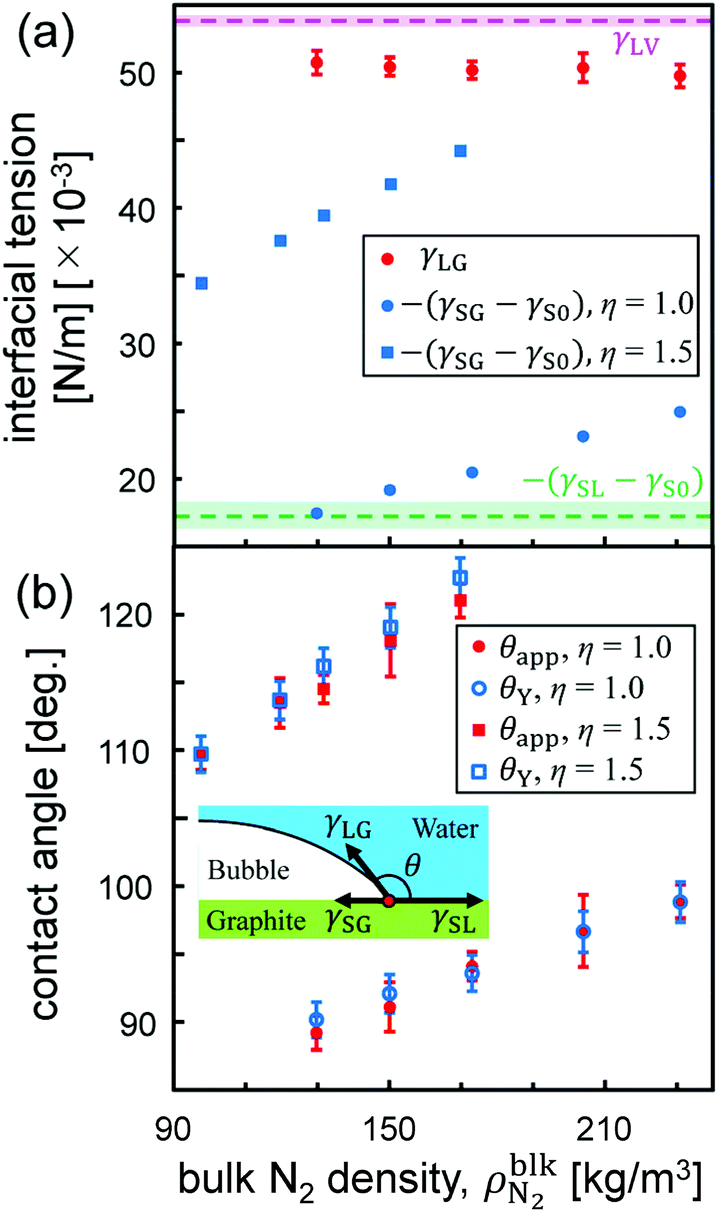 | ||
Fig. 3 (a) Interfacial tensions and (b) contact angles of θY and θapp estimated by Young's equation (eqn (1)) and apparent shape of the nanobubbles as a function of the bulk N2 density  . The pink and green dashed lines indicate the values of γLV = 53.9 ± 0.4 × 10⁻³ N m−1 and –(γSL − γS0) = 17.3 ± 1.0 × 10⁻³ N m−1, respectively. . The pink and green dashed lines indicate the values of γLV = 53.9 ± 0.4 × 10⁻³ N m−1 and –(γSL − γS0) = 17.3 ± 1.0 × 10⁻³ N m−1, respectively. | ||
From these results, we compared the apparent contact angle θapp obtained from the density distribution as shown in Fig. 2(ii) and the contact angle θY estimated by Young's equation:
 | (1) |
 in Fig. 3(b). These values calculated via different approaches were in good agreement for both cases of η = 1.0 and 1.5, which assures the reliability of our calculation results and proves the conclusion that the density-dependence of the contact angles observed in Fig. 2 is attributed to the change in γSG – γS0. This result also highlights the important point that Young's equation holds even for nanoscopic gas bubbles at solid–liquid interfaces. Young's equation broke down only when the nanobubbles became so small that there was no bulk N2 density region inside them where the interfacial tensions between the two bulk phases could not be defined any more (refer to ESI Fig. S3†).
Are submicron-sized surface bubbles flattened by gas molecular adsorption?
At first glance, the density dependence of the contact angle induced by the adsorption of gas molecules appears to be a key factor to explain the flatness of surface nanobubbles. However, because the nanobubbles in our MD systems are quasi-two-dimensional and their footprint radius (∼5 nm) is much smaller than that observed in experiments (∼500 nm), a direct comparison between them is not possible. Although it is currently not feasible to directly analyze semispherical submicron-sized bubbles in MD simulations due to the very demanding computational cost involved, our method, which solves Young's equation by quantifying the interfacial tensions corresponding to the Laplace pressure of three-dimensional nanobubbles, makes it possible to calculate their contact angles including the effects of gas molecular adsorption (the detail is shown in ESI Fig. S4–S6†).The relationship between the contact angle θY and the footprint radius RFP of semispherical submicron-sized nanobubbles calculated by our method is shown in Fig. 4(b). When RFP > 50 nm, the change in the contact angles from one of nanodroplet θdroplet obtained in Fig. 2(c-ii) was small, at most 4.1° and 15.3° for η = 1.0 and 1.5, respectively. When RFP < 50 nm, there is a significant increase in the contact angle as the RFP value decreases, but only when RFP < 1 nm, it reaches 160–175°, which are typical values for nanobubbles on graphite in experiments.1
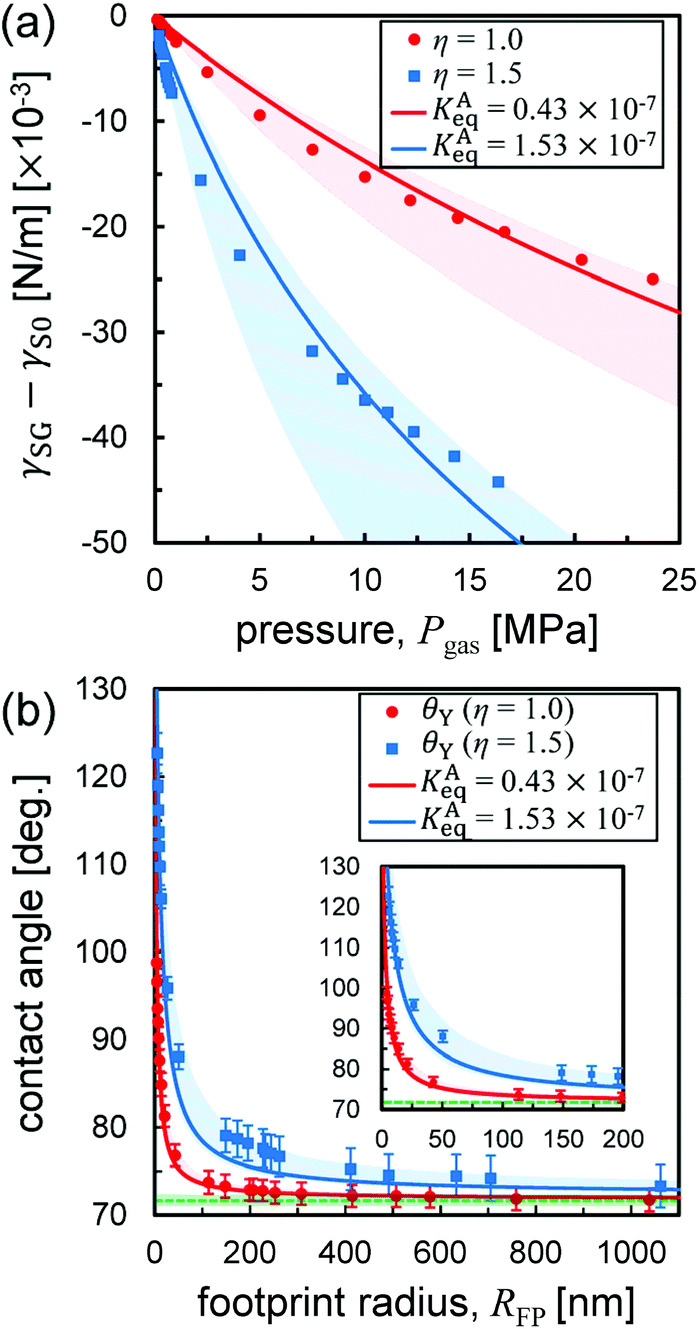 | ||
| Fig. 4 (a) Relative solid–gas interfacial tension γSG − γS0 as a function of the pressure Pgas. The red and blue lines are drawn by fitting the Szyszkowski eqn (3). The light pink and light blue bands were determined to cover all data points, which have the ranges of KAeq between 0.38 × 10⁻⁷ and 0.65 × 10⁻⁷ Pa−1 and between 1.31 × 10⁻⁷ and 2.89 × 10⁻⁷ Pa−1, respectively. (b) A semispherical nanobubble's contact angle versus footprint radius RFP. The red and blue curves are drawn by using Petsev's model (eqn (2)) with the KAeq value obtained in (a). The green dashed lines indicate θdroplet shown in Fig. 2(c). Enlarged view for a small RFP range is shown as an inset. | ||
Petsev et al. theoretically proposed that the flat nanobubble morphology can be explained by considering the effect of gas adsorption at solid–gas interfaces on their contact angles.27 The equation used can be rewritten as
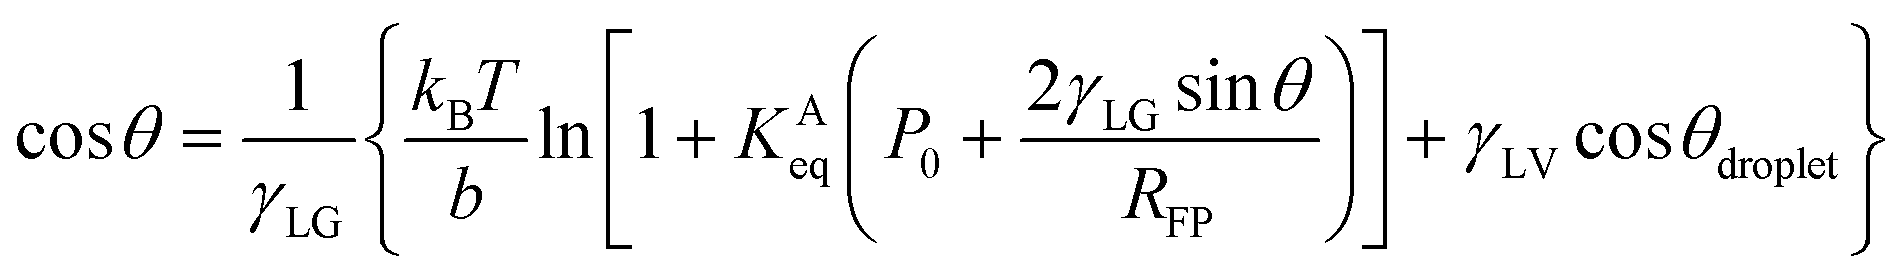 | (2) |
 | (3) |
The plots of γSG – γS0 as a function of the pressure Pgas (Fig. 4(a)) were fitted using eqn (3) with KAeq as the fitting parameter. The trends between the MD results and the theoretical prediction presented good agreement and the resulting values were KAeq = 0.43 × 10⁻⁷ and 1.53 × 10⁻⁷ Pa−1 for η = 1.0 and 1.5, which were significantly smaller than the KAeq values used in the Petsev's study.27 We then evaluated the simulated contact angle θY by substituting the obtained KAeq value to Petsev's model (eqn (2)) with b = 10.74 × 10⁻² nm2 estimated from the LJ length parameter used in our study. As shown in Fig. 4(b), the curves obtained using eqn (2) followed the plots of θY well. If we follow the value of KAeq = 1.0 × 10⁻⁴ to 1.0 × 10⁻⁶ Pa−1 used in a previous study,27 the value of η needs to be considerably large, which induces the unrealistic behavior of N2 molecules on graphite. From these results, the present KAeq value obtained in our analysis is more reasonable than the ones of the previous study, which seems to have overestimated the effect of gas adsorption on the contact angles. Therefore, although the size effect appears when the nanobubbles are sufficiently small, the flat shape of semispherical nanobubbles observed in experiments cannot be explained only by the van der Waals interaction-induced gas molecular adsorption.
We note that these results are still limited to the ideal case, namely, the nanobubbles composed of non-polar gas molecules in ultrapure water. In more realistic systems, the gas molecular adsorption should be affected by the existence of ions in solutions and the electric charge at interfaces. Further quantitative characterization of them remains an interesting topic but is beyond the range of the present paper.
Are submicron-sized surface bubbles ultradense or not?
Zhou et al. reported by STXM observation24 that oxygen nanobubbles with a footprint radius of hundreds of nanometers had a density of tens to hundreds kg m−3. On the other hand, Zhang et al. reported by ATR-FTIR measurements that the inner densities of surface nanobubbles are almost the same as that of the ideal gas at atmospheric pressure.25 In our MD analysis, we found that the ideal gas law is applicable to surface nanobubbles with a gas density of lower than approximately 100 kg m−3 (shown in ESI Fig. S6†). Therefore, by considering the ideal gas law and the Laplace pressure, the bulk N2 density inside the surface nanobubbles is given by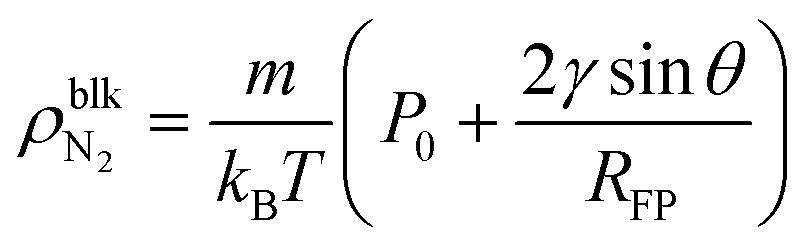 | (4) |
If we adopt the typical values of surface nanobubbles, namely a footprint radius of 300 nm and a contact angle of 160°, the density is estimated to be 3.0 kg m−3 from eqn (4). Although this is about 2.6 times higher than the N2 gas density at atmospheric pressure (1.14 kg m−3), it is still two orders of magnitude lower than the STXM results, supporting the ATR-FTIR ones. There are two possible reasons for this result. One is the overestimation of the gas density inside the nanobubbles in STXM observations caused by the existence of an ultradense gas molecule-adsorbed layer underneath them. The formation of the dense adsorbed layers of gas molecules has been reported not only by MD simulations22,24,40 but also by AFM40,50–52 and LPEM53,54 experiments. Our analysis also found that even when the pressure Pgas was reduced to 0.2 MPa corresponding to the nanobubbles with a footprint radius of 250 nm and a contact angle of 170°, the peak density inside the adsorbed layer was 37 and 241 kg m−3 for η = 1.0 and 1.5 (shown in ESI Fig. S2†), which is 1–2 orders of magnitude higher than 2.3 kg m−3 of the bulk N2 density inside the nanobubbles. Such highly dense adsorbed layers would have some effect on the measured absorption spectra. The other is the nano-confined effect. While ATR-FTIR experiments were conducted in open systems, the nanobubbles in STXM observations were inside a nanoscopic water film sandwiched in two Si3N4 windows like those in LPEM observation. Under such nano-confined conditions, the overlap of the electric double layer formed at the two solid–liquid interfaces would deviate the properties of the nanobubbles from those predicted by the classical theory and MD simulations, implying the importance of the system conditions to the properties of surface nanobubbles discussed in the next subsection.
Eqn (4) suggests that surface nanobubbles with a large footprint radius in open systems like those observed by AFM or optical methods cannot have an ultrahigh density of tens to hundreds kg m−3 except for inside the adsorbed layers. In contrast, because the typical footprint radius of nanobubbles observed by LPEM is at most tens of nanometers,54–56 the bulk density inside them can reach a hundred kg m−3. In addition, when a contact angle is 90°, the gas density estimated using eqn (4) corresponds to that inside the bulk nanobubbles in which the footprint radius RFP is defined as the radius of curvature. We can estimate that the typical bulk N2 nanobubble with a diameter of 100 nm would have a gas density of 34 kg m−3. Such a high density would make it possible to effectively supply gas molecules, and this is a possible explanation of the mechanism of the nanobubble solution-induced promotion of the growth of plants and living beings.57
Is pinning required for the stabilization of surface nanobubbles?
Some experiments and simulations have reported that pinning is responsible for the stabilization and flattening of surface nanobubbles,13,15,19,20,38,58 while several MD simulations, including our study, showed that the nanobubbles can be stable without pinning.22,59 Zhang et al. predicted that the lifetime of surface nanobubbles would be extended if the liquid–gas interfacial tension could be significantly reduced by the high inner gas density.26 However, the effect of the gas density on the liquid–gas interfacial tension is small as shown in Fig. 3(a). Then, what caused the nanobubbles to stabilize with no pinning sites in the MD simulations? We propose that it is because of the abnormally high gas oversaturation in water due to the closed condition. In our analysis, N2 molecules have dissolved in water more than 1 kg m−3 (shown in ESI Fig. S8†), which is considerably supersaturated compared to the nitrogen solubility of 0.017 kg m−3 of ambient water. Because the simulation box is closed due to the periodic boundary in the horizontal direction and the walls in the vertical direction, the decrease in gas supersaturation via diffusion does not occur. Therefore, further dissolution is not induced even if the nanobubbles are at such a high inner pressure, resulting in their metastability. Indeed, it was reported that the nanobubble nucleation in LJ fluids can be controlled by adjusting the solubility through LJ parameters,60 which supports our interpretation.Such highly saturated and closed conditions are also present in the experimental systems. STXM observations of a confined water film reported that the water surrounding oxygen nanobubbles were highly saturated with oxygen gas.24 In LPEM experiments, hydrogen nanobubbles are nucleated in a nano-confined liquid film by the radiolysis of water molecules. Because the radiolysis induced by electron beam irradiation continues to occur during observation, the gas supersaturation in the solution should be extremely high. In such cases, surface nanobubbles would be stable without pinning. Nag et al. recently found an unpinned nanobubble that was stable for over 1000 seconds in LPEM observation.23 Shin et al. also observed the cross-sections of surface nanobubbles with diameters of 5–15 nm using the vended graphene liquid cell, and found that their contact angles were 90–120°,56 which are consistent with the values of the unpinned nanobubbles on graphite shown in Fig. 4(b). In contrast, in open systems, the pinning and local gas oversaturation near solid–liquid interfaces will be indispensable for nanobubble stability. These indicate that the dynamic properties of surface nanobubbles can be different in open systems (e.g., typical systems in AFM and optical microscopy observations) and in closed systems (e.g., typical systems in STXM, LPEM, and MD simulations). Thus, the results obtained in different systems should be carefully compared.
Our analysis showed that it would be necessary to consider the force that causes the contact angles deviate from those predicted by Young's equation, i.e., pinning, to explain the properties of surface nanobubbles observed in open systems. The remaining question in experiments is why the pinning occurs on an atomically flat surface such as graphite. It is conceivable that the adsorbed layers of molecules at solid–liquid interfaces work as pinning sites.50–52,61–63 It has been found so far that the adsorbed layers have a thickness of monoatomic to several nanometers,50 appear preferentially at the three-phase contact line of surface nanobubbles,62 and pin the gas phases nucleated on them.50,52 However, it is still under debate whether the constituent molecules are gases or airborne contaminants.63,64 Moreover, the pinning of surface nanobubbles by gas molecule-adsorbed layers and their nanoscopic thickness have never been reproduced by MD simulations. We expect that further experiments and simulations considering not only the gas molecule-adsorbed layers but also the concentration of ions in solutions and the electric charge at interfaces will provide valuable insights and address the origin of nanoscale pinning, which is essential for the development of micro- and nano-fluidic systems.
Conclusions
We quantified the interfacial tensions working on nitrogen surface nanobubbles at graphite–water interfaces through mechanical and thermodynamic routes. It was found that Young's equation holds even on the nanobubbles with a footprint diameter of a few nanometers. Furthermore, although a size-dependent change in their contact angle was observed, it was revealed that the effect of inner gas molecules on their interfacial tensions is negligible for the submicron-sized semispherical surface bubbles typically observed by AFM measurements. Therefore, the van der Waals interaction-induced gas molecular adsorption cannot explain the experimentally observed stability and flatness of surface nanobubbles. Our theoretical prediction also shows that surface nanobubbles with a footprint diameter of hundreds of nanometers cannot have an ultrahigh density of tens to hundreds kg m−3 only by the van der Waals interaction. The unexpected stability of surface nanobubbles without pinning in MD simulations, which contradicts the previous AFM results, was explained by extremely high gas supersaturation induced by the closed conditions, implying the necessity of the pinning for the stability of surface nanobubbles in open systems.Methods
The detailed setup of the nanobubble simulation systems
All MD simulations of surface nanobubbles have been performed using the LAMMPS65 package with a timestep of 1.0 fs. Periodic boundary conditions were employed in the x- and y-directions for a rectangular calculation cell of 16.17 × 3.19 × 13.0 nm3. The SPC/E model66 was adopted for water and a nitrogen molecule was modeled by a monoatomic 12-6 LJ particle.67 Because the Young's modulus of graphite is on the order of 10 GPa, which is considerably higher than the value that causes non-negligible surface deformation (on the order of 100 kPa68), the influence of surface deformation on three-phase contact lines is not considered. We have also confirmed in our previous work that the vibration of atoms constituting a solid surface does not influence the validity of Young's equation.30 Thus, the positions of the carbon atoms in the graphite were fixed onto the space. The gap between the layers in the graphite is 0.335 nm. Because the cutoff distance for the LJ interaction between the carbon and water and between the carbon and N2 was set at 1.0 nm, further increase in the number of the graphene layers does not affect the simulation results. The inter-molecular interactions among the species were modeled by the 12-6 LJ and coulombic potential as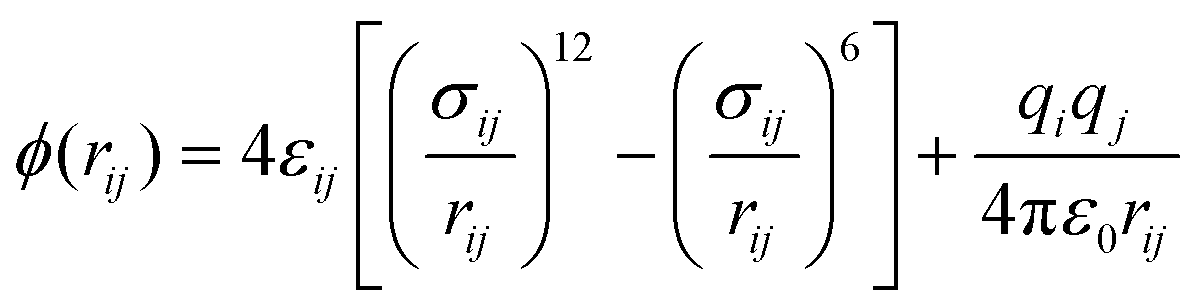 | (5) |
The top graphene basically used as a barostat (piston) was set to be hydrophilic by adjusting the LJ energy between the constituent carbon atom and fluid molecules (N2 and water) so that the surface nanobubbles could nucleate only on the bottom graphite. The hydrophilicity of the top graphene does not affect the properties of surface nanobubbles because there are sufficiently large regions of bulk water between the top hydrophilic graphene and the nanobubbles (shown in ESI Fig. S9†). The cross LJ parameters except for the top graphene were determined using the Lorentz–Berthelot combining rules,69 in which the LJ parameters of the carbon atom were assumed to be σ = 0.34 nm and ε = 0.06575 kcal mol−1.70 The LJ parameters and charge values used in the present study are listed in Table 1.
| Pair | q (e) | σ ij (nm) | ε ij (kcal mol−1) |
|---|---|---|---|
| O–O | −0.8476 | 0.3166 | 0.1555 |
| H–H | 0.4238 | 0 | 0 |
| N2–N2 | 0.3698 | 0.1888 | |
| N2–H2O | 0.3285 | 0.1924 | |
| Wall(C, top) – H2O | 0.3367 | 0.2 | |
| Wall(C, top) – N2 | 0.3549 | 0.01 | |
| Wall(C, bottom) – H2O | 0.3367 | 0.1015 | |
| Wall(C, bottom) – N2 | 0.3549 | 0.1114 × η (η = 1.0, 1.5) |
The fluid temperature was kept at 300 K using the Nosé–Hoover thermostat. The coulombic interactions were calculated by the particle–particle-particle–mesh method.65 A space three times longer than the length of the simulation domain was inserted in the z-direction to avoid the electrostatic interactions from the dummy cells in the wall-normal direction.71 The water bond length was constrained at 0.1 nm by the SHAKE algorithm.72 The system was divided into bins of 0.1 × ly × 0.1 nm3 for the calculation of the density distribution, where ly is the system size in the y-direction.
The details of the methods for the calculation of interfacial tensions
In addition to the simulation systems of surface nanobubbles, we also employed quasi-one-dimensional systems to calculate the corresponding interfacial tensions. We note that the basic setting of molecular models, potential parameters, and the control temperature is the same as that of the nanobubble systems.For the calculation of the liquid–gas interfacial tension, we used two equilibrium simulation systems with a flat-water film: with two liquid–vapor interfaces and with two liquid–gas interfaces (shown in ESI Fig. S10(a)†). Liquid–vapor or liquid–gas interfacial tensions γLV and γLG of the systems can be expressed as
 | (6) |
Next, we employed the system in which N2 molecules were sandwiched between the top graphene and the bottom graphite (shown in ESI Fig. S10(b)†). The solid–gas interfacial tension relative to the solid–vacuum interfacial tension defined as γSG − γS0 was calculated by the Bakker's equation extended for the solid–gas interface30 given by
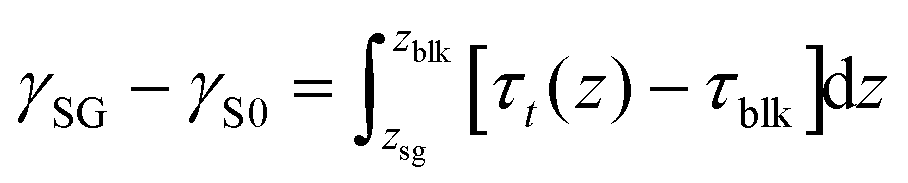 | (7) |
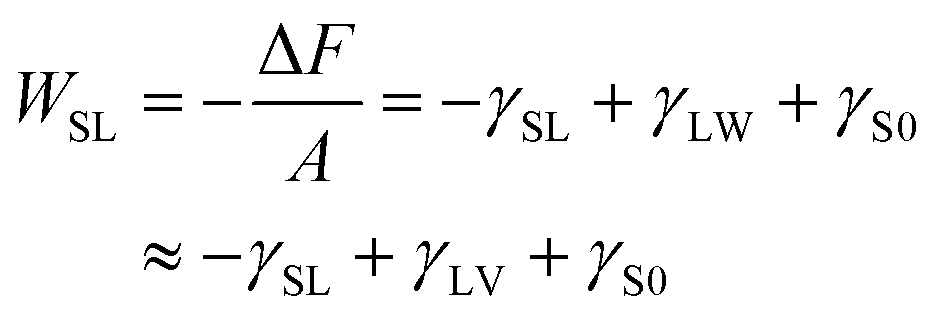
Finally, we calculated the work of adhesion at solid–liquid interfaces WSL as the minimum work needed to separate the liquid from the solid surface per area, which corresponds to the interfacial free energy. Specifically, we employed the equilibrium MD simulation systems of a water–graphite interface shown in ESI Fig. S11(a)† to quasi-statically strip the liquid off from the solid surface using a “phantom wall” under the constant temperature conditions. This is an implementation of the TI method for the calculation of the solid–liquid interfacial free energy.34,43
In the systems of the TI method, a phantom wall that interacts only with water molecules via the repulsive range of the 12-6 LJ model is at first placed sufficiently below the water film, zw = z1. For the present case, z1 is positioned exactly at the middle of the two topmost graphene layers, i.e., approximately 0.4 nm below the lowest water molecules. Then, by quasi-statically moving the phantom wall step by step up to the place where the water film is completely stripped from the graphite surface (zw = z0), the work of adhesion was extracted through the TI along a reversible path. The LJ energy ε and length parameter σ of the phantom wall were 0.316 nm and 0.16 kcal mol−1, respectively. The cutoff distance is set at 0.3546 nm to make the interaction repulsive only. The position of the phantom wall in the z-direction zw(λ) was expressed with a coupling parameter λ as follows:
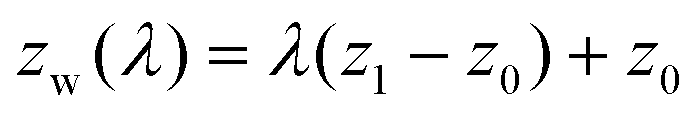 | (8) |
In our case, we calculated multiple equilibrium systems of graphene–water interfaces with discrete coupling parameters λ from 0 to 1.0. The solid–liquid interface at λ = 1.0 is separated to the solid–vacuum and liquid–phantom wall interfaces by changing the coupling parameter to λ = 0 as shown in the left and right panels in ESI Fig. S11(a).† The phantom wall was displaced by 0.01 nm in the z-direction until the force exerted by the wall was confirmed to be close to zero, i.e., the interaction between the liquid film and the graphene surface had become neglectable. A total of 46 simulations were performed, with a displacement of 0.45 nm, i.e., z0 corresponds to the phantom wall positioned 0.3 nm above the topmost graphene layer. The variation of the force exerted by the wall on the liquid as a function of zw is shown in ESI Fig. S11(b).†
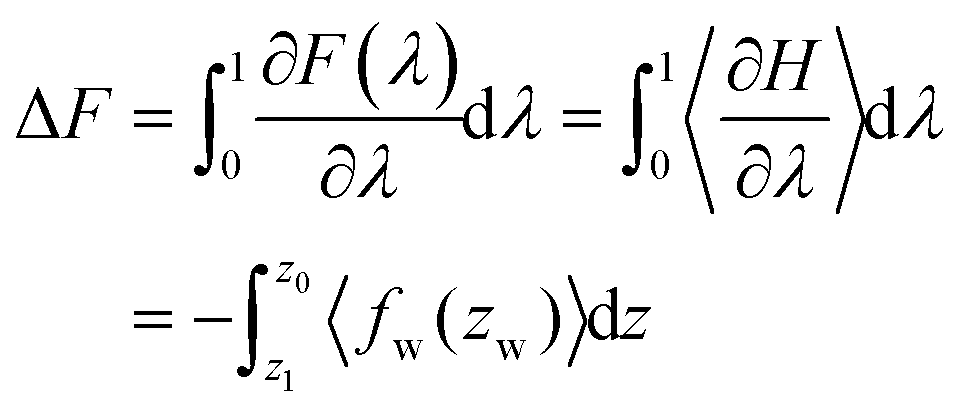
Because the number of molecules N, volume V, and temperature T are constant in the systems, the difference in the Helmholtz free energy ΔF between the systems at zw = z1 and zw = z0 under a constant NVT is expressed by the interfacial free energies as follows:
 | (9) |
Using the NVT canonical ensemble, the difference in the Helmholtz free energy ΔF in eqn (9) is calculated through the TI as
 | (10) |
Conflicts of interest
There are no conflicts to declare.Acknowledgements
We thank Prof. Koji Takahashi at Kyushu University, Prof. Takeshi Omori at Osaka City University, and Haruki Oga and Minori Shintaku at Osaka University for fruitful discussion. This work was partially supported by JST CREST Grant No. JPMJCR18I1, JSPS KAKENHI Grant No. JP18K03978 and JP21K20405, and the Grant-in-Aid for JSPS Research Fellow No. JP20J01307 and JP20J20251.References
- D. Lohse and X. Zhang, Rev. Mod. Phys., 2015, 87, 981–1035 CrossRef CAS.
- J. L. Parker, P. M. Claesson and P. Attard, J. Phys. Chem., 1994, 98, 8468–8480 CrossRef CAS.
- E. E. Meyer, K. J. Rosenberg and J. Israelachvili, Proc. Natl. Acad. Sci. U. S. A., 2006, 103, 15739–15746 CrossRef CAS PubMed.
- P. G. de Gennes, Langmuir, 2002, 18, 3413–3414 CrossRef CAS.
- Y. Tomo, A. Askounis, T. Ikuta, Y. Takata, K. Sefiane and K. Takahashi, Nano Lett., 2018, 18, 1869–1874 CrossRef CAS PubMed.
- L. Gao, G. X. Ni, Y. Liu, B. Liu, A. H. Castro Neto and K. P. Loh, Nature, 2014, 505, 190–194 CrossRef CAS PubMed.
- Y. Nam and Y. S. Ju, Appl. Phys. Lett., 2008, 93, 103115 CrossRef.
- Y. Gao, J. Li, H. C. Shum and H. Chen, Langmuir, 2016, 32, 4815–4819 CrossRef CAS PubMed.
- A. Aikawa, A. Kioka, M. Nakagawa and S. Anzai, Geothermics, 2021, 89, 101962 CrossRef.
- X. H. Zhang, A. Quinn and W. A. Ducker, Langmuir, 2008, 24, 4756–4764 CrossRef CAS PubMed.
- S. R. German, X. Wu, H. An, V. S. J. Craig, T. L. Mega and X. Zhang, ACS Nano, 2014, 8, 6193–6201 CrossRef CAS PubMed.
- H. An, G. Liu, R. Atkin and V. S. J. Craig, ACS Nano, 2015, 9, 7596–7607 CrossRef CAS PubMed.
- H. Teshima, T. Nishiyama and K. Takahashi, J. Chem. Phys., 2017, 146, 014708 CrossRef PubMed.
- X. Zhang, H. Lhuissier, C. Sun and D. Lohse, Phys. Rev. Lett., 2014, 112, 144503 CrossRef PubMed.
- A. Brotchie and X. H. Zhang, Soft Matter, 2011, 7, 265–269 RSC.
- B. H. Tan, H. An and C. D. Ohl, Curr. Opin. Colloid Interface Sci., 2021, 53, 101428 CrossRef CAS.
- D. Lohse and X. Zhang, Phys. Rev. E: Stat., Nonlinear, Soft Matter Phys., 2015, 91, 031003 CrossRef PubMed.
- B. H. Tan, H. An and C. D. Ohl, Phys. Rev. Lett., 2019, 122, 134502 CrossRef CAS PubMed.
- Y. Liu and X. Zhang, J. Chem. Phys., 2013, 138, 014706 CrossRef PubMed.
- X. Zhang, D. Y. C. Chan, D. Wang and N. Maeda, Langmuir, 2013, 29, 1017–1023 CrossRef CAS PubMed.
- B. H. Tan, H. An and C. D. Ohl, Phys. Rev. Lett., 2017, 118, 1–5 Search PubMed.
- Y. X. Chen, Y. L. Chen and T. H. Yen, Langmuir, 2018, 34, 15360–15369 CrossRef CAS PubMed.
- S. Nag, Y. Tomo, H. Teshima, K. Takahashi and M. Kohno, Phys. Chem. Chem. Phys., 2021, 23, 24652–24660 RSC.
- L. Zhou, X. Wang, H. J. Shin, J. Wang, R. Tai, X. Zhang, H. Fang, W. Xiao, L. Wang, C. Wang, X. Gao, J. Hu and L. Zhang, J. Am. Chem. Soc., 2020, 142, 5583–5593 CrossRef CAS PubMed.
- X. H. Zhang, A. Khan and W. A. Ducker, Phys. Rev. Lett., 2007, 98, 136101 CrossRef PubMed.
- L. J. Zhang, H. Chen, Z. X. Li, H. P. Fang and J. Hu, Sci. China, Ser. G: Phys., Mech. Astron., 2008, 51, 219–224 CrossRef.
- N. D. Petsev, L. G. Leal and M. S. Shell, Phys. Rev. Lett., 2020, 125, 146101 CrossRef CAS PubMed.
- S. R. German, M. A. Edwards, Q. Chen and H. S. White, Nano Lett., 2016, 16, 6691–6694 CrossRef CAS PubMed.
- P. Attard, 2015, arXiv, arXiv:1505.02217, 1–16.
- Y. Yamaguchi, H. Kusudo, D. Surblys, T. Omori and G. Kikugawa, J. Chem. Phys., 2019, 150, 044701 CrossRef PubMed.
- G. Bakker, Kapillarität und Oberflächenspannung, Wien-Harms, 1928, vol. 6 Search PubMed.
- S. M. Thompson, K. E. Gubbins, J. P. R. B. Walton, R. A. R. Chantry and J. S. Rowlinson, J. Chem. Phys., 1984, 81, 530–542 CrossRef CAS.
- H. Kusudo, T. Omori and Y. Yamaguchi, J. Chem. Phys., 2019, 151, 154501 CrossRef PubMed.
- C. Bistafa, D. Surblys, H. Kusudo and Y. Yamaguchi, J. Chem. Phys., 2021, 155, 064703 CrossRef CAS PubMed.
- D. Surblys, F. Leroy, Y. Yamaguchi and F. Müller-Plathe, J. Chem. Phys., 2018, 148, 134707 CrossRef PubMed.
- S. Nishida, D. Surblys, Y. Yamaguchi, K. Kuroda, M. Kagawa, T. Nakajima and H. Fujimura, J. Chem. Phys., 2014, 140, 074707 CrossRef CAS PubMed.
- D. Surblys, Y. Yamaguchi, K. Kuroda, M. Kagawa, T. Nakajima and H. Fujimura, J. Chem. Phys., 2014, 140, 034505 CrossRef CAS PubMed.
- Y. Liu and X. Zhang, J. Chem. Phys., 2014, 141, 134702 CrossRef PubMed.
- B. R. Novak, E. J. Maginn and M. J. McCready, Phys. Rev. B: Condens. Matter Mater. Phys., 2007, 75, 085413 CrossRef.
- S. Wang, L. Zhou, X. Wang, C. Wang, Y. Dong, Y. Zhang, Y. Gao, L. Zhang and J. Hu, Langmuir, 2019, 35, 2498–2505 CrossRef CAS PubMed.
- M. Masuduzzaman and B. H. Kim, Microfluid. Nanofluid., 2021, 25, 1–14 CrossRef.
- D. Kim, E. Kim, S. Park, S. Kim, B. K. Min, H. J. Yoon, K. Kwak and M. Cho, Chem, 2021, 7, 1602–1614 CAS.
- F. Leroy and F. Müller-Plathe, J. Chem. Phys., 2010, 133, 044110 CrossRef PubMed.
- A. E. Ismail, G. S. Grest and M. J. Stevens, J. Chem. Phys., 2006, 125, 014702 CrossRef PubMed.
- N. Giovambattista, A. B. Almeida, A. M. Alencar and S. V. Buldyrev, J. Phys. Chem. C, 2016, 120, 1597–1608 CrossRef CAS.
- F. Chen and P. E. Smith, J. Chem. Phys., 2007, 126, 221101 CrossRef PubMed.
- Y. H. Ma, W. Sun, M. Bhandarkar and J. Wang, Sep. Technol., 1991, 1, 90–98 CrossRef CAS.
- H. Swenson and N. P. Stadie, Langmuir, 2019, 35, 5409–5426 CrossRef CAS PubMed.
- B. von Szyszkowski, Z. Phys. Chem., 1908, 64U, 385–414 CrossRef.
- H. Teshima, Y. Takata and K. Takahashi, Appl. Phys. Lett., 2019, 115, 071603 CrossRef.
- H. Teshima, Q. Y. Li, Y. Takata and K. Takahashi, Phys. Chem. Chem. Phys., 2020, 22, 13629–13636 RSC.
- H. Teshima, N. Nakamura, Q. Y. Li, Y. Takata and K. Takahashi, RSC Adv., 2020, 10, 44854–44859 RSC.
- W. H. Hsu and I. S. Hwang, Chem. Sci., 2021, 12, 2635–2645 RSC.
- S. Nag, Y. Tomo, K. Takahashi and M. Kohno, Langmuir, 2021, 37, 874–881 CrossRef CAS PubMed.
- Y. Tomo, K. Takahashi, T. Nishiyama, T. Ikuta and Y. Takata, Int. J. Heat Mass Transfer, 2017, 108, 1460–1465 CrossRef CAS.
- D. Shin, J. B. Park, Y. J. Kim, S. J. Kim, J. H. Kang, B. Lee, S. P. Cho, B. H. Hong and K. S. Novoselov, Nat. Commun., 2015, 6, 1–6 Search PubMed.
- K. Ebina, K. Shi, M. Hirao, J. Hashimoto, Y. Kawato, S. Kaneshiro, T. Morimoto, K. Koizumi and H. Yoshikawa, PLoS One, 2013, 8, 1–7 Search PubMed.
- S. Maheshwari, M. Van Der Hoef, X. Zhang and D. Lohse, Langmuir, 2016, 32, 11116–11122 CrossRef CAS PubMed.
- T. H. Yen, C. H. Lin and Y. L. Chen, Langmuir, 2021, 37, 2759–2770 CrossRef CAS PubMed.
- J. H. Weijs, J. H. Snoeijer and D. Lohse, Phys. Rev. Lett., 2012, 108, 104501 CrossRef PubMed.
- I.-S. Hwang, Y.-H. Lu, C.-W. Yang, C.-K. Fang and H.-C. Ko, Sci. Rep., 2014, 4, 1–8 Search PubMed.
- C. K. Fang, H. C. Ko, C. W. Yang, Y. H. Lu and I. S. Hwang, Sci. Rep., 2016, 6, 1–10 CrossRef PubMed.
- I. Schlesinger and U. Sivan, J. Am. Chem. Soc., 2018, 140, 10473–10481 CrossRef CAS PubMed.
- M. R. Uhlig, S. Benaglia, R. Thakkar, J. Comer and R. Garcia, Nanoscale, 2021, 13, 5275–5283 RSC.
- S. Plimpton, J. Comput. Phys., 1995, 117, 1–19 CrossRef CAS.
- H. J. C. Berendsen, J. R. Grigera and T. P. Straatsma, J. Phys. Chem., 1987, 91, 6269–6271 CrossRef CAS.
- J. O. Hirschfelder, C. F. Curtiss and R. B. Bird, Molecular Theory of Gases and Liquids, Wiley, 1964 Search PubMed.
- R. Pericet-Cámara, A. Best, H. J. Butt and E. Bonaccurso, Langmuir, 2008, 24, 10565–10568 CrossRef PubMed.
- G. H. Hudson and J. McCoubrey, Trans. Faraday Soc., 1959, 56, 761–766 RSC.
- S. J. Stuart, A. B. Tutein and J. A. Harrison, J. Chem. Phys., 2000, 112, 6472–6486 CrossRef CAS.
- I. C. Yeh and M. L. Berkowitz, J. Chem. Phys., 1999, 111, 3155–3162 CrossRef CAS.
- J. P. Ryckaert, G. Ciccotti and H. J. C. Berendsen, J. Comput. Phys., 1977, 23, 327–341 CrossRef CAS.
Footnote |
| † Electronic supplementary information (ESI) available: Normal stress profiles under surface nanobubbles; peak density inside the N2 molecule-adsorbed layers; breakdown of Young's equation for the case of NN2 = 100 and η = 1.0; calculation of the contact angles of semispherical submicron-sized bubbles; bulk N2 density inside the nanobubbles estimated using eqn (4); density distributions of N2 molecules in the nanobubble systems; density distributions of water molecules in the nanobubble systems; and systems used for the calculation of interfacial tensions. See DOI: 10.1039/d1nr07428h |
| This journal is © The Royal Society of Chemistry 2022 |