A highly sensitive and ecofriendly assay platform for the simultaneous electrochemical determination of rifampicin and isoniazid in human serum and pharmaceutical formulations†
Effat
Sharafi
and
Susan
Sadeghi
 *
*
Department of Chemistry, University of Birjand, P.O. Box 97175-615, Birjand, Iran. E-mail: ssadeghi@birjand.ac.ir
First published on 7th December 2022
Abstract
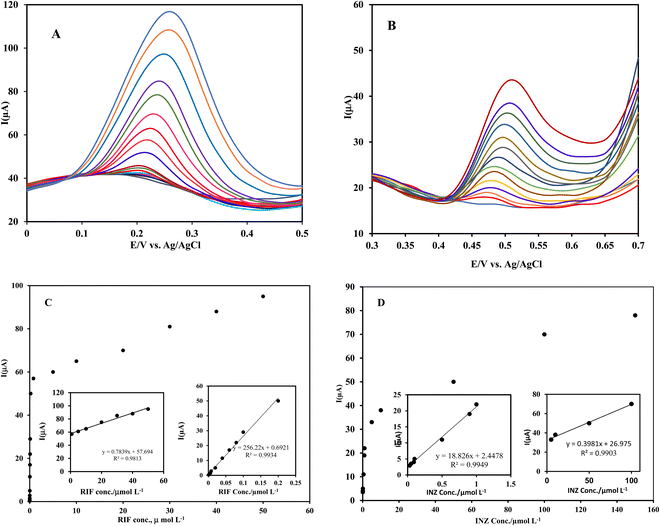
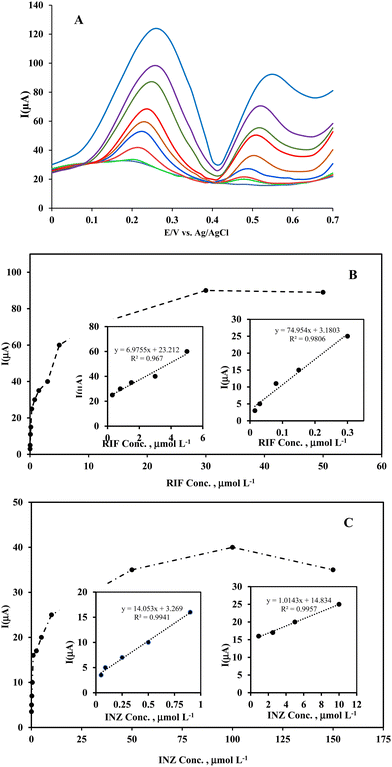
An ultrasensitive and disposable sensor based on a modified screen-printed carbon electrode (SPCE) was developed for rapid quantification of rifampicin (RIF) and isoniazid (INZ) by differential pulse voltammetry (DPV) in complex media. The surface of the SPCE was simply electrochemically modified with a reduced graphene oxide and nickel hydroxide nanofilm (Ni(OH)2@rGO/SPCE) and characterized by atomic force microscopy and cyclic voltammetry. Individual and simultaneous detection of RIF and INZ was accomplished using the Ni(OH)2@rGO/SPCE in the ranges of 1.0 × 10⁻⁹–2.0 × 10⁻⁷ mol L−1 and 2.0 × 10⁻⁷–5.0 × 10⁻⁵ mol L−1 for RIF and 5.0 × 10⁻⁸–1.0 × 10⁻⁶ mol L−1 and 1.0 × 10⁻⁶–1.0 × 10⁻⁴ mol L−1 for INZ with detection limits of 3.0 × 10⁻⁹ mol L−1 and 5.0 × 10⁻⁹ mol L−1, respectively. The developed sensor was successfully applied for the rapid simultaneous determination of analytes in real samples.
1. Introduction
According to the World Health Organization (WHO), tuberculosis is the second most common infectious disease, causing more than one third of deaths.1,2 Considering 90% of early tuberculosis cases occur in less developed regions of the world, one of the biggest challenges is eradicating the resistant form of the disease. Currently, there are ten drugs approved by the United States Food and Drug Administration (USFAD) for the treatment of tuberculosis, which fall into two categories: first-line drugs and second line drugs. Rifampicin (RIF) and isoniazid (INZ) are among the first-line drugs for tuberculosis.1Isoniazid (pyridine-4-carbohydrazide or isonicotinic acid) (INZ) is an antituberculosis drug widely used in tuberculosis chemotherapy.3–5 Rifampicin (RIF), 3-[(4-methyl-1-piperazinyl) imino] methyl rifamycin SV, is the most important antibiotic for the treatment of tuberculosis, leprosy disease, Legionnaires disease, and other serious infections such as HIV.6,7 Anti-tuberculosis drugs associated with liver damage may be more dangerous than acute viral hepatitis.8 INZ is thought to have a stronger toxic effect on the liver than RIF, and administration of this drug with RIF increases hepatoxicity. INZ and RIF are usually co-administered, but in many regions they are formulated in a single dose.9 Because of their small treatment windows, plasma levels of INZ and RIF should be monitored frequently with a reliable tool to achieve more effective treatment, prevent side effects, and improve patients' quality of life. Therefore, simultaneous analysis of these drugs in biological liquids is necessary.10–14 In addition, it is necessary to determine the appropriate content of the active ingredients of these drugs in pharmaceutical forms.
To date, several analytical techniques have been developed for the determination of RIF and INZ in biological fluids and pharmaceutical dosage forms, including thin layer chromatography,15 high performance liquid chromatography (HPLC),16,17 liquid chromatography/tandem mass spectrometry,18 chemiluminescence,19 UV spectrophotometry,20 and capillary zone electrophoresis.21 Some of the above techniques have disadvantages such as complexity and laboriousness of sample preparation, time consumption, costly facilities, and long response time. In recent years, much effort has been established to develop sensitive, accurate, on-site and cost-effective methods for the qualitative and quantitative control of these drugs in real samples.22 Electrochemical sensing is an excellent alternative for drug quantification. Hence, a number of electrochemical methods using hanging mercury drop electrode, gold, carbon paste, glassy carbon, or pencil graphite electrodes have been used for INZ and RIF analyses.23–31
Miniaturization is a crucial factor in the development of new analytical tools. Both ease of use and economic benefits have motivated the development and use of various types of disposable electrochemical sensors. In the last two decades, screen printed electrodes (SPEs) have been introduced as disposable electrochemical sensors and are used in a variety of electrochemical methods. The advantages of SPEs are short response time, simple design, and high mass production capability as a suitable option for on-site and real-time measurements.32 A commercially available SPE consists of a chemically inert substrate onto which three electrodes, namely the working, reference and counter electrodes (WE, RE and CE, respectively), are screen-printed. Different types of substrates are used in the manufacture of these electrodes, including ceramic, polyester, and glass depending on the purposes of analysis. In addition, the diversity in the choice of conductive inks and electrode-related inks provides a wide variety of these electrodes.33 Screen printed carbon electrodes (SPCEs) are another class of carbon electrodes. In fabrication of these electrodes, carbon is a low cost and chemically inert material that provides low background current and offers a wide potential window with low electrical resistance.34 However, to increase the sensitivity, selectivity and improve the electron transfer rate, SPCE surfaces have been modified with suitable modifiers such as conductive polymeric films, surfactants, metallic nanomaterials, carbon-based nanomaterials, magnetic nanoparticles, and quantum dots, leading to improved performance.35–38
Graphene oxide (GO), a derivative of graphene, has been widely used in electrochemical sensing due to its unique properties such as being a green material, having a large surface area, high electrical and mechanical stability, and high oxygen groups available on its surface for anchoring with modifiers. However, the reduction of graphene oxide is essential to modify the electrode surface due to its low electron transfer ability. Reduced graphene oxide (rGO) with a large interfacial surface area, high electrical conductivity, and delocalized π-conjugated electrons improves the response of the modified electrode to the analyte. Nevertheless, the reduction process may decrease the stability of GO, since its electrocatalytic activity and hydrophilicity depend on the oxygen-containing groups on the surface of GO.39 To overcome these problems, modifying the surface of rGO with metal nanomaterials leads to the generation of nanocomposites with the synergistic effects of using rGO and metal nanoparticles, which have catalytic properties, increasing adsorption sites, facilitating the electron transfer process, increasing sensitivity, and improving the performances of modified electrodes.40,41 Despite the recent trend of combining carbon/metal nanostructures in the fabrication of electrochemical sensors, there are few reports on the development of sensors for the simultaneous determination of RIF and INZ. Shiri et al. developed an electrochemical sensor for the simultaneous determination of RIF and INZ based on the C@CuFe2O4 modified carbon paste electrode with detection limits of 0.022 and 0.041 μmol L−1 for RIF and INZ, respectively.42 Recently, Rawool et al. used a glassy carbon electrode modified with a Cu-MOF/mesoporous carbon composite as an electrochemical sensor with detection limits of 0.28 and 0.37 nmol L−1 for the sensitive and selective determination of RIF and INZ, respectively.43
The aim of this work was to employ a simple, rapid, sensitive and reliable method for the simultaneous determination of RIF and INZ using an ultrasensitive voltammetric sensor. Fabrication of the sensor relies on the electrochemical modification of the surface of a homemade SPCE with reduced graphene oxide combined with a nickel hydroxide film (Ni(OH)2/rGO/SPCE) without using toxic chemical agents. The electrochemical behaviors of the modified SPCE were investigated by cyclic voltammetry (CV), differential pulse voltammetry (DPV) and electrochemical impedance spectroscopy (EIS). Compared to several electrodes reported for the simultaneous determination of RIF and INZ, the prepared electrode has a lower or similar detection limit. In addition, low cost, disposable, short accumulation time and rapid analysis are the advantages of this electrode, which may be suitable for the detection of RIF and INZ in clinical laboratories. The developed sensor was used to determine RIF and INZ individually as well as simultaneously in blood serum and a pharmaceutical formulation by DPV.
2. Experimental
2.1. Reagents and chemicals
All chemicals were of analytical grade. Isoniazid (INZ) and Rifampicin (RIF) were kindly obtained from Hakim and Darou-Pakhsh Pharmaceutical Companies (Tehran, Iran), respectively. Stock solutions of INZ and RIF (0.005 mol L−1) were freshly prepared by dissolving an appropriate amount of the drug powder in deionized water. Working solutions were prepared by diluting standard solutions with phosphate buffer (PB). Graphite powder (size ≤50 mm) and silver nitrate were purchased from Merck (Darmstadt, Germany). Benzyl acetate (BA) and poly(vinyl chloride) (PVC) were supplied by Fluka (Fluka Chemie GmbH, Buchs, Switzerland). In these experiments, acetate buffer and phosphate buffer (0.1 mol L−1) were used to adjust the pH in the ranges of 3.0–6.0, and 2.0–11.0, respectively. Homemade silver ink was prepared by incorporating Ag nanoparticles with an average size of 40 nm in PVC powder with a weight ratio of 98![[thin space (1/6-em)]](https://www.rsc.org/images/entities/char_2009.gif) :
:![[thin space (1/6-em)]](https://www.rsc.org/images/entities/char_2009.gif) 2 in a 1
2 in a 1![[thin space (1/6-em)]](https://www.rsc.org/images/entities/char_2009.gif) :
:![[thin space (1/6-em)]](https://www.rsc.org/images/entities/char_2009.gif) 1 mixture of acetone–cyclohexanone solvent. Homemade carbon ink containing graphite, powder PVC and benzyl acetate (BA) of 53, 6, and 35% by weight, respectively, dispersed in a 1
1 mixture of acetone–cyclohexanone solvent. Homemade carbon ink containing graphite, powder PVC and benzyl acetate (BA) of 53, 6, and 35% by weight, respectively, dispersed in a 1![[thin space (1/6-em)]](https://www.rsc.org/images/entities/char_2009.gif) :
:![[thin space (1/6-em)]](https://www.rsc.org/images/entities/char_2009.gif) 1 mixture of acetone–cyclohexanone was used to print the electrode surface.44,45
1 mixture of acetone–cyclohexanone was used to print the electrode surface.44,45
2. 2 Apparatus
Electrochemical measurements were performed using a Meterohm 746 VA trace analyzer and a 747 VA stand (Herisau, Switzerland). The electrochemical cell was assembled with an Ag/AgCl/3 M KCl reference electrode, a platinum wire auxiliary electrode, and a homemade modified SPCE. Deionized water was prepared using an AquaMax water purification system (Young-Lin, Hogye-dong, Korea). pH was measured using a Corning 125 pH meter (Lab Equipment's Ltd, Ontario, Canada) equipped with a combined glass electrode. A Branson ultrasonic cleaner model 2510 (Branson Ultrasonics Corp., Danbury, USA) was used to disperse the ink components in their solvents. Characterization of the functional groups on the synthesized GO was performed using a 370AVATAR Fourier transform infrared (FT-IR) spectrophotometer (Thermo Nicolet, USA) on finely powders pressed on KBr plates in the wavenumber range of 400–4000 cm−1. The topology of the electrode surfaces was investigated using a DME C-32 atomic force microscope (AFM) equipped with a DS95-50E tip scanner and a C-26 Dual scope/Raster scope controller (DME Nanotechnologie GmbH, Germany). Electrochemical impedance spectroscopy (EIS) tests were carried out with an Autolab potentiostat/galvanostat PGSTAT302N (Metrohm, Switzerland) by applying 10 mV AC voltage over the frequency range from 0.1 Hz to 100 kHz in 0.1 mol L−1 KCl solution containing a 5 mmol L−1 K4[Fe (CN)6]/K3[Fe (CN)6] redox probe at the open circuit potential. NOVA software was applied to fit the EIS data with the corresponding equivalent circuit model.2.3. Fabrication of an SPCE
A homemade screen-printed carbon electrode was fabricated according to our previous reports.44,45 A conductive pad was printed on a PVC sheet as a printing substrate using homemade silver ink. Then, the working electrode was printed with carbon ink on the silver connection pad. To protect the printed parts of the electrode from the solution, the entire surface of the electrode except for the surface of the working electrode and the connection of the electrode to the circuit was covered with a layer of insulating ink. After the deposition of each layer, the fabricated electrodes were stored in a dry place at 4 °C.2.4 Preparation of reduced graphene oxide based modified SPCE (rGO/SPCE)
Graphene oxide (GO) was prepared by oxidizing graphite according to the improved Hummers' method.46 Briefly, a mixture of concentrated H2SO4/H3PO4 (360![[thin space (1/6-em)]](https://www.rsc.org/images/entities/char_2009.gif) :
:![[thin space (1/6-em)]](https://www.rsc.org/images/entities/char_2009.gif) 40 mL) was added to a mixture of graphite/KMnO4 in a weight ratio of 3
40 mL) was added to a mixture of graphite/KMnO4 in a weight ratio of 3![[thin space (1/6-em)]](https://www.rsc.org/images/entities/char_2009.gif) :
:![[thin space (1/6-em)]](https://www.rsc.org/images/entities/char_2009.gif) 18 at 50 °C and stirred for 12 hours. The reaction was cooled to room temperature and transferred to an ice bath containing 30% H2O2 (3 mL). The resulting solution was centrifuged, and then filtered. The solids were then washed three times with 30% HCl and water and dried overnight in a vacuum oven at 80 °C. Then, 2.0 mg of GO powder was dispersed in 1.0 mL of H2O and homogenized by sonicating for 10 minutes.
18 at 50 °C and stirred for 12 hours. The reaction was cooled to room temperature and transferred to an ice bath containing 30% H2O2 (3 mL). The resulting solution was centrifuged, and then filtered. The solids were then washed three times with 30% HCl and water and dried overnight in a vacuum oven at 80 °C. Then, 2.0 mg of GO powder was dispersed in 1.0 mL of H2O and homogenized by sonicating for 10 minutes.
Prior to modifying the electrode surface, to clean the surface of the bare SPCE from possible contamination, it was activated twenty times by cyclic voltammetry using a potential sweep from 1.0 to −1.0 V (vs. Ag/AgCl) at a scan rate of 50 mV s−1 in 0.1 mol L−1 HCl/KCl solution. Then, 5 μL of the prepared GO suspension (2 mg mL−1) was dropped onto the working surface of the SPCE and dried at room temperature.35,40 GO on the SPCE surface was electrochemically reduced to rGO by cyclic voltammetry in 0.1 mol L−1 phosphate buffer (PB) at pH 7.0 in a potential window from 0 V to −1.5 V with a scan rate of 50 mV s−1. The reduction degree of GO was controlled by performing a certain number of CV cycles (5 cycles). The prepared electrode was denoted as rGO/SPCE.
2.5. Preparation of Ni (OH)2/rGO modified SPCE
Nickel metal nanoparticles were first electrodeposited on the rGO/SPCE surface from nickel nitrate solution (1 mmol L−1, pH 5.0) under gentle stirring with cathodic reduction at −1.0 V (vs. Ag/AgCl) for 100 seconds.47 Afterwards, to prepare a nickel hydroxide nanofilm on the surface of the rGO/SPCE, the cyclic voltammetry method was performed in 0.1 mol L−1 NaOH solution in the potential range of −0.50 to 0.80 V with a scan rate of 100 mV s−1 for 3 cycles. The resulting electrode is referred to as the Ni (OH)2/rGO/SPCE.2.6 Preparation of real samples
Human blood serum was kindly provided by a local hospital (Imam Reza Hospital Central Laboratory, Birjand, Iran). To prepare serum samples, 0.4 mL of human serum, 0.5 mL of RIF or INZ solutions at certain concentrations, and 0.5 mL of acetonitrile were mixed for the precipitation of proteins and stirred for 30 minutes. Then, centrifugation at 5000 rpm was used to separate the precipitated proteins. The supernatants were diluted with 0.1 M PB at pH = 3. The resulting solutions were treated with the developed method and the voltammetric responses were recorded. The content of RIF or INZ was obtained by the standard addition method.Commercial isoniazid and rifampicin tablets, each formulation containing 100 mg of active ingredient, were obtained from Darou-Pakhsh Pharmaceutical Company and Hakim Pharmaceutical Company (Tehran, Iran), respectively. The contents of five tablets of each drug were ground to obtain a fine homogeneous powder and the average weight of one tablet was calculated. Then, a certain amount of powder was weighed and dissolved in water containing two drops of sodium hydroxide solution (1 mol L−1) by ultrasound for 15 minutes. The supernatant was diluted in a volumetric flask with 0.1 mol L−1 PB at pH = 3 to get the final concentration within the linear range of the calibration curve for each drug and treated with the developed method. The same procedure was applied to the drug mixture tablet. Various solutions with different drug concentrations were examined and drug contents were determined with calibration curves and recoveries were calculated. Each experiment was repeated three times.
3. Results and discussion
3.1. Characterization of the GO/SPCE and Ni (OH)2/rGO/SPCE
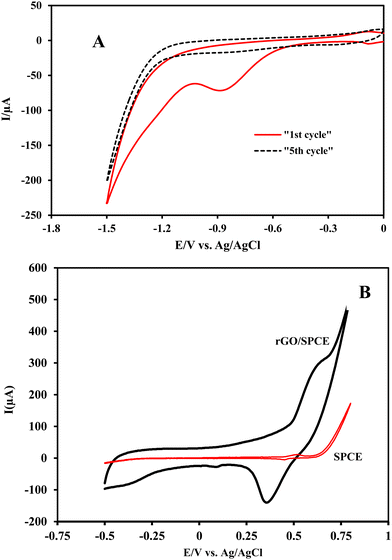
The formation of an rGO film at the GO/SPCE was performed by cyclic voltammetry in a potential window from 0 to −1.5 V. The cathodic peak corresponding to the reduction of the oxygen containing groups on GO is observed at −0.87 V (vs. Ag/AgCl) in PB (pH = 7) in the first cycle which significantly decreased in the second cycle and disappeared after several potential sweeps (Fig. 1A). This observation demonstrated that some electroactive oxygen species on the GO surface undergo an irreversible electrochemical reduction and GO is partially reduced to rGO.Electrodeposition of nickel oxide nanoparticles on the rGO/SPCE surface was carried out by direct reduction of nickel nitrate in acetate buffer (pH = 5) at −1.0 V (vs. Ag/AgCl). Then, the electrode was immersed in 0.1 mol L−1 NaOH solution and electrochemically converted to a Ni(OH)2 film by three consecutive potential scans from −0.5 to 0.8 V. The appearance of a peak at 0.63 V (vs. Ag/AgCl) during the anodic potential scan relates to the formation of NiO(OH), which decreased in the negative scan and a cathodic peak appeared at 0.35 V (vs. Ag/AgCl), confirming the reduction of the Ni(OH)2 nanofilm (Fig. 1B). Both redox peaks can be attributed to the formation of Ni(OH)2 on the rGO/SPCE surface.47,48
The UV-Vis spectrum of GO shows a strong absorption peak at 230 nm attributed to the π–π* transition of graphite C–C bonds and a shoulder at 300 nm assigned to the n–π* transition of C![[double bond, length as m-dash]](https://www.rsc.org/images/entities/char_e001.gif) O bond (Fig. S1, ESI†).
O bond (Fig. S1, ESI†).
The FT-IR spectrum of GO (Fig. 2A) shows absorption peaks at 3400, 1710, 1610, 1200, and 1050 cm−1 corresponding to the stretching vibrations of O–H, C–O, C–C, C–OH and C–O–C bonds, respectively. These peaks indicated the presence of hydroxyl, carboxyl, and epoxy groups on GO.35
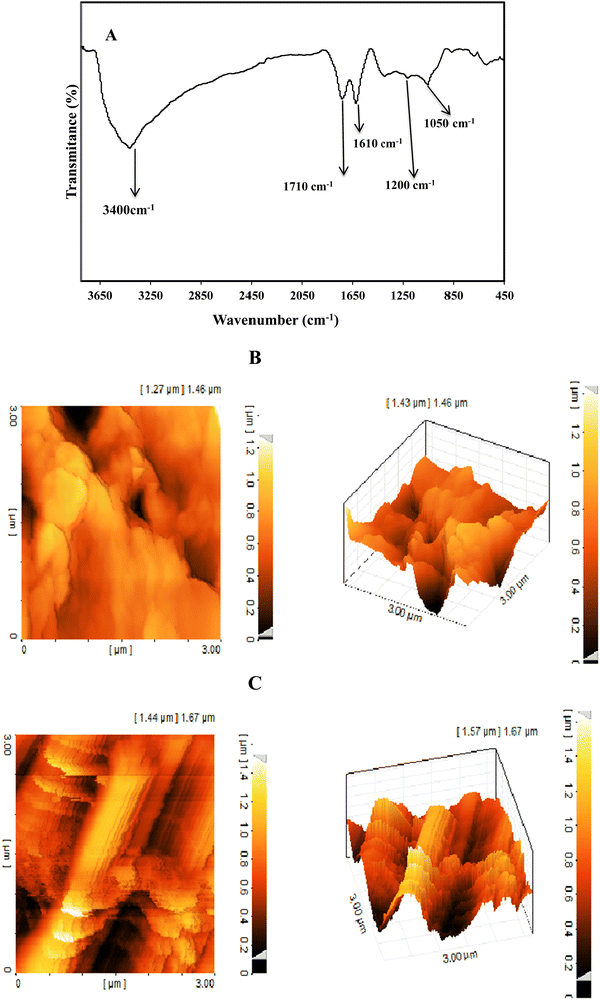 | ||
| Fig. 2 FT-IR spectrum of GO (A), two and three dimensional AFM images of the rGO/SPCE (B) and Ni(OH)2/rGO/SPCE (C). | ||
The surface topography of the electrodes was investigated with two- and three-dimensional AFM images (Fig. 2B and C). The surface roughness of the Ni(OH)2/rGO/SPCE was estimated to be 6.11 nm, which was higher than that of the rGO/SPCE (1.8 nm), indicating that the presence of Ni(OH)2 NPs increases the active sites on the surface of the rGO/SPCE.
3.2. Electrochemical behavior of the modified SPCEs
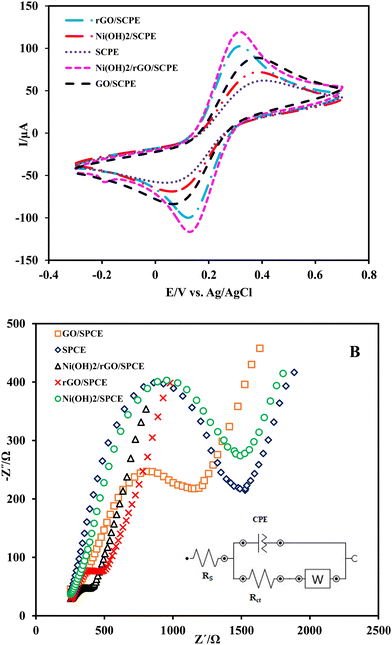
The electrochemical characteristics of different electrodes, including bare SPCE, GO/SPCE, rGO/SPCE and Ni(OH)2/rGO/SPCE, were carried out by recording cyclic voltammograms of the electrodes in 5.0 mmol L−1 K4Fe(CN)6/K3Fe(CN)6 and 0.1 mol L−1 KCl solution in the potential range of −300 to 700 mV (vs. Ag/AgCl) with a potential scan rate of 50 mV s−1. Fig. 3A shows a negative shift in peak potential for the Ni(OH)2/rGO/SPCE compared to the rGO/SPCE. Moreover, the Ni(OH)2/rGO/SPCE shows a decrease in the anodic and cathodic separating peak potentials (ΔEp = 0.160 V) and an increase in the anodic to cathodic current ratio (Ipa/Ipc) compared to the rGO/SPCE, GO/SPCE and bare SPCE. It seems that the electrochemical performance of the SPCE modified with rGO and Ni(OH)2 NPs is improved probably due to the catalytic effect of nanoparticles and the increase of the effective surface area of rGO.The electrochemical impedance spectroscopy (EIS) technique was employed for the electrochemical characteristics of bare and modified SPCEs in 0.1 mol L−1 KCl containing 5 mmol L−1 K4Fe(CN)6/K3Fe(CN)6 over the frequency range of 0.1 Hz to 105 Hz. The Nyquist plots of EIS showed a semicircle at higher frequencies corresponding to the charge transfer resistance (Rct), which depends on the dielectric and insulation characteristics at the electrode/electrolyte interface, and a linear part that appears at low frequency represents the mass transfer resistance. The Nyquist plots of the bare SPCE, GO/SPCE, rGO/SPCE, Ni(OH)2/SPCE, and Ni(OH)2/rGO/SPCE are shown in Fig. 3B. As can be seen, the Rct at the SPCE for the access of the probe ions to the electrode surface was higher than that of the GO/SPCE (1.28 kΩ vs. 725 Ω), but the electrochemical reduction of GO improved the electrical conductivity of the rGO/SPCE (Rct =280 Ω). Also, the smaller Rct value at the Ni(OH)2/rGO/SPCE (224 Ω) indicates that the presence of Ni(OH)2 film further enhanced conductivity.
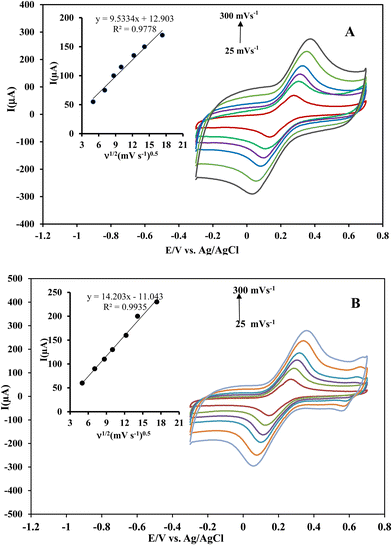
To confirm these results, the effective surface areas of the Ni(OH)2@rGO/SPCE and rGO/SPCE were evaluated by cyclic voltammetry in a solution of 5 mmol L−1 [Fe(CN)6]4− containing 0.1 mol L−1 KCl with different potential scan rates (25–300 mV s−1) (Fig. 4A and B). The effective surface area of the electrodes can be evaluated from the slope of the forward peak current (Ip) against the square root of the applied potential scan rate (ν1/2) by Randles–Sevcik (R–S) for the quasi-reversible process (eqn (1)):49
 | (1) |
Therefore, Ni(OH)2/RGO/SPCE was selected as a suitable electrode for the determination of INZ and RIF.
3.3 Electrochemical behavior of INZ and RIF onto Ni(OH)2/rGO/SPCE surface
To confirm the ability of the modified SPCEs to detect INZ and RIF, the electrochemical behaviors of the analytes at different prepared electrodes were investigated by cyclic voltammetry. After degassing the analyte solution, the SPCE electrode was cycled in phosphate buffer (0.1 mol L−1, pH 5) within the potential range of −300 to 600 mV (vs. Ag/AgCl) at a scan rate of 50 mV s−1 until a reproducible response was obtained. Then, the electrode was introduced to the analyte solution and the voltammogram was recorded. Fig. 5A and B display cyclic voltammograms of the electrochemical behaviors of RIF and INZ (50 μmol L−1 in PB, pH 5) at bare SPCE, rGO/SPCE and Ni(OH)2/rGO/SPCE. A well-defined pair of anodic and cathodic peaks was observed in the RIF cyclic voltammogram, appearing at 40 and 220 mV, respectively (Fig. 5A). This quasi-reversible behavior may relate to the oxidation of hydroquinone moiety in RIF. However, INZ exhibits an oxidation peak at 370 mV (vs. Ag/AgCl) without a reduction peak in the reverse direction of the potential scan, indicating the irreversible nature of oxidation of amide moiety in INZ (Fig. 5B). The significant increase in peak current with a negative shift in the anodic peak potentials of RIF and INZ at Ni(OH)2/rGO/SPCE compared to bare SPCE reveals the rapid electron transfer of rGO and the electrocatalytic effect of Ni(OH)2 on the electrode surface toward the oxidation of target analytes.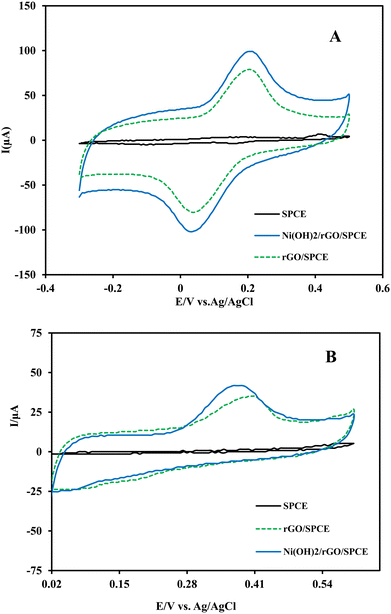 | ||
| Fig. 5 Typical cyclic voltammograms of bare SPCE, rGO/SPCE, and Ni(OH)2/rGO/SPCE in RIF (A) and INZ (B) solutions each at 50 μmol L−1; Scan rate = 50 mV s−1. | ||
The electrochemical behavior of RIF on Ni(OH)2/rGO/SPCE at different scan rates from 25 to 200 mV s−1 was also investigated by cyclic voltammetry (Fig. S2-curve A, ESI†). As shown, the cathodic and anodic peak currents (Ip) increase linearly upon increasing scan rates (ν), so that the dependence of Ip on the square root of scan rate is expressed by the equations Ipc (mA) = 0.8514 ν1/2 (V s−1) − 0.0883 and Ipa(mA) = −0.7476 ν1/2 (V s−1) + 0.0734 with correlation coefficients of 0.9963 and 0.9978, respectively, suggesting that the electrochemical process is controlled by diffusion of analyte in the interfacial reaction zone of the SPCE surface (Fig. S2-curve B, ESI†).
Meanwhile, the plots of peak currents versus scan rates also revealed a linear behavior over the scan rate ranging from 25 to 200 mV s−1 (Fig. S2-curve C, ESI†), so that the linear dependence of log![[thin space (1/6-em)]](https://www.rsc.org/images/entities/char_2009.gif) Ip on log scan rate is given with the equations log
Ip on log scan rate is given with the equations log![[thin space (1/6-em)]](https://www.rsc.org/images/entities/char_2009.gif) Ipa (mA) = 0.8234 log ν (V s−1) + 0.0614 and log
Ipa (mA) = 0.8234 log ν (V s−1) + 0.0614 and log![[thin space (1/6-em)]](https://www.rsc.org/images/entities/char_2009.gif) Ipc (mA) = 0.8014 log ν (V s−1) − 0.0036 with correlation coefficients of 0.9987 and 0.9979, corresponding to the oxidation and reduction of RIF, respectively. The slopes for the two linear curves are between 0.5 and 1.0, suggesting that a mixed adsorption-diffusion mechanism may control the electrochemical process of RIF at Ni(OH)2@rGO/SPCE.50
Ipc (mA) = 0.8014 log ν (V s−1) − 0.0036 with correlation coefficients of 0.9987 and 0.9979, corresponding to the oxidation and reduction of RIF, respectively. The slopes for the two linear curves are between 0.5 and 1.0, suggesting that a mixed adsorption-diffusion mechanism may control the electrochemical process of RIF at Ni(OH)2@rGO/SPCE.50
In a further investigation, it was found that the peak potentials (Ep) changed linearly with the increasing logarithm of scan rate with a positive shift in the anodic peak potential, whereas the cathodic peak potential shifted negatively with increasing scan rate (Fig. S2, curve D, ESI†). Moreover, the peak-to-peak separation potential (ΔEp) was less than 200 mV, confirming the quasi-reversible electron transfer process on the Ni(OH)2/rGO/SPCE for RIF. The linear relationship between the peak potential (Ep) and the logarithm of scan rate (log![[thin space (1/6-em)]](https://www.rsc.org/images/entities/char_2009.gif) ν) is expressed by linear relationship as the following equations:
ν) is expressed by linear relationship as the following equations:
Epa (V) = 0.1746 log![[thin space (1/6-em)]](https://www.rsc.org/images/entities/char_2009.gif) ν (V s−1) + 0.5117 (r2 = 0.9621) ν (V s−1) + 0.5117 (r2 = 0.9621) | (2) |
Epc (V) = −0.1524 log![[thin space (1/6-em)]](https://www.rsc.org/images/entities/char_2009.gif) ν (V s−1) − 0.1116 (r2 = 0.9753) ν (V s−1) − 0.1116 (r2 = 0.9753) | (3) |
According to Laviron's theory for quasi-reversible electrochemical process, the slope of Epversus log![[thin space (1/6-em)]](https://www.rsc.org/images/entities/char_2009.gif) ν plot for cathodic and anodic peaks correspond to −2.3RT/αnF and 2.3RT/(1 − α)nF, respectively. The anodic electron transfer coefficient (α) and electron transfer number (n) for electrooxidation of RIF were estimated to be 0.61 and 0.77, respectively. These results suggest that oxidation of RIF is easier than reduction at Ni(OH)2/rGO/SPCE and the oxidation mechanism involves one electron transfer. In addition, the apparent heterogeneous electron transfer rate constant (ks) was calculated by eqn (4) and found to be 0.51 s−1, which means that the electron transfer process is fast enough at Ni(OH)2/rGO/SPCE.51
ν plot for cathodic and anodic peaks correspond to −2.3RT/αnF and 2.3RT/(1 − α)nF, respectively. The anodic electron transfer coefficient (α) and electron transfer number (n) for electrooxidation of RIF were estimated to be 0.61 and 0.77, respectively. These results suggest that oxidation of RIF is easier than reduction at Ni(OH)2/rGO/SPCE and the oxidation mechanism involves one electron transfer. In addition, the apparent heterogeneous electron transfer rate constant (ks) was calculated by eqn (4) and found to be 0.51 s−1, which means that the electron transfer process is fast enough at Ni(OH)2/rGO/SPCE.51
log![[thin space (1/6-em)]](https://www.rsc.org/images/entities/char_2009.gif) Ks = α Ks = α![[thin space (1/6-em)]](https://www.rsc.org/images/entities/i_char_2009.gif) log(1 − α) + (1 − α) log(1 − α) + (1 − α)![[thin space (1/6-em)]](https://www.rsc.org/images/entities/char_2009.gif) log log![[thin space (1/6-em)]](https://www.rsc.org/images/entities/char_2009.gif) α − log(RT/nFν) − α(1 − α) nFΔEp/2.3RT α − log(RT/nFν) − α(1 − α) nFΔEp/2.3RT | (4) |
The electrochemical behaviors of INZ at the Ni(OH)2/rGO/SPCE at different scan rates from 25 to 200 mV s−1 were also investigated by cyclic voltammetry (Fig. S3-curve A, ESI†). A plot of INZ oxidation peak current was linearly depended on scan rates with the regression equation of Ipa (mA) = 4.398 ν1/2 (mV s−1) + 0.0533 and correlation coefficient of 0.9883 (Fig. S3, curves B and C, ESI†). Also, the oxidation peak potential (Ep) shifted to more positive values with increasing scan rate and showed a linear relationship with the equation Epa (V) = 0.0963![[thin space (1/6-em)]](https://www.rsc.org/images/entities/char_2009.gif) log
log![[thin space (1/6-em)]](https://www.rsc.org/images/entities/char_2009.gif) ν(V s−1) + 0.5986 and a correlation coefficient of 0.9828 (Fig. S3, curve D, ESI†). According to Laviron theory for an irreversible electron transfer process, αn can be evaluated from the slope of Epaversus log ν plot (eqn (5)).
ν(V s−1) + 0.5986 and a correlation coefficient of 0.9828 (Fig. S3, curve D, ESI†). According to Laviron theory for an irreversible electron transfer process, αn can be evaluated from the slope of Epaversus log ν plot (eqn (5)).
Epa = E°′ − (RT/αnF)![[thin space (1/6-em)]](https://www.rsc.org/images/entities/char_2009.gif) ln(RTks/αnF) + (RT/αnF)ln ν ln(RTks/αnF) + (RT/αnF)ln ν | (5) |
| |Ep − Ep/2| = 47.7/αn mV at 25 °C | (6) |
3.4. Optimization of experimental conditions
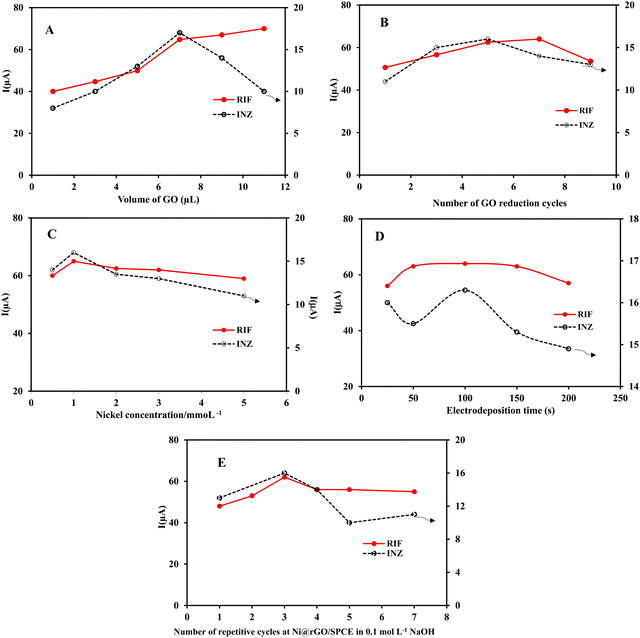
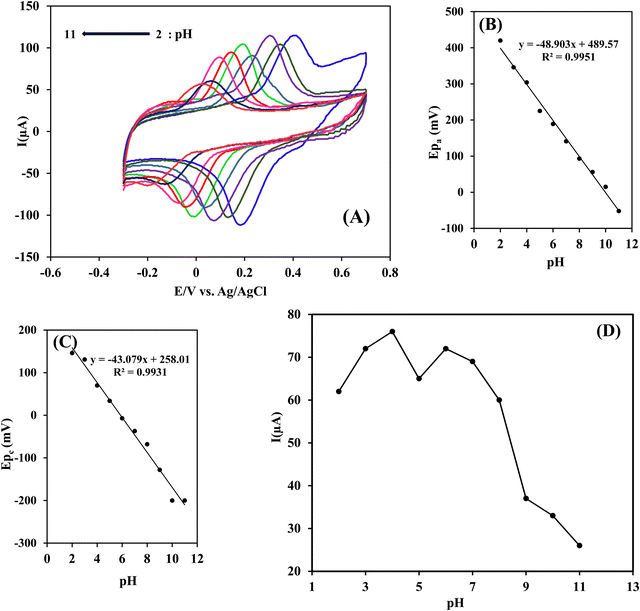
To optimize the experimental conditions affecting the performance of the Ni(OH)2/rGO/SPCE electrode, cyclic voltammograms were recorded and analyzed. The response of the electrode in each step of optimization was examined by differential pulse voltammetry of 5 × 10⁻⁵ mol L−1 RIF and INZ solutions in PB and the peak currents were measured.Partial electroreduction of GO enables a balance between the conductivity and the electron transfer rate of the electrode surface. To reduce the oxygen containing groups of GO on the surface of GO/SPCE, successive cyclic voltammetry was performed from 0 to −1.5 V in buffer solution at pH 7.0. As shown in Fig. 1A, a cathodic peak related to the reduction of oxygen functionality in GO appeared at −0.87 V in the first cycle. After the second cycle, the cathodic current decreased but the background current increased, indicating an irreversible process in the reduction of GO and a gradual increase in the conductivity of the rGO film. The high current responses of the electrochemical oxidation of INZ and RIF at Ni(OH)2/rGO/SPCE were achieved by DPV after five cycles of GO reduction (Fig. 6B). This phenomenon is attributed to two competing effects: the higher reduction degree of rGO provides a large surface area of sp2-carbon, which can adsorb a large number of analyte molecules through π–π interaction and increase the peak current signal. Meanwhile, the reduction process removes the oxygen-containing groups, making the rGO more hydrophobic and preventing the adsorption of hydrophilic analyte molecules on the surface of the rGO modified SPCE, thereby reducing the peak current signal.35
Since the duration of the potential step affects the thickness of the nickel hydroxide film, different deposition times (25, 50, 100, 150, and 200 s) were studied. It was found that the faradic current increased up to 100 seconds and decreased beyond that, revealing slow electron transfer with increasing film thickness. Therefore, the deposition time of 100 seconds was chosen as optimal (Fig. 6D).
To prevent thec electrochemical dissolution and passivation of nickel oxide nanoparticles, the modified electrode was subjected to 0.1 M NaOH treatment and cyclic voltammetry was performed at a scan rate of 50 mV s−1 to form a stable nickel hydroxide film. It is clear that with the increase in the number of cycles, the thickness of the nickel hydroxide film and the oxidation peak current of the analytes also increases, but the excessive layer thickness causes the current to decrease due to the slower electron transfer rate. Therefore, three passivation cycles were selected as the optimal value (Fig. 6E).
| Ep = −2.3RT/F (h/n) pH + K | (7) |
3.5 Analytical characterization
A comparison of the prepared electrode with other reported electrodes for the simultaneous determination of RIF and INZ42,43,52–54 is summarized in Table 1. It can be seen that Ni(OH)/rGO/SPCE has a lower or similar detection limit in most cases. In addition, low cost, disposable, short accumulation time and rapid analysis are the advantages of this electrode, which may be suitable for the detection of RIF and INZ in clinical laboratories.
| Electrode | Method | Linear range (μmol L−1) | LOD (μmol L−1) | SD (%) | Ref. | |||
|---|---|---|---|---|---|---|---|---|
| RIF | INZ | RIF | INZ | RIF | INZ | |||
| a Carbon paste electrode. b Hanging mercury drop electrode. c Magnetic core-shell carbon dots@CuFe2O4. d Cu-MOF/mesoporous carbon composite/molecularly imprinted polymer. | ||||||||
| CPEa | SWV | 0.5–50 | 0.5–40 | 50 | 61 | 1.14 | 1.34 | 52 |
| CPE | LSV | 0.005–0.073 | 0.015–0.109 | 0.0012 | 0.0029 | 4.0 | 4.0 | 53 |
| HMDEb | DPV | 0.48–2.43 | 1.8–9.11 | 0.085 | 0.36 | 0.6 | 0.4 | 54 |
| C-dots@CuFe2O4/CPEc | SWV | 0.07–8.0 | 0.1–14.0 | 0.022 | 0.041 | 2.36 | 2.21 | 42 |
| Cu-MOF/MC/MIP/GCEd | AdSDPV | 0.08–85.0 | 0.08–85.0 | 0.28 × 10⁻³ | 0.37 × 10⁻³ | 1.20 | 1.45 | 43 |
| Ni(OH)2@rGO/SPCE | DPV | 0.015–100.0 | 0.05–150 | 0.003 | 0.005 | <3.6 | <3.6 | This work |
3.6. Interference study
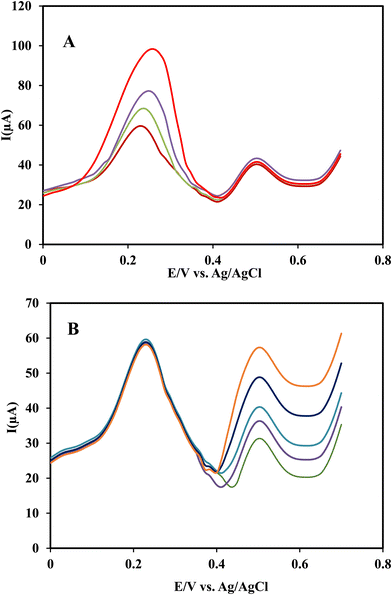
To investigate the effect of INZ on RIF determination, the concentration of RIF was varied in the range of 3.0 × 10⁻⁷–3.0 × 10⁻⁵ mol L−1, while the concentration of INZ was fixed at 5.0 × 10⁻⁶ mol L−1. To investigate the interference of RIF at a concentration of 5.0 × 10⁻⁷ mol L−1 in the determination of INZ, the same procedure was performed. From Fig. 10-curves A and B, it can be seen that when the concentration of each analyte increases, the oxidation peak current also increases regularly, while the peak current of the other analyte doesn’t change, indicating that the analytes do not interfere in the measurement with each other, and this method can be applied for the simultaneous determination of RIF and INZ.To evaluate the selectivity of the method in the simultaneous determination of RIF and INZ, the effect of potentially interfering substances commonly found in blood serum (such as K+, Na+, Mg2+, Ca2+, Cl−, SO42−, NO3−, glucose) on the determination of analytes were investigated. In addition, substances such as uric acid, urea, ascorbic acid, sulfasalazine, erythromycin and nystatin antibiotics were selected and tested. The response of the electrode was investigated in binary solutions containing RIF and INZ in the presence of possible interfering substances at different concentration ratios. The tolerance limit was defined as the maximum concentration ratio of interfering substance to the analyte (mol mol−1) that caused a ±5% error in the anodic peak current. The results of this investigation are summarized in Table 2, which indicates that the studied substances do not interfere with the determination of RIF and INZ, so the developed method can be used to determine RIF and INZ in blood serum samples and pharmaceutical formulation.
| Interferents | Tolerance limit (mol mol−1) |
|---|---|
| K+, Na+, Ca2+, Mg2+, Cl−, NO3− | 1000 |
| SO42− | 900 |
| Ascorbic acid | 1000 |
| Uric acid | 900 |
| Glucose | 500 |
| Urea | 300 |
| Nystatin | 100 |
| Sulfasalazine | 300 |
| Erythromycin | 200 |
3.7. Analytical application
To verify the validity of the developed method in the analysis of real samples, this method was applied for the simultaneous determination of RIF and INZ in human blood serum and pharmaceutical formulation. by spiking the samples with RIF and INZ in different concentrations. Also, different solutions of the mixture of analytes in tablets were prepared and treated with the method described in section 2.6. The results are presented in Table 3. The recoveries for the simultaneous analysis of these drugs varied in the range of 100.1% to 103.5%, indicating that the DPV method with the fabricated Ni(OH)2/rGO/SPCE electrode has practical potential for the simultaneous determination of RIF and INZ drugs in real samples.| Sample | Analyte | Added (μmol L−1) | Found (μmol L−1) | Recovery (%) | |
|---|---|---|---|---|---|
| Serum | RIF | 0 | 0 | — | |
| 0.03 | 0.0295 ± 0.001 | 98.3 | |||
| 0.15 | 0.015 ± 0.028 | 100.7 | |||
| 0.3 | 0.310 ± 0.004 | 103.3 | |||
| 3.0 | 3.040 ± 0.016 | 101.3 | |||
| INZ | 0 | 0 | — | ||
| 0.09 | 0.090 ± 0.003 | 99.9 | |||
| 0.5 | 0.050 ± 0.019 | 99.6 | |||
| 0.9 | 0.928 ± 0.034 | 103.1 | |||
| 10.0 | 10.210 ± 0.019 | 102.1 | |||
| INZ tablet | INZ | 0 | 0.008 | — | |
| 0.05 | 0.057 ± 0.022 | 97.8 | |||
| 0.90 | 0.898 ± 0.031 | 98.9 | |||
| 10.0 | 10.233 ± 0.070 | 102.2 | |||
| RIF tablet | RIF | 0 | 0.006 | — | |
| 0.15 | 0.162 ± 0.015 | 104.0 | |||
| 0.30 | 0.318 ± 0.029 | 104.0 | |||
| 3.0 | 2.931 ± 0.009 | 97.2 | |||
| RIF/INZ tablet | RIF | 0 | 0.006 | — | |
| 0.15 | 0.160 ± 0.020 | 102.6 | |||
| 0.30 | 0.304 ± 0.025 | 103.4 | |||
| 3.0 | 3.090 ± 0.030 | 102.8 | |||
| 5.0 | 5.53 ± 0.008 | 103.5 | |||
| INZ | 0 | 0.008 | — | ||
| 0.050 | 0.059 ± 0.018 | 101.7 | |||
| 0.90 | 0.931 ± 0.021 | 102.5 | |||
| 10.0 | 10.340 ± 0.050 | 103.3 | |||
| 15.0 | 15.060 ± 0.014 | 100.1 | |||
4. Conclusions
In this work, a simple and fast method for the simultaneous determination of RIF and INZ using a modified SPCE is presented. The reduced graphene oxide (rGO) film on the SPCE surface was prepared using electrochemical reduction of GO by cyclic voltammetry for five cycles. Then, the rGO nanosheets were decorated with nickel hydroxide nanoparticles as a green modifier. The nanoparticles were passivated in 0.1 M NaOH solution by cyclic voltammetry and formed a thin Ni(OH)2 nanofilm. Simultaneous determination of RIF and INZ in aqueous solutions at trace level by DPV was carried out using modified SPCE with high conductivity and a large surface area of Ni(OH)2/rGO hybrid material as an ultrasensitive voltammetric sensor. Compared to the bare SPCE, the oxidation peak potentials were shifted towards negative values and exhibited the catalytic activity of the Ni(OH)2/rGO nanocomposite on the SPCE surface. Under optimal conditions, the oxidation peak current increased linearly with concentrations in the range of 0.015–5 μmol L−1 for RIF and 0.05–10 μmol L−1 for INZ. The low cost but highly sensitive sensor can be used to monitor RIF and INZ in clinical laboratories.Author contributions
E. Sharafi – investigation; formal analysis; validation; and writing-original draft. S. Sadeghi – supervision; funding acquisition; methodology; conceptualization; validation; writing – review and editing; visualization.Ethical statement
All experiments were performed in compliance with the relevant laws and research ethics on human subjects at the University of Birjand. Informed consent was obtained from the human participants of this study.Conflicts of interest
The authors declare no conflict of interest.Acknowledgements
The authors acknowledge the financial support from the Higher Education Research Council of the University of Birjand (Grant number 95-35.25).References
- WHO Guidelines on tuberculosis infection prevention and control: 2019 Update. Geneva: World Health Organization; 2019 (WHO/CDS/ TB/2019.1).
- M. A. O. Mohamed, S. W. Shantier, M. A. Mohamed, E. A. Gadkariem and E. M. O. Ismail, Spectrophotometric method for the simultaneous determination of isoniazid and rifampicin in bulk and tablet forms, Int. J. Pharm. Sci. Rev. Res., 2015, 32, 154–156 CAS
.
- A. B. Bloch, Screening for tuberculosis and tuberculosis infection in high-risk populations: recommendations of the advisory council for the elimination of tuberculosis. Morbidity and Mortality Weekly Report: Recomm. Rep. 1995, 44, 18-34.
- D. Ivnitski, I. Abdel-Hamid, P. Atanasov and E. Wilkins, Biosensors for detection of pathogenic bacteria, Biosens. Bioelectron., 1999, 14, 599–624 CrossRef CAS
.
- I. Chopra, A. J. O’Neill and K. Miller, The role of mutators in the emergence of antibiotic-resistant bacteria, Drug Resistance Updates, 2003, 6, 137–145 CrossRef CAS
.
- I. Sorokulova, E. Olsen and V. Vodyanoy, Bacteriophage biosensors for antibiotic resistant bacteria, Expert Rev. Med. Devices, 2014, 11, 175–186 CrossRef CAS PubMed
.
- M. Maiolini, S. Gause, J. Taylor, T. Steakin, G. Shipp, P. Lamichhane, B. Deshmukh, V. Shinde, A. Bishayee and R. R. Deshmukh, The war against tuberculosis: A review of natural compounds and their derivatives, Molecule, 2020, 25, 1–10 Search PubMed
.
- V. Ramappa and G. P. Aithal, Hepatotoxicity Related to Anti-tuberculosis Drugs: Mechanisms and Management, J. Clin. Exp. Hepatol., 2013, 3, 37–49 CrossRef PubMed
.
- S.-H. Chang, P. Nahid and S. R. Eitzman, Hepatotoxicity in children receiving isoniazid therapy for latent tuberculosis infection, J. Pediatr. Infect. Dis. Soc., 2014, 3, 221–227 CrossRef
.
- S. Stets, T. M. Tavares, P. G. Peralta-Zamora, C. A. Pessoa and N. Nagata, Simultaneous determination of rifampicin and isoniazid in urine and pharmaceutical formulations by multivariate visible spectrophotometry, J. Braz. Chem. Soc., 2013, 24, 1198–1205 CAS
.
- S. Gao, Z. Wang, X. Xie, C. You, Y. Yang, Y. Xi and W. Chen, Rapid and sensitive method for simultaneous determination of first-line anti-tuberculosis drugs in human plasma by HPLC-MS/MS: Application to therapeutic drug monitoring, Tuberculosis, 2018, 109, 28–34 CrossRef CAS
.
- H. Yan, Y. Zhou, Q. Xie, Y. Zhang, P. Zhang, H. Xiao, W. Wang and S. Yaoa, Simultaneous analysis of isoniazid and rifampicin by high-performance liquid chromatography with gradient elution and wall-jet/thin-layer electrochemical detection, Anal. Methods, 2014, 6, 1530–1537 RSC
.
- P. R. Chellini, T. O. Mendes, P. H. C. Franco, B. L. S. Porto, V. K. Tippavajhala, I. C. César, M. A. L. Oliveira and G. A. Pianetti, Simultaneous determination of rifampicin, isoniazid, pyrazinamide and ethambutol in 4-FDC tablet by Raman spectroscopy associated to chemometric approach, Vib. Spectrosc., 2017, 90, 14–20 CrossRef CAS
.
- R. F. Ngece, Nanoparticulate of silver-modified poly (8-anilino-1-naphthalene sulphonic acid) nanobiosensor systems for the determination of Tuberculosis treatment drugs, Int. J. Electrochem. Sci., 2011, 6, 1820–1838 CAS
.
- D. H. Shewiyo, E. Kaale, P. G. Risha, B. Dejaegher, J. Smeyers-Verbeke and Y. Vander Heyden, Optimization of a reversed-phase-high-performance thin-layer chromatography method for the separation of isoniazid, ethambutol, rifampicin and pyrazinamide in fixed-dose combination antituberculosis tablets, J. Chromatogr. A, 2012, 1260, 232–238 CrossRef CAS PubMed
.
- P. R. Chellini, E. B. Lages, P. H. C. Franco, F. H. A. Nogueira, I. C. César and G. A. Pianetti, Development and validation of an HPLC method for simultaneous determination of rifampicin, isoniazid, pyrazinamide, and ethambutol hydrochloride in pharmaceutical formulations, J. AOAC Int., 2015, 98, 1234–1239 CrossRef CAS
.
- Y. Shah, S. Khanna, K. C. Jindal and V. S. Dighe, Determination of rifampicin and isoniazid in pharmaceutical formulations by HPLC, Drug Dev. Ind. Pharm., 1992, 18, 1589–1596 CrossRef CAS
.
- P.-F. Fang, H.-L. Cai, R.-H. Zhu, Q.-Y. Tan, W. Gao, P. Xu, Y.-P. Liu, W.-Y. Zhang, Y.-C. Chen and F. Zhang, Simultaneous determination of isoniazid, rifampicin, levofloxacin in mouse tissues and plasma by high performance liquid chromatography-tandem mass spectrometry, J. Chromatogr. B: Anal. Technol. Biomed. Life Sci., 2010, 878, 2286–2291 CrossRef CAS
.
- B. Li, Y. He, J. Lv and Z. Zhang, Simultaneous determination of rifampicin and isoniazid by continuous-flow chemiluminescence with artificial neural network calibration, Anal. Bioanal. Chem., 2005, 383, 817–824 CrossRef CAS PubMed
.
- M. Tilinca, G. Hancu, E. Mircia, D. Iriminescu, A. Rusu, R. A. Vlad and E. Barabas, Simultaneous determination of isoniazid and rifampicin by UV spectrophotometry, Farmacia, 2017, 65, 219–224 CAS
.
- A. F. FariaM, V. De Souza, R. E. Bruns and M. A. De Oliveira, Simultaneous determination of first-line anti-tuberculosis drugs by capillary zone electrophoresis using direct UV detection, Talanta, 2010, 82, 333–339 CrossRef
.
- J. S. Aguirre-Araque, J. M. Gonçalves, M. Nakamura, P. O. Rossini, L. Angnes, K. Araki and H. E. Toma, GO composite encompassing a tetraruthenated cobalt porphyrin-Ni coordination polymer and its behavior as isoniazid BIA sensor, Electrochim. Acta, 2019, 300, 113–122 CrossRef CAS
.
- K. Asadpour-Zeynali and F. Mollarasouli, Novel electrochemical biosensor based on PVP capped CoFe2O4@CdSe core-shell nanoparticles modified electrode for ultra-trace level determination of rifampicin by square wave adsorptive stripping voltammetry, Biosens. Bioelectron., 2017, 92, 509–516 CrossRef CAS PubMed
.
- Z. Sepehri, H. Bagheri, E. Ranjbari, M. Amiri-Aref, S. Amidi, M. R. Rouini and Y. H. Ardakani, Simultaneous electrochemical determination of isoniazid and ethambutol using poly-melamine/electrodeposited gold nanoparticles modified pre-anodized glassy carbon electrode, Ionics, 2018, 24, 1253–1263 CrossRef CAS
.
- K. V. Ozdokur, Voltammetric determination of isoniazid drug in various matrix by using CuOx decorated MW-CNT modified glassy carbon electrode, Electroanalysis, 2020, 32, 489–495 CrossRef
.
- H. Yan, H. Xiao, Q. Xie, J. Liu, L. Sun, Y. Zhou, Y. Zhang, L. Chao, C. Chen and S. Yao, Simultaneous electroanalysis of isoniazid and uric acid at poly (sulfosalicylic acid)/electroreduced carboxylated graphene modified glassy carbon electrode, Sens. Actuators, B, 2015, 207, 167–176 CrossRef CAS
.
- J. Wang, J. Zhao, J. Yang, J. Cheng, Y. Tan, H. Feng and Y. Li, An electrochemical sensor based on MOF-derived NiO@ZnO hollow microspheres for isoniazid determination, Microchim. Acta, 2020, 187, 380 CrossRef CAS PubMed
.
- B. G. Santos, J. M. Gonçalves, D. P. Rocha, G. S. Higino, T. P. Yadav, J. J. Pedrotti, P. M. Ajayan and L. Angnes, Electrochemical sensor for isoniazid detection by using a WS2/CNTs nanocomposite, Sens. Actuators Reports, 2022, 4, 100073 CrossRef
.
- S. Amidi, Y. Hosseinzadeh Ardakani, M. Amiri-Aref, E. Ranjbari, Z. Sepehri and H. Bagheri, Sensitive electrochemical determination of rifampicin using gold nanoparticles/poly-melamine nanocomposite, RSC Adv., 2017, 7, 40111–40118 RSC
.
- T. Kokulnathan, V. Suvina, T.-J. Wang and G. R. Balakrishna, Synergistic design of a tin phosphate entrapped graphene flakes nanocomposite as an efficient catalyst for electrochemical determination of antituberculosis drug isoniazid in biological samples, Inorg. Chem. Front., 2019, 6, 1831–1841 RSC
.
- V. Vinothkumar, A. Sangili, S.-M. Chen and M. Abinaya, Additive-free synthesis of BiVO4 microspheres as an electrochemical sensor for determination of antituberculosis drug rifampicin, Colloids Surf., A, 2021, 624, 126849 CrossRef CAS
.
- H. M. Mohamed, Screen-printed
disposable electrodes: Pharmaceutical applications and recent developments, TrAC, Trends Anal. Chem., 2016, 82, 1–11 CrossRef CAS
.
- A. Morrin, A. J. Killard and M. R. Smyth, Electrochemical characterization of commercial and home-made screen-printed carbon electrodes, Anal. Lett., 2003, 36, 2021–2039 CrossRef CAS
.
- O. D. Renedo, M. Alonso-Lomillo and M. A. Martínez, Recent developments in the field of screen-printed electrodes and their related applications, Talanta, 2007, 73, 202–219 CrossRef CAS
.
- X. Zhu, J. Xu, X. Duan, L. Lu, K. Zhang, Y. Yu, H. Xing, Y. Gao, L. Dong and H. Sun, Controlled synthesis of partially reduced graphene oxide: Enhance electrochemical determination of isoniazid with high sensitivity and stability, J. Electroanal. Chem., 2015, 757, 183–191 CrossRef CAS
.
- B. G. Mahmoud, M. Khairy, F. A. Rashwan and C. E. Banks, Simultaneous voltammetric determination of acetaminophen and isoniazid (Hepatotoxicity- Related drugs) utilizing bismuth oxide nanorod modified screen-printed electrochemical sensing platforms, Anal. Chem., 2017, 89, 2170–2178 CrossRef CAS PubMed
.
- R. Chokkareddy and G. G. Redhi, Recent sensing technologies for first line antituberculosis drugs in pharmaceutical dosages and biological fluids: A review, Sens. Lett., 2019, 17, 833–858 CrossRef
.
- P. R. Oliveira, M. M. Oliveira, A. J. G. Zarbin, L. H. Marcolino-Junior and M. F. Bergamini, Flow injection amperometric determination of isoniazid using a screen-printed carbon electrode modified with silver hexacyanoferrates nanoparticles, Sens. Actuators, B, 2012, 171, 795–802 CrossRef
.
- J. Ping, Y. Wang, Y. Ying and J. Wu, Application of electrochemically reduced graphene oxide on screen-printed ion-selective electrode, Anal. Chem., 2012, 84, 3473–3479 CrossRef CAS PubMed
.
- Z. Guo, Z.-Y. Wang, H.-H. Wang, G.-Q. Huang and M.-M. Li, Electrochemical sensor for Isoniazid based on the glassy carbon electrode modified with reduced graphene oxide–Au nanomaterials, Mater. Sci. Eng., C, 2015, 57, 197–204 CrossRef CAS PubMed
.
- A. Farokhi-Fard, B. Golichenari, M. Mohammadi Ghanbarlou, S. Zanganeh and F. Vaziri, Electroanalysis of isoniazid and rifampicin: Role of nanomaterial electrode modifiers, Biosens. Bioelectron., 2019, 146, 111731 CrossRef CAS
.
- S. Shiri, N. Pajouheshpoor, H. Khoshsafar, S. Amidi and H. Bagheri, An electrochemical sensor for the simultaneous determination of rifampicin and isoniazid using a C-dots@CuFe2O4 nanocomposite modified carbon paste electrode, New J. Chem., 2017, 41, 15564–15573 RSC
.
- C. R. Rawool and A. K. Srivastava, A dual template imprinted polymer modified electrochemical sensor based on Cu metal organic framework/mesoporous carbon for highly sensitive and selective recognition of rifampicin and isoniazid, Sens. Actuators, B, 2019, 288, 493–506 CrossRef CAS
.
- D. C. Marcano, D. V. Kosynkin, J. M. Berlin, A. Sinitskii, Z. Sun, A. Slesarev, L. B. Alemany, W. Lu and J. M. Tour, Improved synthesis of graphene oxide, ACS Nano, 2010, 4, 4806–4814 CrossRef CAS PubMed
.
- S. Sadeghi and A. Garmroodi, A highly sensitive and selective electrochemical sensor for determination of Cr(VI) in the presence of Cr(III) using modified multi-walled carbon nanotubes/quercetin screen-printed electrode, Mater. Sci. Eng., C, 2013, 33, 4972–4977 CrossRef CAS PubMed
.
- S. Sadeghi and A. Garmroodi, A., Design and construction of a new modified screen-printed sensor for voltammetric determination of molybdenum(VI) ions, Electroanalysis, 2013, 25, 323–330 CrossRef CAS
.
- D. S. Hall, D. J. Lockwood, C. Bock and B. R. MacDougall, In Nickel hydroxides and related materials: a review of their structures, synthesis and properties, Proc. R. Soc. A., 2015, 471, 20140792 CrossRef
.
- S. Rastgar and S. Shahrokhian, Nickel hydroxide nanoparticles-reduced graphene oxide nanosheets film: Layer-by-layer electrochemical preparation, characterization and rifampicin sensory application, Talanta, 2014, 119, 156–163 CrossRef CAS
.
- A. García-Miranda Ferrari, C. W. Foster, P. J. Kelly, D. A. C. Brownson and C. E. Banks, Determination of the Electrochemical Area of Screen-Printed Electrochemical Sensing Platforms, Biosensors, 2018, 8, 1–10 CrossRef
.
- F. Li, J. Song, D. Gao, Q. Zhang, D. Han and L. Niu, Adsorptive stripping voltammetric determination of erythromycin at a pretreated glassy carbon electrode, Talanta, 2009, 79, 845–850 CrossRef CAS
.
- N. Hui, R.-F. Gao, X.-Q. Li, W. Sun and K. Jiao, Direct electrochemistry of hemoglobin immobilized in polyvinyl alcohol and clay composite film modified carbon ionic liquid electrode, J. Braz. Chem. Soc., 2009, 20, 252–258 CrossRef CAS
.
- A. E. Hammam, A. M. Beltagi and M. M. Ghoneim, Voltammetric assay of rifampicin and isoniazid drugs, separately and combined in bulk, pharmaceutical formulations and human serum at a carbon paste electrode, Microchem. J., 2004, 77, 53–62 CrossRef
.
- T. Wahdan, Voltammetric Method for the Simultaneous Determination of Rifampicin and Isoniazid in Pharmaceutical Formulations, Chem. Anal., 2005, 50, 457–464 CAS
.
- A. K. C. Leandro, J. M. de Carvalho, L. F. Giovanelli and J. C. Moreira, Development and validation of an electroanalytical methodology for determination of isoniazid and rifampicin content in pharmaceutical formulations, Braz. J. Pharma. Sci., 2009, 45, 331–337 CrossRef
.
Footnote |
| † Electronic supplementary information (ESI) available. See DOI: https://doi.org/10.1039/d2nj04263k |
| This journal is © The Royal Society of Chemistry and the Centre National de la Recherche Scientifique 2023 |

