Selective recognition of aluminum ions using an esculetin@Q[8] host–guest supramolecular fluorescent probe†
Guangyan
Luo
,
Ye
Meng
 ,
Lin
Zhang
,
Xiaoyue
Li
,
Zhu
Tao
,
Lin
Zhang
,
Xiaoyue
Li
,
Zhu
Tao
 and
Qianjun
Zhang
 *
*
Key Laboratory of Macrocyclic and Supramolecular Chemistry of Guizhou Province, Guizhou University, Guiyang 550025, China. E-mail: qjzhang@gzu.edu.cn
First published on 18th November 2021
Abstract
In this paper, we prepared a new probe, a supramolecular compound composed of esculetin (ESC) and a cucurbit[8]uril (Q[8]). Ultraviolet, fluorescence and other methods have shown that ESC and Q[8] formed a 2![[thin space (1/6-em)]](https://www.rsc.org/images/entities/char_2009.gif) :
:![[thin space (1/6-em)]](https://www.rsc.org/images/entities/char_2009.gif) 1 (ESC2@Q[8]) inclusion compound with weak fluorescence, which could efficiently identify metal aluminum ions in a pH = 5.0 water system, and emit strong indigo blue fluorescence to achieve naked eye recognition. In the competition experiment, this probe exhibited the specific recognition of aluminum ions. Furthermore, its recognition mechanism was explored through crystal diffraction and it was found that the carbonyl oxygens on the port of Q[8] and the hydroxyl oxygen atoms of ESC together formed a ternary complex with Al3+ ((ESC2@Q[8])@Al3+), which made the host–guest fluorescent probe form a hyper-conjugated system to achieve the effect of fluorescence enhancement. The fluorescence intensity had a good linear correlation with Al3+ concentration (R2 = 0.9838) in the range of 0.3–2.4 × 10⁻⁵ mol L−1. The detection limit was 9.39 × 10⁻⁹ mol L−1, which may have potential and application prospects for detecting metal ions in water systems.
1 (ESC2@Q[8]) inclusion compound with weak fluorescence, which could efficiently identify metal aluminum ions in a pH = 5.0 water system, and emit strong indigo blue fluorescence to achieve naked eye recognition. In the competition experiment, this probe exhibited the specific recognition of aluminum ions. Furthermore, its recognition mechanism was explored through crystal diffraction and it was found that the carbonyl oxygens on the port of Q[8] and the hydroxyl oxygen atoms of ESC together formed a ternary complex with Al3+ ((ESC2@Q[8])@Al3+), which made the host–guest fluorescent probe form a hyper-conjugated system to achieve the effect of fluorescence enhancement. The fluorescence intensity had a good linear correlation with Al3+ concentration (R2 = 0.9838) in the range of 0.3–2.4 × 10⁻⁵ mol L−1. The detection limit was 9.39 × 10⁻⁹ mol L−1, which may have potential and application prospects for detecting metal ions in water systems.
Introduction
Aluminum is the most abundant metallic element in the Earth's crust and plays an important role in food production, medicine and the aerospace industry.1 Al3+ can combine with proteins and directly damage the central nervous system, which results in memory loss and intellectual disability.2 Excessive intake of Al3+ ions can cause a variety of diseases, such as Parkinson's disease, Alzheimer's disease and amyotrophic lateral sclerosis.3–7 The World Health Organization (WHO) has identified aluminum as a food pollution source and has imposed controls on it.8 Thus, the detection of Al3+ is of great significance. At present, the detection methods of Al3+ mainly include atomic absorption spectrometry,9 atomic luminescence spectrometry,10 electrochemical methods11 and chromatography.12 These methods usually have good sensitivity and repeatability, but they also have disadvantages such as the requirement for expensive instruments, time-consuming detection, and complicated operation. Due to their advantages of high selectivity, high sensitivity, simple instrumentation, convenient analysis processes, fast operation, real-time monitoring and so on, fluorescent probes have attracted the wide attention of researchers at home and abroad.13–17Following research into the combination and identification of their characteristics, the cucurbit[n]urils (Q[n]s, n = 5–8, 10, 14) have become more and more important in the past ten years.18–20 Macrocyclic host molecules such as macrocyclodextrin and calixarene have difficulty forming non-covalently linked host–guest complexes due to limitations such as the solubility and stability of the complexes.21 Therefore, cucurbit[n]urils with good complexing properties for cationic guest molecules were chosen for further studies.22,23 They are macrocyclic container molecules composed of multiple glycoluril monomers, which are connected by a pair of methylene bridges.22,23 The hydrophobic cavity of the cucurbit[n]uril has a carbonyl edge entrance, making it an excellent binding agent for metal ions and cationic organic compounds.24 In recent years, a large number of literature reports on the detection of metal ions based on Q[n]s fluorescent probe systems have been published. For instance, the previous research of our research group found that chromone could form a 1![[thin space (1/6-em)]](https://www.rsc.org/images/entities/char_2009.gif) :
:![[thin space (1/6-em)]](https://www.rsc.org/images/entities/char_2009.gif) 1 host–guest inclusion compound with Q[7] under neutral conditions, and could effectively identify Zn2+ and Cd2+ in water to enhance fluorescence.25 It can also identify and complex with four lanthanide ions Eu3+, Tb3+, Dy3+, and Sm3+ to induce fluorescence emission.26 Zhang Wei et al. formed a 1
1 host–guest inclusion compound with Q[7] under neutral conditions, and could effectively identify Zn2+ and Cd2+ in water to enhance fluorescence.25 It can also identify and complex with four lanthanide ions Eu3+, Tb3+, Dy3+, and Sm3+ to induce fluorescence emission.26 Zhang Wei et al. formed a 1![[thin space (1/6-em)]](https://www.rsc.org/images/entities/char_2009.gif) :
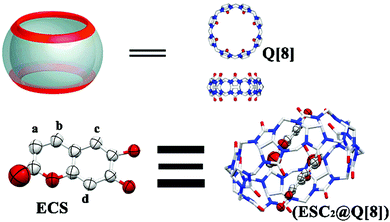
:![[thin space (1/6-em)]](https://www.rsc.org/images/entities/char_2009.gif) 1 host–guest inclusion complex with Q[10] and aminopropyl-1-pyrene butylamide (PBA), a water-soluble derivative of pyrene, which could selectively recognize Ag+ and Fe3+ ions in aqueous solution.27 However, there are few studies on the construction of fluorescent probe systems based on Q[8] (Scheme 1). Esculetin (6,7-dihydroxycoumarin, ESC, Scheme 1) is a natural coumarin compound, which exists in many plants, such as Melilotus and Rutaceae lemon leaves.28,29 It has antioxidant, antibacterial, anti-inflammatory and sedative activities.30,31 Coumarins have good fluorescence properties, such as a high fluorescence quantum yield, a large Stokes shift and good water solubility. They are often used as fluorescent groups in fluorescent chemical sensors. In this paper, the probe system encapsulates ESC with strong fluorescence in the hydrophobic cavity of Q[8] to form a 2
1 host–guest inclusion complex with Q[10] and aminopropyl-1-pyrene butylamide (PBA), a water-soluble derivative of pyrene, which could selectively recognize Ag+ and Fe3+ ions in aqueous solution.27 However, there are few studies on the construction of fluorescent probe systems based on Q[8] (Scheme 1). Esculetin (6,7-dihydroxycoumarin, ESC, Scheme 1) is a natural coumarin compound, which exists in many plants, such as Melilotus and Rutaceae lemon leaves.28,29 It has antioxidant, antibacterial, anti-inflammatory and sedative activities.30,31 Coumarins have good fluorescence properties, such as a high fluorescence quantum yield, a large Stokes shift and good water solubility. They are often used as fluorescent groups in fluorescent chemical sensors. In this paper, the probe system encapsulates ESC with strong fluorescence in the hydrophobic cavity of Q[8] to form a 2![[thin space (1/6-em)]](https://www.rsc.org/images/entities/char_2009.gif) :
:![[thin space (1/6-em)]](https://www.rsc.org/images/entities/char_2009.gif) 1 ESC2@Q[8] complex, which weakened the fluorescence. The complex can efficiently identify metal aluminum ions in a pH = 5.0 water system, emit strong indigo blue fluorescence, and realize naked eye identification. According to the linear relationship between the fluorescence intensity and Al3+ concentration a simple fluorescent probe was developed for the quantitative detection of aluminum ions in aqueous solution.
1 ESC2@Q[8] complex, which weakened the fluorescence. The complex can efficiently identify metal aluminum ions in a pH = 5.0 water system, emit strong indigo blue fluorescence, and realize naked eye identification. According to the linear relationship between the fluorescence intensity and Al3+ concentration a simple fluorescent probe was developed for the quantitative detection of aluminum ions in aqueous solution.
Results and discussion
Interaction between Q[8] and ESC
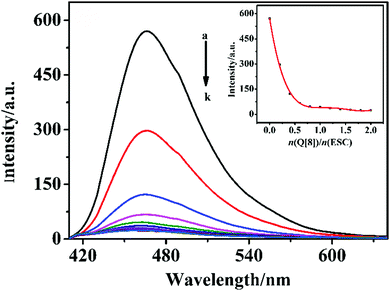
The interaction between ESC and Q[8] in an aqueous solution was investigated using fluorescence spectroscopy. Fig. 1(A) shows that the fluorescence intensity of ESC at the emission wavelength of 465.9 nm decreases with the continuous increase of Q[8], its value is opposite to the concentration of Q[8]. When the molar ratio of ESC and Q[8] is 2![[thin space (1/6-em)]](https://www.rsc.org/images/entities/char_2009.gif) :
:![[thin space (1/6-em)]](https://www.rsc.org/images/entities/char_2009.gif) 1, the fluorescence intensity of the system reaches saturation and does not change. It can be seen from the inset diagram in the illustration that when n(Q[8])/n(ESC) = 0.5, the fluorescence intensity tends to flatten. Meanwhile, the inclusion constant Ka is 1.7332 × 10⁶ L mol−1.32 In Job's method, the molar ratio of ESC to Q[8] is n(Q[8])/[n(Q[8]) +n(ESC)] = 0.33 (see the ESI†, Fig. S1), which further confirmed that ESC and Q[8] formed a 2
1, the fluorescence intensity of the system reaches saturation and does not change. It can be seen from the inset diagram in the illustration that when n(Q[8])/n(ESC) = 0.5, the fluorescence intensity tends to flatten. Meanwhile, the inclusion constant Ka is 1.7332 × 10⁶ L mol−1.32 In Job's method, the molar ratio of ESC to Q[8] is n(Q[8])/[n(Q[8]) +n(ESC)] = 0.33 (see the ESI†, Fig. S1), which further confirmed that ESC and Q[8] formed a 2![[thin space (1/6-em)]](https://www.rsc.org/images/entities/char_2009.gif) :
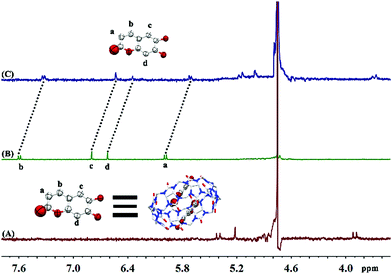
:![[thin space (1/6-em)]](https://www.rsc.org/images/entities/char_2009.gif) 1 complex. 1H NMR was used to further explore the interaction between ESC and Q[8] (as shown in Fig. 2). Using D2O (pH = 5.0) as the solvent, after Q[8] was added to the guest ESC, the proton peaks Ha, Hb, Hc and Hd of ESC all move to a high field, and are shifted by 0.27 ppm, 0.27 ppm, 0.26 ppm and 0.27 ppm, respectively. The peaks of Q[8] also shifted by 0.24 ppm, 0.22 ppm and 0.21 ppm, respectively. It shows that ESC has completely entered the cavity of Q[8].
1 complex. 1H NMR was used to further explore the interaction between ESC and Q[8] (as shown in Fig. 2). Using D2O (pH = 5.0) as the solvent, after Q[8] was added to the guest ESC, the proton peaks Ha, Hb, Hc and Hd of ESC all move to a high field, and are shifted by 0.27 ppm, 0.27 ppm, 0.26 ppm and 0.27 ppm, respectively. The peaks of Q[8] also shifted by 0.24 ppm, 0.22 ppm and 0.21 ppm, respectively. It shows that ESC has completely entered the cavity of Q[8].
The selectivity of the ESC2@Q[8] supramolecular fluorescent probes towards metal ions
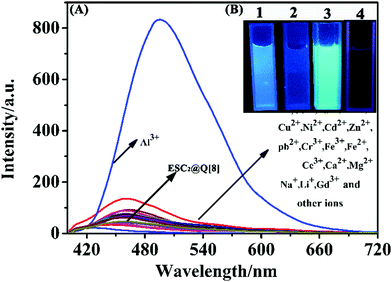
On exploring the selectivity of the probe towards metal ions, we found that ESC has a certain fluorescence intensity and a certain fluorescence response to most metal ions (as shown in Fig. S2 of the ESI†). For example, Hg2+, Ca2+, Na+, Mg2+, Al3+, Cd2+, Cu2+, Pb2+, Ni2+, Co2+, Fe3+, Ag+, Cr3+ and other metal ions. However, when the ESC2@Q[8] supramolecular probe was formed, the fluorescence intensity became weaker, and the specific recognition effect was superior, the red shift was about 30 nm (as shown in Fig. 3(A)), and this may be caused by the interaction of aluminum ions with ESC, which causes changes in its electron transfer. In addition, under ultraviolet light, and only after adding Al3+ ions, the color of the solution changed from light blue to strong indigo luminescence (Fig. 3(B)). Such obvious color and fluorescence intensity changes once again proved that ESC2@Q[8] has a good recognition effect towards Al3+ ions, and can realize the naked eye recognition of Al3+ ions under ultraviolet light. The anti-interference ability of the probe during the determination of Al3+ was investigated using a competition experiment33 (Fig. S3, ESI†). The fluorescence signals were measured by adding various metal ions into the ESC2@Q[8]–Al3+ probe system. The results show that the fluorescence intensity of the system is almost unaffected by other ions except for Fe3+. This is because in trivalent metal ions such as Cr3+ and Fe3+, etc. the ionic radii of Cr3+ and Fe3+ are 0.0615 nm and 0.0645 nm respectively, which are larger than that of Al3+ ions (0.0535 nm), so complex formation at the port of ESC2@Q[8] is difficult. Fe3+ is paramagnetic and can oxidize ESC to produce a color change, which causes a fluorescence quenching effect on the system. Therefore, the presence of metal ions other than Fe3+ will not interfere with the detection of Al3+ by the probe. As the log![[thin space (1/6-em)]](https://www.rsc.org/images/entities/char_2009.gif) K (stability constants) of Al3+ and Fe3+ are 16.1 and 25.1, respectively, the interference of Fe3+ can be removed by adding an appropriate amount of EDTA.34
K (stability constants) of Al3+ and Fe3+ are 16.1 and 25.1, respectively, the interference of Fe3+ can be removed by adding an appropriate amount of EDTA.34
We investigated the influence of experimental conditions such as pH and solvent on the measurement results of the probe for Al3+ ion detection at different pH values and solvent, which are shown in Fig. S4 and S5 of the ESI.† The fluorescence intensity of the ESC2@Q[8] probe is weak in the range of pH = 1–4 and 11–12, and the addition of Al3+ ions does not change the fluorescence signal, which indicates that it is not feasible for the probe to detect ions under strongly acidic and alkaline conditions. This may be because too much acidity in the system leads to protonation of the hydroxyl group in ESC. While too much alkalinity causes the Al3+ in the system to form Al(OH)3, both of which have a great influence on the combination of the probe and Al3+.35 The ESC2@Q[8]–Al3+ system had the strongest fluorescence intensity when the pH = 5.0, so a pH = 5.0 was selected for the solvent system for the detection. In different solvents, although the fluorescence of the solution is enhanced, it does not change much. Therefore, the ethanol solution that demonstrated better detection was selected. Considering that metal ions are often detected in water, the detection conditions were pH = 5.0, νH2O![[thin space (1/6-em)]](https://www.rsc.org/images/entities/char_2009.gif) :
:![[thin space (1/6-em)]](https://www.rsc.org/images/entities/char_2009.gif) νC2H5OH = 97
νC2H5OH = 97![[thin space (1/6-em)]](https://www.rsc.org/images/entities/char_2009.gif) :
:![[thin space (1/6-em)]](https://www.rsc.org/images/entities/char_2009.gif) 3.
3.
Linear equation and detection limit
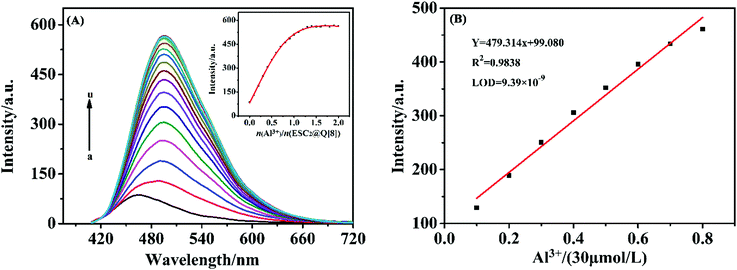
At the wavelength of 496.96 nm, when n(Al3+)/n(ESC2@Q[8]) = 1.0, the fluorescence intensity gradually fades to saturation (Fig. 4(A)). So there was a good linear relationship between the Al3+ ion concentration and the fluorescence intensity (0.3–2.4 × 10⁻⁵ mol L−1). The linear regression equation was Y = 479.314x + 99.080, R2 = 0.9838. According to the formula (3σ/K) (n = 8)36,37 the calculated limit of detection (LOD) of the probe for Al3+ was 9.39 × 10⁻⁹ mol L−1 (Fig. 4(B)), which is much lower than the limit required by the WHO for Al3+ in drinking water (7.41 × 10⁻⁶ mol L−1). Using quinine sulfate with a fluorescence quantum yield of 0.55 as the standard reference, under the conditions of an excitation wavelength of 340 nm, the fluorescence quantum yield was measured to be 0.1838,39 (see the ESI†, Fig. S6). The probe can be used in fluorescence analysis and has good potential application value.Study of the mechanism of ESC2@Q[8] as a fluorescent probe for Al3+
The interaction between ESC2@Q[8] and Al3+ was investigated using UV absorption spectroscopy. Fig. 5(A and B) show the interaction between ESC2@Q[8] and Al3+ ions in an aqueous solution using the molar ratio method and Job's method for the UV absorption spectrum. It can be seen from Fig. 5(A) that the decrease in the absorbance of the probe ESC2@Q[8] is due to the addition of Al3+ ions. When the molar ratio of the probe and Al3+ is 1![[thin space (1/6-em)]](https://www.rsc.org/images/entities/char_2009.gif) :
:![[thin space (1/6-em)]](https://www.rsc.org/images/entities/char_2009.gif) 1, the absorbance reaches saturation, which shows that ESC2@Q[8] and Al3+ may form a complex with the molar ratio of 1
1, the absorbance reaches saturation, which shows that ESC2@Q[8] and Al3+ may form a complex with the molar ratio of 1![[thin space (1/6-em)]](https://www.rsc.org/images/entities/char_2009.gif) :
:![[thin space (1/6-em)]](https://www.rsc.org/images/entities/char_2009.gif) 1. The Job's plot was used to determine the combined stoichiometry of the supramolecular system. As can be seen from Fig. 5(B), the maximum UV absorption intensity can be observed when the mole fraction of n(Al3+)/(n(ESC2@Q[8]) + n(Al3+)) reaches 0.5, which indicates that the binding ratio between the probe and Al3+ is 1
1. The Job's plot was used to determine the combined stoichiometry of the supramolecular system. As can be seen from Fig. 5(B), the maximum UV absorption intensity can be observed when the mole fraction of n(Al3+)/(n(ESC2@Q[8]) + n(Al3+)) reaches 0.5, which indicates that the binding ratio between the probe and Al3+ is 1![[thin space (1/6-em)]](https://www.rsc.org/images/entities/char_2009.gif) :
:![[thin space (1/6-em)]](https://www.rsc.org/images/entities/char_2009.gif) 1.
1.
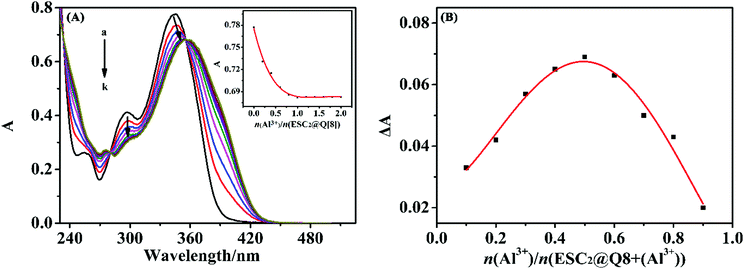 | ||
| Fig. 5 (A) The UV-vis absorption spectra recorded for ESC2@Q[8] in the presence of a different molar ratios of Al3+ molar ratio; (B) Job's plot obtained for ESC2@Q[8] in the presence of Al3+. | ||
1H NMR and crystal structure analysis
Using 1H NMR and the X-ray crystal structure to further explore the mechanism of interaction between ESC2@Q[8] and Al3+, Fig. 6 shows the 1H NMR changes of ESC2@Q[8] after adding Al3+ to D2O. Q[8] is added into the ESC solution, and ESC enters the cavity of Q[8] to form an ESC2@Q[8] inclusion compound with a molar ratio of 2![[thin space (1/6-em)]](https://www.rsc.org/images/entities/char_2009.gif) :
:![[thin space (1/6-em)]](https://www.rsc.org/images/entities/char_2009.gif) 1. Then, a chemical shift of the proton resonant peak of both ESC and Q[8] in the inclusion compound to a low field occurred when Al3+ was added to ESC2@Q[8], and ESC and Q[8] both moved to almost 0.03 ppm in the low field. This indicates that Al3+ complexed with Q[8] and ESC simultaneously, and that the ESC in the Q[8] cavity is pulled to the portal by Al3+. The recognition mechanism of ESC2@Q[8] towards Al3+ can be further explained by the crystal structure.
1. Then, a chemical shift of the proton resonant peak of both ESC and Q[8] in the inclusion compound to a low field occurred when Al3+ was added to ESC2@Q[8], and ESC and Q[8] both moved to almost 0.03 ppm in the low field. This indicates that Al3+ complexed with Q[8] and ESC simultaneously, and that the ESC in the Q[8] cavity is pulled to the portal by Al3+. The recognition mechanism of ESC2@Q[8] towards Al3+ can be further explained by the crystal structure.
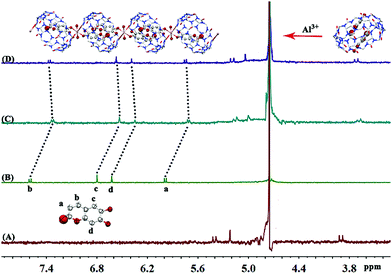 | ||
| Fig. 6 The 1H NMR spectra after Al3+ is added to ESC2Q[8] (400 MHz, D2O (pH = 5.0)), (A): Q[8], (B): ESC, (C): ECS2@Q[8], and (D): ESC2@Q[8]@Al3+. | ||
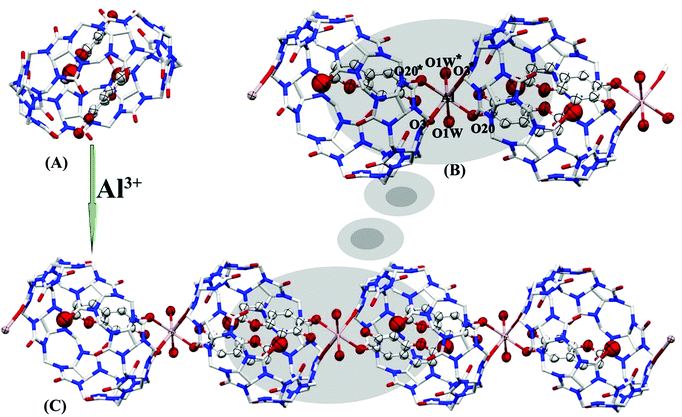
The HCl aqueous solution containing Q[8], ESC and Al(ClO4)3 was placed in the air, and the complex ESC2@Q[8]@Al3+ was obtained by natural evaporation (CCDC:†2097128). The test conditions and refinement parameters for this compound are listed in Table S1 (see the ESI†). The crystal structure analysis showed that the complex belongs to the monoclinic crystal system I12/C1 space group. As shown in Fig. 7A, the guest molecule (ESC) enters the cavity of Q[8] to form a 2![[thin space (1/6-em)]](https://www.rsc.org/images/entities/char_2009.gif) :
:![[thin space (1/6-em)]](https://www.rsc.org/images/entities/char_2009.gif) 1 inclusion complex (ESC2@Q[8]). Al3+ is a hard acid, which tends to form stable complexes with N and O ligands containing lone pair electrons.40 Therefore, the adjacent ESC2@Q[8] complexes are bridged by Al3+via coordination bonds to form one-dimensional supramolecular chains (Fig. 7B). These coordination bonds (distances of 2.383–2.478 Å) are formed by the central Al3+ atom and the carbonyl oxygen atoms (O3 and O3*) of Q[8], the hydroxyl oxygen atoms (O20 and O20*) of ESC, and water molecules (O1W and O1W*) (Fig. 7C). The results showed that the ternary system ESC2@Q[8]@Al3+ complex constructed via coordination bonds between the probe (ESC2@Q[8]) and Al3+ promoted electron delocalization, thus forming a hyperconjugation system and enhancing the fluorescence.41
1 inclusion complex (ESC2@Q[8]). Al3+ is a hard acid, which tends to form stable complexes with N and O ligands containing lone pair electrons.40 Therefore, the adjacent ESC2@Q[8] complexes are bridged by Al3+via coordination bonds to form one-dimensional supramolecular chains (Fig. 7B). These coordination bonds (distances of 2.383–2.478 Å) are formed by the central Al3+ atom and the carbonyl oxygen atoms (O3 and O3*) of Q[8], the hydroxyl oxygen atoms (O20 and O20*) of ESC, and water molecules (O1W and O1W*) (Fig. 7C). The results showed that the ternary system ESC2@Q[8]@Al3+ complex constructed via coordination bonds between the probe (ESC2@Q[8]) and Al3+ promoted electron delocalization, thus forming a hyperconjugation system and enhancing the fluorescence.41
Determination of Al3+ in a water sample
Al3+ in tap water samples was determined using the standard addition method, and the recovery rate was calculated. The results are listed in Table 1. The recovery rate of Al3+ in the water samples detected using the ESC2@Q[8] probe is 97–99%, which indicates high accuracy and precision.| Sample | Concentration of added ions (μM) | Detected (mean ± SD, μM) | Recovery rate (%) | R.S.D. (%n = 3) |
|---|---|---|---|---|
| Tap water sample | 0 | — | — | — |
| 12 | 11.72 | 97.67 | 0.58 | |
| 18 | 17.67 | 98.17 | 2.24 | |
| 20 | 19.86 | 99.30 | 0.47 |
Conclusions
ESC and Q[8] formed a 2![[thin space (1/6-em)]](https://www.rsc.org/images/entities/char_2009.gif) :
:![[thin space (1/6-em)]](https://www.rsc.org/images/entities/char_2009.gif) 1 inclusion complex, which can be used as a supramolecular fluorescent probe selectively to recognize Al3+ ions in an aqueous solution and can also realize the qualitative recognition of Al3+via the visual color change of the solution. The fluorescence intensity of the system showed a good linear relationship with the concentration of Al3+, and the detection limit is 9.39 × 10⁻⁹ mol L−1. The crystal structure of ESC2@Q[8]@Al3+ indicates that the recognition mechanism involves hydroxyl oxygen atoms on ESC and carbonyl oxygen atoms at the Q[8] portal simultaneously reacting with Al3+ to form complexes with a 2
1 inclusion complex, which can be used as a supramolecular fluorescent probe selectively to recognize Al3+ ions in an aqueous solution and can also realize the qualitative recognition of Al3+via the visual color change of the solution. The fluorescence intensity of the system showed a good linear relationship with the concentration of Al3+, and the detection limit is 9.39 × 10⁻⁹ mol L−1. The crystal structure of ESC2@Q[8]@Al3+ indicates that the recognition mechanism involves hydroxyl oxygen atoms on ESC and carbonyl oxygen atoms at the Q[8] portal simultaneously reacting with Al3+ to form complexes with a 2![[thin space (1/6-em)]](https://www.rsc.org/images/entities/char_2009.gif) :
:![[thin space (1/6-em)]](https://www.rsc.org/images/entities/char_2009.gif) 1
1![[thin space (1/6-em)]](https://www.rsc.org/images/entities/char_2009.gif) :
:![[thin space (1/6-em)]](https://www.rsc.org/images/entities/char_2009.gif) 1 ratio, which leads to a fluorescence enhancement. The probe has high selectivity and sensitivity to identify Al3+, which can be used for quantitative detection and the monitoring of aluminum ions in the environment.
1 ratio, which leads to a fluorescence enhancement. The probe has high selectivity and sensitivity to identify Al3+, which can be used for quantitative detection and the monitoring of aluminum ions in the environment.
Author contributions
Guangyan Luo: concepts, methods, software, experimental operation, and writing. Ye Meng: solved crystal structures, modified the article, and organized information. Lin Zhang: supervision, and data curation. Xiaoyue Li: provided software analysis, supervision and review. Zhu Tao: supervision, review, provided ideas, and gave opinions. Qianjun Zhang: writing – review and editing, supervision, and review.Conflicts of interest
There are no conflicts to declare.Acknowledgements
We acknowledge support from the Science and technology support plan of Guizhou Province [Gui Zhou Science and Technology Cooperation Support (2020) 4Y218].Notes and references
- S. Supriti, M. Titas, C. BaSab, M. Anuradha and B. Anupam, The Analyst, 2012, 137, 3975–3981 RSC
.
- S. V. Verstraeten, L. Aimo and P. I. Oteiza, Arch. Toxicol., 2008, 82, 789–802 CrossRef CAS
.
- D. Crapper, S. Krishnan and A. Dalton, Science, 1973, 180, 511–513 CrossRef CAS
.
- D. P. Perl and A. R. Brody, Science, 1980, 208, 297–299 CrossRef CAS PubMed
.
- E. House, J. Collingwood, A. Khan, O. Korchazkina, G. Berthon and C. Exley, J. Alzheimer's Dis., 2004, 6, 291–301 CAS
.
- R. Singh, S. Samanta, P. Mullick, P. Mulliick, A. Ramesh and G. Das, Anal. Chim. Acta, 2018, 1025, 172–180 CrossRef CAS PubMed
.
- V. Kumar, S. Kundu, B. Sk and A. Patra, New J. Chem., 2019, 43, 18582–18589 RSC
.
- L. Patra, S. Das, S. Gharami, K. Aich and T. K. Mondal, New J. Chem., 2018, 42, 19076–19082 RSC
.
- G. L. Hong, K. B. Kim, G. J. Park, Y. J. Na, H. Y. Jo, S. A. Lee and C. Kim, Inorg. Chem. Commun., 2014, 39, 61–65 CrossRef
.
- Z. Li, N. Lu, X. Zhou and Q. Song, J. Pharm. Biomed. Anal., 2007, 43, 1609–1614 CrossRef CAS PubMed
.
- J. Zuziak and M. Jakubowska, J. Electroanal. Chem., 2017, 794, 49–57 CrossRef CAS
.
- S. Adams, J. Guest, M. Dickinson, R. J. Fussell, J. Beck and F. Schoutsen, J. Agric. Food Chem., 2017, 65, 7294–7304 CrossRef CAS
.
- P. Wang, J. Fu, K. Yao, Y. Chang, K. Xu and Y. Xu, Sens. Actuators, B, 2018, 273, 1070–1076 CrossRef CAS
.
- H. N. Kim, W. X. Ren, J. S. Kim and J. Yoon, Chem. Soc. Rev., 2012, 41, 3210–3244 RSC
.
- H. N. Kim, W. X. Ren, J. S. Kim and J. Yoon, Chem. Soc. Rev., 2012, 41, 3210–3244 RSC
.
- V. Kumar, B. Sk, S. Kundu and A. Patra, J. Mater. Chem. C, 2018, 6, 12086–12094 RSC
.
- G. Aragay, J. Pons and A. Merkoçi, Chem. Rev., 2011, 111, 3433–3458 CrossRef CAS
.
- J. Kim, I.-S. Jung, S.-Y. Kim, E. Lee, J.-K. Kang, S. Sakamoto, K. Yamaguchi and K. Kim, J. Am. Chem. Soc., 2000, 122, 540–541 CrossRef CAS
.
- J. Lagona, P. Mukhopadhyay, S. Chakrabarti and L. Isaacs, Angew. Chem., Int. Ed., 2005, 44, 4844–4870 CrossRef CAS
.
- Y. H. Ko, I. Hwang, D.-W. Lee and K. Kim, Isr. J. Chem., 2011, 51, 506–514 CrossRef CAS
.
- S. D. Choudhury, J. Mohanty, H. Pal and A. C. Bhasikuttan, J. Am. Chem. Soc., 2010, 132, 1395–1401 CrossRef CAS
.
- J. W. Lee, S. Samal, N. Selvapalam, H.-J. Kim and K. Kim, Acc. Chem. Res., 2003, 36, 621–630 CrossRef CAS
.
- S. Weiner, Angew. Chem., Int. Ed., 2005, 44, 4833–4834 CrossRef CAS
.
- W. L. Mock and N. Y. Shih, J. Org. Chem., 1986, 51, 4440–4446 CrossRef CAS
.
- Z. Zeng, Y. Zhang, X. Zhang, G. Luo, J. Xie, Z. Tao and Q. Zhang, Chin. Chem. Lett., 2021, 32, 2572–2576 CrossRef CAS
.
- Z. Zeng, X. Zhang, G. Luo, Y. Meng, L. Zhang, W. Zhao, Z. Tao and Q. Zhang, J. Mater. Chem. C, 2021, 9, 6160–6165 RSC
.
- W. Zhang, Y. Luo, Y. Zhou, M. Liu, W. Xu, B. Bian, Z. Tao and X. Xiao, Dyes Pigm., 2020, 176, 108235 CrossRef CAS
.
- W.-S. Chang, C.-C. Lin, S.-C. Chuang and H.-C. Chiang, Am. J. Chin. Med., 1996, 24, 11–17 CrossRef CAS PubMed
.
- J.-M. Yue, J. Xu, Y. Zhao, H.-D. Sun and Z.-W. Lin, J. Nat. Prod., 1997, 60, 1031–1033 CrossRef CAS
.
- M. Payá, B. Halliwell and J. Hoult, Biochem. Pharmacol., 1992, 44, 205–214 CrossRef
.
- W.-L. Lin, C.-J. Wang, Y.-Y. Tsai, C.-L. Liu, J.-M. Hwang and T.-H. Tseng, Arch. Toxicol., 2000, 74, 467–472 CrossRef CAS
.
- P. Thordarson, Chem. Soc. Rev., 2011, 40, 1305–1323 RSC
.
- Q. Lin, Y.-P. Fu, P. Chen, T.-B. Wei and Y.-M. Zhang, Dyes Pigm., 2013, 96, 1–6 CrossRef CAS
.
- S. Boija, A. Almesåker, E. Hedenström, D. Bylund, H. Edlund and M. Norgren, J. Mass Spectrom., 2014, 49, 550–556 CrossRef CAS
.
- S. M. Hossain, K. Singh, A. Lakma, R. N. Pradhan and A. K. Singh, Sens. Actuators, B, 2017, 239, 1109–1117 CrossRef CAS
.
- J. Wen, Z. Geng, Y. Yin, Z. Zhang and Z. Wang, Dalton Trans., 2011, 40, 1984–1989 RSC
.
- S.-Y. Ding, M. Dong, Y.-W. Wang, Y.-T. Chen, H.-Z. Wang, C.-Y. Su and W. Wang, J. Am. Chem. Soc., 2016, 138, 3031–3037 CrossRef CAS PubMed
.
- C. A. Parker and W. Rees, Analyst, 1960, 85, 587–600 RSC
.
- H. W. Melhuish, J. Phys. Chem., 1961, 65, 229–235 CrossRef
.
- D. Maity and T. Govindaraju, Inorg. Chem., 2010, 49, 7229–7231 CrossRef CAS PubMed
.
- A. T. Afaneh and G. Schreckenbach, J. Phys. Chem. A, 2015, 119, 8106–8116 CrossRef CAS PubMed
.
Footnote |
| † Electronic supplementary information (ESI) available: Fluorescence, and UV-vis spectra and additional figures. Limited experimental instruments, experimental methods, spectral data and crystallographic data. CCDC 2097128. For ESI and crystallographic data in CIF or other electronic format see DOI: 10.1039/d1nj04782e |
| This journal is © The Royal Society of Chemistry and the Centre National de la Recherche Scientifique 2022 |

