 Open Access Article
Atomic-scale dents on cellulose nanofibers: the origin of diverse defects in sustainable fibrillar materials†
Tomoki
Ito
 a,
Kazuho
Daicho
 a,
Shuji
Fujisawa
 a,
Tsuguyuki
Saito
 *a and
Kayoko
Kobayashi
 *b
*b
aDepartment of Biomaterial Sciences, Graduate School of Agricultural and Life Sciences, The University of Tokyo, 1-1-1 Yayoi, Bunkyo-ku, Tokyo 113-8657, Japan. E-mail: saitot@g.ecc.u-tokyo.ac.jp
bDivision of Forest and Biomaterials Science, Graduate School of Agriculture, Kyoto University, Sakyo-ku, Kyoto 606-8502, Japan. E-mail: kobayashi.kayoko.3s@kyoto-u.ac.jp
First published on 26th August 2022
Abstract
Atomic-scale dent structures on the surfaces of cellulose nanofibers were detected by comparing the experimentally measured and computer-simulated widths of single nanofibers. These dent parts constituted at least 30–40% of the total length of the dispersed nanofibers, and deep dents induced the kinking and fragmentation of nanofibers.
New conceptsDisintegration of hierarchical biological structures is a representative process in the production of sustainable nanofibrous materials. Examples include the fibrillation of plant cellulose, crustacean chitin, and silk protein. Cellulose nanofibers (CNFs) with high strength, thermal stability, and other diverse functionalities can be produced via disintegration of plant cell walls. These CNFs, however, have structural defects such as kinks, splits and dislocation, and such defects hinder efforts to exploit the potential of CNFs in practical use. Understanding of the defects’ atomic-scale structure, origin, and formation mechanism is now lacking. Herein, we report that atomic-scale dents are formed at various positions on the CNF surfaces in the process of cell wall disintegration. These dents are identified as the structural origin of CNF defects, eventually resulting in the fragmentation of CNFs. Our analyses suggest that the cause of dent formation is inherent in the cell walls; pretreatment of cell wall cellulose, such as purification or modification, could be a key process to control the defect formation. These findings will lead to the exploitation of the full potential of CNFs and other biopolymers, such as producing defect-free, high-performance nanofibers from sustainable resources. |
Introduction
Defects in nanoscale materials—such as graphene and carbon nanotubes—dominate their physical properties. There are several types of defects, including doping,1 dislocations,2 and vacancies.3,4 In general, these structural inhomogeneities adversely affect the featured properties of nanoscale materials.3,4 Some defects can be also utilized to functionalize the materials as semiconductors5 and catalysts.6Cellulose nanofibers (CNFs), wood-derived sustainable nanoscale materials with excellent mechanical and thermal properties, are produced via wet disintegration of cell wall cellulose in wood.7,8 The crystalline and morphological structures of CNFs have been investigated using spectroscopic,9,10 microscopic,9,11–16 and scattering9,11–13 methods. However, the local structure of CNFs, including the defects, remains unclear. In all these approaches, the low degree of crystallinity and the 2–4 nm width of CNFs15,17–19 have hindered a precise analysis of the local structure of CNFs. The development of atomic force microscopy (AFM) in recent years has enabled the precise measurement of the height of the soft samples without damaging them.20,21 Therefore, AFM has been frequently used in research on CNFs over the last decade. Most of these studies have focused on simple geometrical features, such as the length and width of the fibers. Some studies have reported the presence of fragments and splits in CNFs with a thickness of a few angstroms.22,23 These structures are thinner than the CNFs, suggesting the presence of many defects in the CNFs. Some simulation studies have suggested that external stress results in splits and breaks in the cellulose molecular chains in CNFs.24,25
Here, we report dent defects on the surface of CNFs. To detect dent defects on the CNFs, we compared the AFM-measured heights of the CNFs with the simulated heights, assuming two models for the cross-sectional shapes of single CNFs. We analyzed the number, distribution, and shape of the dent defects in four CNF samples prepared using different disintegration methods and times. Finally, we discuss the mechanism of defect formation, the moment at which dent defects form, and the structural origin of the dent defects.
The interaction between the sample and the shape of the AFM tip, called the tip convolution effect, causes artifacts in the AFM image, resulting in a decrease in lateral resolution.26–28 Therefore, the centerline of CNFs indicates the most accurate height, and some previous reports have attempted to represent fiber-like samples by their centerline contours.29–31 In this study, the heights along the centerline of the CNFs were extracted using image processing. Furthermore, the possible range of CNF heights under the conditions of AFM observation was determined by considering convolution effects. The AFM tip was assumed to be a sphere, and the distance between the tip and substrate when the tip collided with the CNF was calculated (see ESI† for detailed image processing and AFM simulation).
Results and discussion
Overview of CNF samples
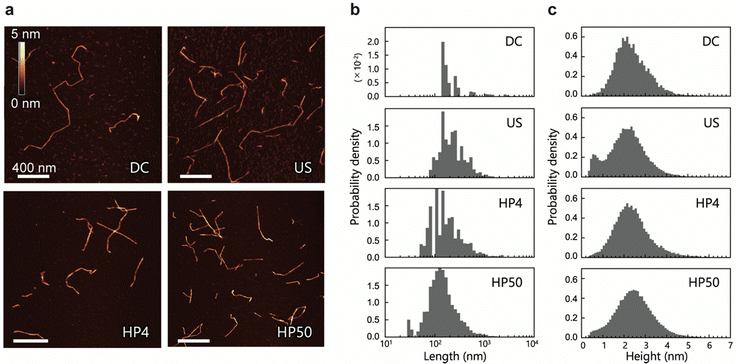
We prepared four CNF dispersions from a 2,2,6,6-tetramethylpiperidin-1-oxyl (TEMPO)-oxidized pulp by wet disintegration using three different homogenizers: double-cylinder (DC), ultrasonic (US), and high-pressure (HP) homogenizers; the prepared samples were accordingly designated as DC, US, and HP. Two different samples were prepared using the HP homogenizer; they are denoted as HP4 and HP50, where the numbers indicate the number of times the sample passed through the homogenizer (Scheme S1, ESI†). Typical AFM images of DC, US, HP4, and HP50 are shown in Fig. 1a. AFM images were acquired while avoiding the areas where the CNFs were clearly unfibrillated. Therefore, the measured CNFs were isolated and dispersed in all samples. As in previous studies,22,23,30 numerous thin and small fractions were observed around the CNFs. However, differentiating between the fractions derived from the samples and noise is difficult; therefore, in the following analyses, these small and thin fractions were ignored.Using nine or more images for each sample (see details in Table S1, ESI†), we extracted the centerlines of the CNFs. We statistically evaluated the morphology of the CNFs from these centerlines. The length and height distributions of the CNFs are shown in Fig. 1b and c, respectively. The mean values of length and height, the mode of height, and the mean distances between kinks are summarized in Table 1. Differing methods and degrees of disintegration resulted in different sample lengths, with DC being the longest and HP50 being the shortest. All CNF samples, on the other hand, showed similar broad height distributions, with both the mean and most frequent values being within 2.1–2.5 nm. These broad distributions and maximum frequency values of the height are in good agreement with those reported in previous studies.23,30 The mean distances between the kinks were also similar among the samples. We also observed twisting of the CNFs, which was indicated by periodic changes in the height; however, in contrast to a previous study,31 it was neither frequent nor clear.
| Mean length (nm) | Mean height (nm) | Mode of height (nm) | Mean distance between kinks (nm) | |
|---|---|---|---|---|
| DC | 1522.3 | 2.38 | 2.15 | 122 |
| US | 544.4 | 2.12 | 2.35 | 114 |
| HP4 | 521.3 | 2.42 | 2.15 | 125 |
| HP50 | 375.9 | 2.49 | 2.45 | 122 |
Usov et al. suggested that the broad height distribution might be due to the possibility of CNFs to split and thus have various thickness.23 In a simulation study, it was suggested that external forces could cause the formation of bending points in CNFs owing to the breakdown of molecular chains.24 Therefore, the low height distributions in Fig. 1c can be attributed to the mechanically defective regions of the CNFs, which appeared as dents along them.
Theoretical range of heights measured by AFM
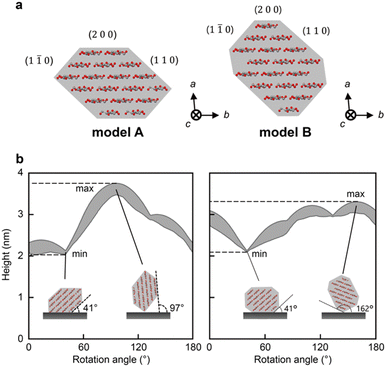
To determine the threshold of the defects, we calculated the heights of the CNFs that were observed using AFM under our experimental conditions. We used two cross-sectional models of CNF from wood: models A9,32 and B13 (Fig. 2a). Models A and B are 18-chain models suggested based on experimental9,13 and/or simulated data.32 Because the CNFs could be twisted, we conducted a simulation by rotating these models from 0° to 180° in increments of 1°.Fig. 2b shows the changes in the range of height with rotation of the cross-sectional models. The rotation angle indicates the angle between the substrate and the (2 0 0) plane. For both models, the minimum heights were measured at 41°, where the (1 1 0) plane was adsorbed on the substrate (inset of Fig. 2b). The maximum heights of models A and B were recorded at rotation angles of 97° and 162°, respectively, where the longest diagonal line of each cross-section was vertical to the substrate (inset of Fig. 2b). Therefore, the possible ranges of the heights were calculated as 2.02–3.78 nm and 2.10–3.30 nm for models A and B, respectively. The range of model A covered that of model B; thus, we used the range of model A, 2.02–3.78 nm, as the theoretical range of CNF heights for further analysis. Note that the indentation of the tip here is small enough to be ignored (see ESI† for a calculation of the indentation).
Distribution of dents on CNFs
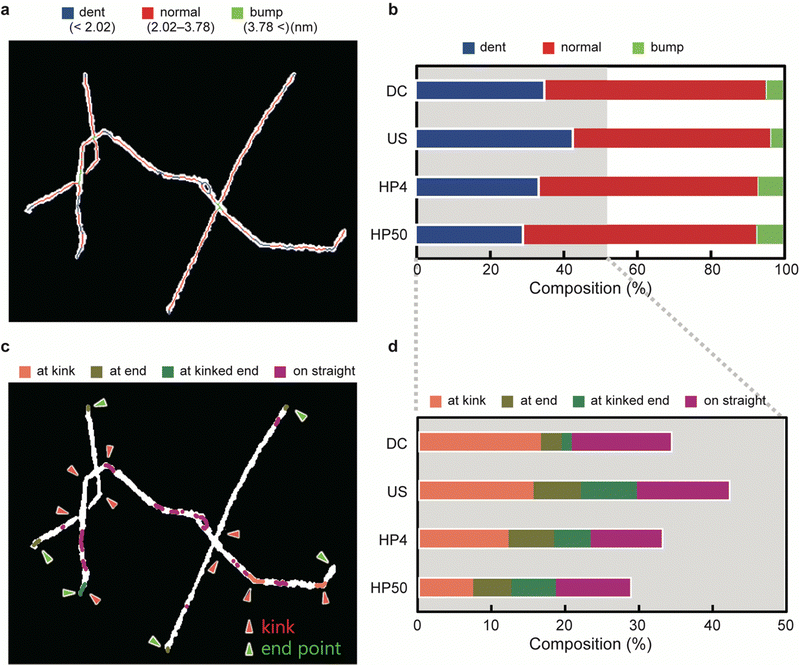
According to the results of the AFM simulation, the CNF height was divided into three levels: ‘dent’ (height < 2.02 nm), ‘normal’ (height in the range 2.02–3.78 nm), and ‘bump’ (height > 3.78 nm). The levels were mapped onto AFM images, as shown in Fig. 3a. The bumps, which were less than 10% of the total length for all the samples (Fig. 3b), were mainly observed in the overlapping regions of the CNFs. The dents, on the other hand, constituted approximately 30–40% of the total length and were distributed in various regions of the CNFs.Based on the positions at which the dents occurred, we classified the dents into four categories (Fig. 3c). When a dent included a kink, an end point, or both, it was categorized as ‘at kink’, ‘at end’, or ‘at kinked end’, respectively. The others, which occurred on straight lines or gentle curves, were categorized as ‘on straight’. Fig. 3d shows the composition of the four categories of dents.
We can assume that the dents are defective regions that lack cellulose molecules. The normal regions may also include such defects, but we did not consider them in the present study. This is because we speculate that most of the CNFs exist on the mica substrate in the (1 1 0) plane direction, where the CNFs give the minimum height of the theoretical range (2.02 nm), due to the following reasons: (1) the most frequent height was 2.1–2.5 nm (Fig. 1c and Table 1), which corresponds to the rotation angles of 0–41° and around 41° for model A and B, respectively (Fig. 2b); (2) both the (1 1 0) plane and the surface of the mica substrate are hydrophilic; and (3) the side of the (1 1 0) plane is the longest in both the models A and B, which seems to stable.
If an increase in severity of physical disintegration increases the number of defects, then the number of dents should increase with a decrease in the length of the CNFs. However, the number of dents on the CNFs did not differ significantly among the samples prepared by different methods; instead, when US, HP4, and HP50 were compared, the number of dents decreased with a decrease in length. This result suggests that the defects on the CNFs were primarily generated at the very beginning of dispersion, and not during the mechanical treatments after dispersion.
The composition of the dents at kink differed by at most 9% among the samples. The declining trend in the number of dents at the kink agrees with the length of the CNFs (Fig. 3d and Table 1). Combined with the result that the distance between the kinks was constant among the samples (Fig. 3d and Table 1), the CNFs were mainly fragmented at the defects that occurred at the kink during physical disintegration. This result is consistent with a previous report.33
Geometry of dents
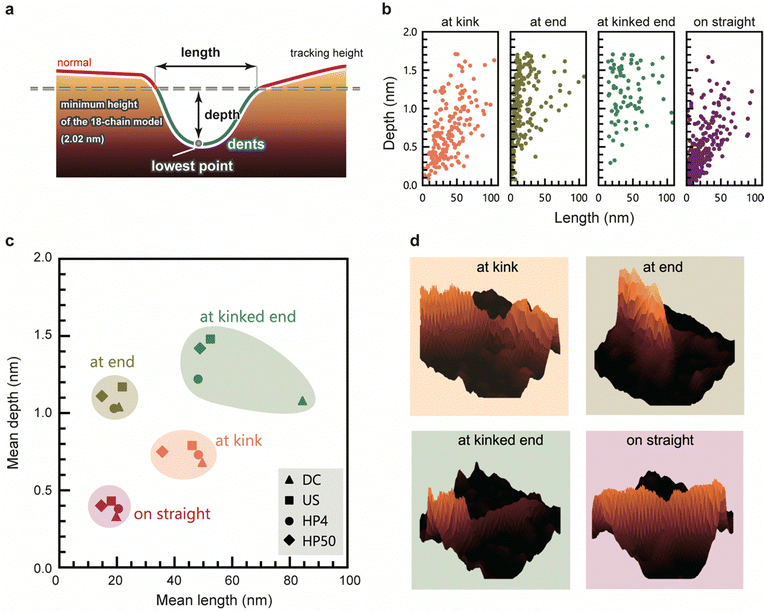
We evaluated the geometry of the dents based on their lengths and depths (Fig. 4a). Fig. 4b shows depth-length scatter plots of the dents of HP4 at each position. The scatter plots of the other samples are presented in Fig. S5 (ESI†). Compared to the dents on straight, the dents at kink tended to be longer and deeper than those on the straight. Most of the dents at the end were very short, whereas many long and deep dents occurred at the kinked end. These long and deep dents at kinked end occurred most frequently in US (Fig. 3d), and a peak around 0.5 nm in the height distribution of US was observed (Fig. 1c and Fig. S6, ESI†). Fig. 4c shows a scatter plot of the mean length and depth of the dents at each position for all the samples. The length and depth of the dents differed depending on their position. However, there was no significant difference in the length and depth of dents corresponding to the disintegration methods and times. Typical 3D views of the dents at each position are shown in Fig. 4d.In addition to the number of dents, the geometry of the dents was also similar even when the CNFs were prepared using different disintegration methods and times. These results suggest that the regions of defect were neither newly generated nor did they expand during the physical treatments after dispersion; they originally existed in the CNFs bundles, or were generated just after the disintegration of the aggregated CNF bundles into single CNFs. This hypothesis is supported by our recent studies on the crystallinity of CNFs; the aggregated bundles of cellulose have a higher crystallinity than the dispersion state, and the grain boundaries within an aggregate of CNFs were crystallized by enhancing their inter–crystallite interactions.9,34 This means that the boundary between CNFs is partly unclear in the aggregated bundles. Irrespective of the type of mechanical force applied, in the process of dispersion, the CNFs are forced to be torn off from such a fused boundary, which may induce imperfect splitting and/or fragmentation of the CNFs. The slightly higher composition of dents in US is probably aside from this hypothesis for the structural origin of dents; US contained more CNFs with long and thin tails or the dents at “end” and “kinked end” than other samples, which possibly arose from the mechanical force applied by ultra-sonication.
The dents at the kink were larger than those on the straight, indicating that the CNFs tend to be bent at the defected regions which are sufficiently large. If one cellulose molecular layer is delaminated in any plane direction, the depth would be approximately 0.4 nm. Many dents at the kink are deeper than 0.4 nm, with the depths of some of the dent defects at kink corresponding to delamination of two and three cellulose layers. In contrast, the depths of most of the dents on the straight line are lower than 0.4 nm (Fig. 4b, straight), which corresponds to less than one layer. This might be explained by incomplete delamination of one layer or distortion of crystal structure. The mechanism by which kinks occur in CNFs with the deformation or breakage of molecular chains has been investigated using molecular dynamics simulations,24,25 but the instance at which these defects occur during the preparation of CNFs is not yet known. The kinks possibly formed during deposition of CNFs on the substrate or drying process of the sample. However, the dent structure should originally exist in a dispersion; the cellulose molecules bundling in water as a part of single CNF are unlikely to be peeled off at the drying step.
Conclusions
We reported atomic-scale dent defects on CNFs, observed using AFM. Long and deep dent defects occurred around kinked regions, and they decreased as the lengths of the CNFs decreased. These results indicate that diverse defects, such as kinks and fragmentation, originate from dent defects. Furthermore, we compared the samples prepared using different disintegration methods and times. The number, size, and distribution of the dent defects were similar among all the samples. The implication is that the cause of dent defects is inherent in the pulp before disintegration; pre-treatment of the pulp, such as pulping, bleaching, or TEMPO-oxidation, could be a key process to control defect formation.Disintegration of hierarchical biological structures is a representative process in the production of sustainable nanofibrous materials. Examples include the fibrillation of crustacean chitin and silk protein, other than plant cellulose in this study. Our findings will lead to the exploitation of the full potential of CNFs and other biopolymers, such as producing defect-free, high-performance nanofibers from sustainable resources.
Author contributions
K. K. conceived the concept of the study; T. S., and K. K. designed the experiments; T. I. and K. D. performed the experiments, and all authors analyzed the data; T. I. primarily wrote the Python code with K. K.; T. I. prepared the first version of manuscript, and T. S. and K. K. mainly revised the manuscript with contributions from all authors.Notes
Python code used in this study is available at GitHub (https://www.github.com/terio0819/Image-processing-of-AFM-image).Conflicts of interest
There are no conflicts to declare.Acknowledgements
This research was supported partly by the JST-Mirai R&D Program (JPMJI17ED), JSPS Grant-in-Aids for Scientific Research (18K14501, 20J12793, 20K15567 and 21H04733) and the Research Program for Next Generation Young Scientists of “Network Joint Research Center for Materials and Devices: Dynamic Alliance for Open Innovation Bridging Human, Environment and Materials” (20215022). The TEMPO-oxidized pulps used in this study were kindly provided by DKS Co., Ltd.References
- S. Kawai, S. Saito, S. Osumi, S. Yamaguchi, A. S. Foster, P. Spijker and E. Meyer, Nat. Commun., 2015, 6, 8098 CrossRef CAS PubMed.
- P. Y. Huang, C. S. Ruiz-Vargas, A. M. van der Zande, W. S. Whitney, M. P. Levendorf, J. W. Kevek, S. Garg, J. S. Alden, C. J. Hustedt, Y. Zhu, J. Park, P. L. McEuen and D. A. Muller, Nature, 2011, 469, 389–392 CrossRef CAS PubMed.
- N. Jing, Q. Xue, C. Ling, M. Shan, T. Zhang, X. Zhou and Z. Jiao, RSC Adv., 2012, 2, 9124–9129 RSC.
- B. Mortazavi and S. Ahzi, Carbon, 2013, 63, 460–470 CrossRef CAS.
- B. J. Morgan and G. W. Watson, Phys. Rev. B: Condens. Matter Mater. Phys., 2009, 80, 233102 CrossRef.
- J. Di, C. Chen, S.-Z. Yang, M. Ji, C. Yan, K. Gu, J. Xia, H. Li, S. Li and Z. Liu, J. Mater. Chem. A, 2017, 5, 14144–14151 RSC.
- T. Saito, R. Kuramae, J. Wohlert, L. A. Berglund and A. Isogai, Biomacromolecules, 2013, 14, 248–253 CrossRef CAS PubMed.
- I. Sakurada, Y. Nukushina and T. Ito, J. Polym. Sci., Part A: Gen. Pap., 1962, 57, 651–660 CAS.
- K. Daicho, T. Saito, S. Fujisawa and A. Isogai, ACS Appl. Nano Mater., 2018, 1, 5774–5785 CrossRef CAS.
- K. Daicho, S. Fujisawa, K. Kobayashi, T. Saito and J. Ashida, J. Wood Sci., 2020, 66, 62 CrossRef CAS.
- Y. Su, C. Burger, B. S. Hsiao and B. Chu, J. Appl. Crystallogr., 2014, 47, 788–798 CrossRef CAS.
- L. Geng, X. Peng, C. Zhan, A. Naderi, P. R. Sharma, Y. Mao and B. S. Hsiao, Cellulose, 2017, 24, 5417–5429 CrossRef CAS.
- T. R. Rosén, H. He, R. Wang, C. Zhan, S. Chodankar, A. Fall, C. Aulin, T. Larsson, T. Lindströ and B. S. Hsiao, ACS Nano, 2020, 14, 16743–16754 CrossRef PubMed.
- S. Iwamoto, W. Kai, A. Isogai and T. Iwata, Biomacromolecules, 2009, 10, 2571–2576 CrossRef CAS PubMed.
- R. Kuramae, T. Saito and A. Isogai, React. Funct. Polym., 2014, 85, 126–133 CrossRef CAS.
- M. Shimizu, T. Saito, Y. Nishiyama, S. Iwamoto, H. Yano, A. Isogai and T. Endo, Macromol. Rapid Commun., 2016, 37, 1581–1586 CrossRef CAS PubMed.
- T. Saito, S. Kimura, Y. Nishiyama and A. Isogai, Biomacromolecules, 2007, 8, 2485–2491 CrossRef CAS PubMed.
- T. Saito, M. Hirota, N. Tamura, S. Kimura, H. Fukuzumi, L. Heux and A. Isogai, Biomacromolecules, 2009, 10, 1992–1996 CrossRef CAS PubMed.
- R. Tanaka, T. Saito and A. Isogai, Int. J. Biol. Macromol., 2012, 51, 228–234 CrossRef CAS PubMed.
- A. Pyne, R. Thompson, C. Leung, D. Roy and B. W. Hoogenboom, Small, 2014, 10, 3257–3261 CrossRef CAS PubMed.
- H. Schillers, I. Medalsy, S. Hu, A. L. Slade and J. E. Shaw, J. Mol. Recognit., 2016, 29, 95–101 CrossRef CAS PubMed.
- Y. Su, C. Burger, H. Ma, B. Chu and B. S. Hsiao, Biomacromolecules, 2015, 16, 1201–1209 CrossRef CAS PubMed.
- I. Usov, G. Nyström, J. Adamcik, S. Handschin, C. Schütz, A. Fall, L. Bergström and R. Mezzenga, Nat. Commun., 2015, 6, 7564 CrossRef CAS PubMed.
- P. N. Ciesielski, R. Wagner, V. S. Bharadwaj, J. Killgore, A. Mittal, G. T. Beckham, S. R. Decker, M. E. Himmel and M. F. Crowley, Proc. Natl. Acad. Sci. U. S. A., 2019, 116, 9825–9830 CrossRef CAS PubMed.
- X. Wu, R. J. Moon and A. Martini, Cellulose, 2014, 21, 2233–2245 CrossRef CAS.
- G. B. Picotto, M. Vallino and L. Ribotta, Meas. Sci. Technol., 2020, 31, 084001, DOI:10.1088/1361-6501/ab7bc2.
- D. Hussain, K. Ahmad and J. Song, Nanotechnology, 2014, 25, 395703 CrossRef PubMed.
- D. Tranchida, S. Piccarolo and R. A. C. Deblieck, Meas. Sci. Technol., 2006, 17, 2630–2636 CrossRef CAS.
- I. Usov and R. Mezzenga, Macromolecules, 2015, 48, 1269–1280 CrossRef CAS.
- G. Nyström, M. Arcari, J. Adamcik, I. Usov and R. Mezzenga, ACS Nano, 2018, 12, 5141–5148 CrossRef PubMed.
- M. Arcari, E. Zuccarella, R. Axelrod, J. Adamcik, A. Sánchez-Ferrer, R. Mezzenga and G. Nyström, Biomacromolecules, 2019, 20, 1288–1296 CrossRef CAS PubMed.
- H. Yang and J. D. Kubicki, Cellulose, 2020, 27, 2389–2402 CrossRef CAS.
- Y. Zhou, T. Saito, L. Bergström and A. Isogai, Biomacromolecules, 2018, 19, 633–639 CrossRef CAS PubMed.
- K. Daicho, K. Kobayashi, S. Fujisawa and T. Saito, Angew. Chem., Int. Ed., 2021, 60, 24630–24636 CrossRef CAS PubMed.
Footnote |
| † Electronic supplementary information (ESI) available: Experimental section and supplementary figures. See DOI: https://doi.org/10.1039/d2nh00355d |
| This journal is © The Royal Society of Chemistry 2022 |


