
A lanthanide nanocomposite with cross-relaxation enhanced near-infrared emissions as a ratiometric nanothermometer†
Qian
Hu
a,
Na
Kong
a,
Yingjie
Chai
b,
Zhenyu
Xing
a,
Yukai
Wu
a,
Jieying
Zhang
a,
Fuyou
Li
 *b and
Xingjun
Zhu
*a
*b and
Xingjun
Zhu
*a
aSchool of Physical Science and Technology, ShanghaiTech University, 393 Middle Huaxia Road, Shanghai, 201210, P. R. China. E-mail: zhuxj1@shanghaitech.edu.cn
bDepartment of Chemistry & State Key Laboratory of Molecular Engineering of Polymers & Collaborative Innovation Center of Chemistry for Energy Materials, Fudan University, 2005 Songhu Road, Shanghai 200438, P. R. China. E-mail: fyli@fudan.edu.cn
First published on 2nd August 2022
Abstract
Lanthanide luminescence nanothermometers (LNTs) provide microscopic, highly sensitive, and visualizable optical signals for reporting temperature information, which is particularly useful in biomedicine to achieve precise diagnosis and therapy. However, LNTs with efficient emissions at the long-wavelength region of the second and the third near-infrared (NIR-II/III) biological window, which is more favourable for in vivo thermometry, are still limited. Herein, we present a lanthanide-doped nanocomposite with Tm3+ and Nd3+ ions as emitters working beyond 1200 nm to construct a dual ratiometric LNT. The cross-relaxation processes among lanthanide ions are employed to establish a strategy to enhance the NIR emissions of Tm3+ for bioimaging-based temperature detection in vivo. The dual ratiometric probes included in the nanocomposite have potential in monitoring the temperature difference and heat transfer at the nanoscale, which would be useful in modulating the heating operation more precisely during thermal therapy and other biomedical applications. This work not only provides a powerful tool for temperature sensing in vivo but also proposes a method to build high-efficiency NIR-II/III lanthanide luminescent nanomaterials for broader bio-applications.
New conceptsWe report a lanthanide-doped core–multishell nanocomposite with emissions at the near-infrared second and third biological window (NIR-II and NIR-III) for temperature sensing in a living body. A strategy based on the cross-relaxation (CR) processes of lanthanide ions is proposed to enhance the near infrared emission intensity and to establish a ratiometric optical nanothermometer. By utilizing CR processes of the matrix (NaGdF4) and emitters (Tm3+ and Nd3+), the NIR-II and NIR-III luminescence intensities of the emitter ions are significantly enhanced compared to conventional lanthanide luminescent nanomaterials (e.g. ∼25-fold enhancement of the quantum yield at 1470 nm emission of Tm3+ compared to the pure NaYF4-matrix nanocomposite without the cross-relaxation effect). Meanwhile, the CR rates correlate with temperature resulting in the corresponding change of emission intensity, which endows the nanocomposite with temperature sensing function. Moreover, the nanocomposite in this work involves two ratiometric temperature probes in different layers of the nanostructure, which are at a close distance of around 8 nm. It thus can be used to interpret nanoscale heat conduction in the biological system giving high spatial resolution. This work presents a lanthanide nanothermometer for in vivo application and also provides concepts of optimizing NIR-II/III luminescence of lanthanide luminescent materials, which we believe will inspire the design of lanthanide nanomaterials with efficient luminescence for bioimaging, biosensing, and other biomedical applications. |
Introduction
Temperature detection is of profound significance in biomedicine as it is helpful to reveal the heat generation and conduction mechanisms and be used to modulate the thermal effect in a more precise fashion at the cellular or sub-cellular level, which opens a new avenue to interpret the disease progression and physiological process in the living body.1–6 When measuring the temperature at the microscopic level, conventional measurement methods based on macroscopic devices such as thermocouples, optical fibers or thermal cameras are not suitable mainly because their spatial accuracy is not high enough, which can only give the average temperature value of a certain region.5 Meanwhile, there is also a concern about the invasiveness of the methods using thermocouples and optical fibers.7 Hence, it is necessary to develop thermometers based on nano/micro-materials that fit the scale of the object being observed. Several types of nanothermometers have been reported in recent years utilizing optical, photoacoustic and magnetic effects.8–10 Optical nanothermometers due to the advantages of high sensitivity, fast collecting speed for continuous measurement in real time and providing non-invasive, visualizable and wide range detection results, have attracted more and more attention and emerged as promising candidates for practical applications.8,11Lanthanide luminescence nanoparticles possessing unique merits of being non-blinking, superior photostability, and adjustable multi-band emissions covering a wide electromagnetic spectrum, are ideal candidates to serve as optical nanothermometers.4,12–19 Temperature sensing based on lanthanide luminescence could be realized by the change of bandwidth, spectral shift, luminescence intensity ratio, lifetime, etc.,20–22 in which the intensity ratio and lifetime are less disturbed by the physiological environment and thus have higher temperature measurement accuracy. As an inherent characteristic, the luminescence lifetime is negligibly affected by biological tissues that can improve the accuracy of the readouts.23–25 On the other hand, nanothermometers based on the intensity ratio have the advantage of simple signal collection leading to fast detection speed, which is better for real-time tracking of rapid temperature change.22 For example, the pioneering work of Capobianco et al. demonstrated the application of the Er3+-doped upconversion nanothermometer with a ratiometric signal output to eliminate the deviation in spectral measurement caused by the absorption and scattering from biological tissue.26 We further combined the upconversion nanothermometer with photothermal materials to detect the microscopic temperature during photothermal therapy to achieve facile and accurate treatments.27 It is worth noting that Lis and Martín et al. recently developed luminescence thermometers using both the lifetime and intensity ratio as signals, which can achieve ideal thermal sensitivity and low uncertainty.23,25
Near-infrared (NIR) biological windows (BWs), of which the first, second and third NIR BW are located at 650–950 nm (NIR-I), 1000–1350 nm (NIR-II) and 1350–2400 nm (NIR-III), respectively,28 are suitable for the optical detection of temperature in vivo due to the relatively low extinction coefficient at these regions. The development of LNTs working at the NIR BW, especially at NIR-II/III with higher imaging resolution, has emerged as an important topic in recent years. For example, Jaque and Carlos et al. expanded the emissions of lanthanide luminescence nanothermometers (LNTs) to the NIR region, which promoted the applicability of LNTs for imaging-based in vivo thermometry.29–31 Nevertheless, there are still some aspects to be ameliorated in LNTs. Several lanthanide ions such as Yb3+, Nd3+, Ho3+, Tm3+ and Er3+ have been used as emitters for NIR-II/III LNTs.32–37 The working wavelengths available for temperature sensing beyond 1200 nm have attracted much attention. It has been reported that emissions at a longer wavelength (>1200 nm) in the NIR-II/III window exhibited improved signal-to-noise ratio by a 100-fold factor, high imaging resolution and sensitivity and deeper tissue penetration compared to the ones at the visible or NIR-I window region.38–47 There are a few examples such as single band LiErF4/LiYF4 nanoparticles reported by Vetrone et al. which work around 1500 nm,42 SrTiO3:Ni2+,Er3+ nanoparticles developed by Marciniak et al. with 1200 and 1500 nm emissions,43 (GdNd)2O3 by Carlos et al. working around 1350 nm,44 LaF3 nanoparticles by Jacinto and Jaque et al. with the third near-infrared biological windows45,46 and Yb3+, Ho3+, Er3+ co-doped rare earth fluorides by Martín and Lis et al. in a broad spectral range (400–1700 nm).23,47 However, the performances of these NIR-II/III LNTs are still under optimization and their in vivo thermometry applications are still limited. It should be noted that the emission wavelength around 1450 nm is reported to have high imaging contrast in biotissue,48 so it is important to develop NIR-II/III nanothermometers with longer working wavelengths to improve the performance of imaging-based temperature sensing. Tm3+ ions with multiple electron transition processes generating NIR-II/III luminescence (3H4 → 3F4, 3H5 → 3H6 and 3F4 → 3H6, etc., in which 3H4 → 3F4 can produce emission at 1470 nm13,49) are expected to be a promising emitter for building imaging-based nanothermometers. However, the NIR-II/III luminescence of Tm3+ is relatively weak due to some factors. For instance, the 3H4 state is close to the next lower energy level 3H5 (∼4300 cm−1) so the 3H4 → 3F4 transition is easily quenched by non-radiative relaxation (3H4 → 3H5). Moreover, the pumping of 3H4 requires a two-photon upconversion process (3H6 → 3F2,3, achieved in Yb3+–Tm3+ system) to populate the Tm3+ ion to the higher energy state 3F2,3 followed by a relaxation process (3F2,3 → 3H4). As a result, the NIR-III emission efficiency of Tm3+ is much less than other lanthanide ions such as Er3+, Nd3+, and Yb3+. LaF3 nanoparticles with high Tm-doping are reported to enhance the NIR-III emission for thermometry, but the luminescence was excited by a short wavelength of 690 nm (lower tissue penetration than the longer wavelength) and it has not been used for in vivo imaging or detection yet.45 The development of a Tm3+-doped nanothermometer with improved luminescence intensity and longer excitation wavelength will be beneficial to in vivo optical thermometry.
Herein, a NIR-II/III emissive dual ratiometric luminescent nanothermometer (DRLNT) composed of a core–multishell structured lanthanide-doped nanocomposite, NaGdF4:Yb,Tm@NaYF4:Yb@NaGdF4:Yb,Nd@NaGdF4, is designed for monitoring the temperature change in biological systems. Under the excitation of 808 nm light, DRLNT generates two emission bands at 1470 nm (3H4 → 3F4 transition of Tm3+) and 1330 nm (4F3/2 → 4I13/2 transition of Nd3+), respectively. Both emissions are employed as working wavelengths to establish two independent ratiometric temperature sensing probes (1215 nm emission of Tm3+ as reference). The NIR-III emission of Tm3+ is boosted via energy transfer processes among lanthanide ions to optimize the temperature sensing performance in vivo. The possible mechanisms for the improvement of NIR emissions and temperature response of DRLNT are discussed and investigated in detail. The temperature detection using DRLNT based on NIR-III bioimaging is demonstrated in the mouse inflammation model.
Results and discussion
Characterization of the dual-ratiometric lanthanide luminescent nanothermometer (DRLNT)
A DRLNT with a core–multishell structure was prepared by an epitaxial growth strategy. NaGdF4 and NaYF4 are chosen as hosts due to their lower phonon energy. NaGdF4:Yb,Tm as the core generates NIR emissions at 1215 and 1470 nm. The NaYF4:Yb interlayer suppresses the cross relaxation between the sensitizer (Nd3+) and activator (Tm3+) and produces an energy lock-in effect to prevent the energy dissipation from Tm3+ to Gd3+ in the outer shell layers.50,51 The NaGdF4:Yb,Nd layer harvests the energy of 808 nm photons to excite the emission of Nd3+ (e.g. at 1330 nm) and to be transferred to Tm3+ through the energy migration process. The outmost layer of NaGdF4 protects the luminescence from direct quenching (Scheme 1). As shown in the transmission electron microscopy (TEM) images (Fig. 1(a)–(d) and Fig. S1, ESI†), the size of the core and core–multishell nanoparticles increased after each step of the shell growth procedure and their monodispersity was well retained. Core nanoparticles (NaGdF4:Yb,Tm, denoted as CNP) with an average diameter of 22.1 nm exhibited a spherical-like morphology (Fig. 1(a)). After the growth of the NaYF4:Yb shell (NaGdF4:Yb,Tm@NaYF4:Yb, denoted as CS1NP), the nanoparticles turned into a rod-like shape with 30.2 nm length and 23.4 nm width due to the slight anisotropic growth of NaYF4 on NaGdF4 (Fig. 1(b)). The following NaGdF4:Yb,Nd coating (NaGdF4:Yb,Tm@NaYF4:Yb@NaGdF4:Yb,Nd, denoted as CS2NP) further increased the size of the nanoparticles to about 38.6 nm (Fig. 1(c)). After the construction of the NaGdF4 inert shell, the final size of the DRLNT was 45.1 nm on average and a hexagonal morphology was formed (Fig. 1(d)). High-angle annular dark field scanning TEM (HAADF-STEM) images of the DRLNT revealed that lanthanide elements, Gd, Yb, Y and Nd, had distributions in line with the composition of the core and shell layers (Fig. 1(i)–(p)), indicating the successful synthesis of the core–multishell structure. High-resolution TEM (HR-TEM) images indicated good crystallinities of the core and core–multishell nanoparticles and the (1 0 0) lattice planes of hexagonal phase NaYF4 (Fig. 1(f)) and NaGdF4 can be identified (Fig. 1(e), (g) and (h)). X-ray powder diffraction (XRD) analysis further confirmed the pure hexagonal phases of the DRLNT and its intermediates (Fig. S4, ESI†). Near infrared (NIR) luminescence spectra demonstrated that the DRLNT had multiple emission bands in the NIR-II/III biological window (Fig. 2(a)). The peaks at 1215 and 1470 nm indicated the 3H5 → 3H6 and 3H4 → 3F4 transitions of Tm3+, respectively. The emission at 1330 nm was derived from the 4F3/2 → 4I13/2 transition of Nd3+. From our point of view, the NaGdF4 matrix plays a key role in improving the NIR luminescence of the DRLNT. One reason is that the lowest excited state of Gd3+ (6P7/2) is located in the ultraviolet region, in which the energy is much higher than the excited states of Yb3+ and Nd3+, therefore efficiently preventing the loss of excitation energy induced by the relaxation to quenching centres in the environment. Hence, the DRLNT with the NaGdF4 inert shell had substantially stronger emission intensities than CNP, CS1NP or CS2NP nanoparticles. For example, the NIR emissions of the DRLNT at 1215, 1330 and 1470 nm were 1.7, 4.6 and 3.1-fold stronger than that of CS2NP, respectively (Fig. 2(a)). | ||
| Scheme 1 Schematic of the NaGdF4:Yb,Tm@NaYF4:Yb@NaGdF4:Yb,Nd@NaGdF4 nanocomposite as a dual ratiometric luminescence nanothermometer (DRLNT). Under the excitation of an 808 nm light source, Nd3+ ions and Tm3+ ions are activated to generate near infrared (NIR) emissions. With the cross-relaxation and phonon-assisted energy transfer processes among lanthanide ions, NIR emissions of DRLNT can be enhanced. The emission at 1215 nm generated from Tm3+ is used as a reference and the emissions at 1470 and 1330 nm from Tm3+ and Nd3+ serve as working wavelengths for temperature sensing. | ||
 | ||
| Fig. 1 Transmission electron microscopy (TEM) of (a) NaGdF4:Yb,Tm (CNP), (b) NaGdF4:Yb,Tm@NaYF4:Yb (CS1NP), (c) NaGdF4:Yb,Tm@NaYF4:Yb@NaGdF4:Yb,Nd (CS2NP) and (d) NaGdF4:Yb,Tm@NaYF4:Yb@NaGdF4:Yb,Nd@NaGdF4 (DRLNT). (e)–(h) High-resolution TEM (HRTEM) images of core and core–shell nanoparticles in (a–d). (i) Scanning transmission electron microscopy (STEM) image of DRLNT. (j–n) Energy dispersive X-ray spectroscopy (EDS) elemental mapping of DRLNT showing the distribution of Gd, Y, Yb and Nd elements in the core–multishell structure. (o–p) High-angle annular dark field (HAADF)-STEM images of DRLNT. | ||
 | ||
| Fig. 2 (a) Near infrared (NIR) luminescence spectra of DRLNT and its intermediates in aqueous solutions. The spectra of CNP and CS1NP were multiplied by 10 and 3 times, respectively. With the inert NaGdF4 shell layer, DRLNT exhibited stronger NIR emission intensities than NaGdF4:Yb,Tm@NaYF4:Yb@NaGdF4:Yb,Nd nanoparticles (CS2NP) with 1.7, 4.6 and 3.1-fold of enhancement at 1215, 1330 and 1470 nm, respectively. (b) Fourier-transform infrared (FTIR) spectra of the as-synthesized hydrophobic DRLNT coated with oleic acid ligands (DRLNT-OA) and the hydrophilic nanoparticles after the modification of DSPE-PEG (DRLNT@PEG). | ||
Moreover, NaGdF4 as the matrix of CNP could lead to the cross-relaxation processes between Tm3+ and Gd3+. In the core of the DRLNT, Gd3+ would have the probability to be excited to the 6P7/2 state through the cross-relaxation with Tm3+ at the 1I6 state activated by five-photon energy transfer, of which the possibility and efficiency were proved by Su and Jin et al.50 Then, Gd3+ can be further excited to a higher energy level (6DJ) through other cross-relaxation processes with Tm3+, such as (6P7/2, 1G4) → (6DJ, 3H4) and (6P7/2, 3F3) → (6DJ, 3H5). To confirm the energy transfer process, the upconversion emission spectrum in the ultraviolet to visible region was measured and it showed that the emissions at 250, 275 and 310 nm generated from 6DJ, 6IJ and 6PJ states of Gd3+ can be identified and their intensities were close to the ultraviolet (1I6 → 3H5 and 1D2 → 3H6) and blue (1D2 → 3F4 and 1G4 → 3H6) upconversion emissions of Tm3+ ions (Fig. S16, ESI†), indicating the efficient energy transfer from 1I6 (Tm3+) to 6PJ (Gd3+). The population of the 6PJ (Gd3+) state promoted the cross relaxation of (6P7/2, 1G4) → (6DJ, 3H4) and (6P7/2, 3F3) → (6DJ, 3H5) between Tm3+ and Gd3+, leading to the increased population of Tm3+ at NIR emissive energy levels (3H4 and 3H5), which was supported by the energy transfer calculation (Fig. S12, ESI†). In contrast, we used NaYF4 as the host and synthesized NaYF4:Yb,Tm@NaYF4:Yb@NaYF4:Yb,Nd@NaYF4 (Y-CS3NP), which had identical diameter and monodispersity compared to the DRLNT (Fig. S2 and S3, ESI†), and collected its NIR luminescence spectrum to make a comparison. If the concentrations of Tm3+ ions, the excitation power density and other experimental conditions were kept the same, the DRLNT with NaGdF4 as the matrix exhibited stronger NIR emission than Y-CS3NP. For example, the intensity of the emission at 1470 nm of the DRLNT had a 188-fold enhancement compared to that of Y-CS3NP (Fig. S8, ESI†). To give a quantitative evaluation of the luminescence efficiency, the absolute quantum yield analysis was carried out in the samples of DRLNT and Y-CS3NP. It showed that the quantum yields (QY%) of the DRLNT emissions at 1215, 1330 and 1470 nm were higher than those of Y-CS3NP (Table S1, ESI†). For the 1470 nm emission, the QY% had a ∼25-fold of difference. Considering that Y3+ did not have matched energy levels to achieve cross-relaxation, the results gave evidence that cross-relaxation enhanced NIR emission happened in the NaGdF4 matrix. Additionally, the ion-ion energy transfer rate of Yb3+ → Nd3+ and Yb3+ → Tm3+ and multiphonon relaxation (MPR) rate of 4F5/2 → 4F3/2 (Nd), and 3F2,3 → 3H4 (Tm) in the DRLNT were 1–2 orders of magnitude stronger than that in Y-CS3NP (Fig. S13 and S14, ESI†). Hence, the cross relaxation, energy transfer and MPR effect in the DRLNT were taken together to explain the 2–3 orders of magnitude higher luminescence intensity than that of Y-CS3NP. It is worth noting that the observation of cross-relaxation between Tm3+ and Gd3+ to enhanced NIR luminescence would be of great significance in developing a highly efficient Tm3+-based NIR-III nanoprobe as the NIR-III emissive energy levels of Tm3+ are usually in low populations so that the emission intensities are not very ideal for bioapplications.
For application in a biological environment, surface modification and aqueous phase transformation of the DRLNT were carried out by using amphiphilic ligand, 1,2-distearoyl-sn-glycero-3-phosphoethanolamine-poly(ethylene glycol) (DSPE-PEG). As shown in the Fourier transform infrared (FTIR) spectra, transmission bands at 3550, 1725, and 1122 cm−1 assigned to N–H, C![[double bond, length as m-dash]](https://www.rsc.org/images/entities/char_e001.gif) O and C–O stretching vibrations appeared after modification, which confirmed the assembling of DSPE-PEG on the surface of the DRLNT (Fig. 2(b)). The DSPE-PEG modified nanoparticles (DRLNT@PEG) can be easily dispersed in aqueous solution. Dynamic light scattering (DLS) data of DRLNT@PEG in deionized water fitted by a log-normal function indicated that the hydrodynamic size was calculated to be 68.5 nm in diameter and the corresponding error was 0.24 (Fig. S5, ESI†).
O and C–O stretching vibrations appeared after modification, which confirmed the assembling of DSPE-PEG on the surface of the DRLNT (Fig. 2(b)). The DSPE-PEG modified nanoparticles (DRLNT@PEG) can be easily dispersed in aqueous solution. Dynamic light scattering (DLS) data of DRLNT@PEG in deionized water fitted by a log-normal function indicated that the hydrodynamic size was calculated to be 68.5 nm in diameter and the corresponding error was 0.24 (Fig. S5, ESI†).
To investigate the temperature response property, the NIR luminescence spectra of the DRLNT aqueous dispersion at a series of temperature points were collected under the excitation of an 808 nm laser. As shown in the NIR-II/III emission spectra of the DRLNT with absolute intensity (Fig. S7, ESI†), the intensity of emissions at 1330 nm and 1470 nm increased with the elevation of temperature, while the emission at 1215 nm had just a slight decrease. To present and evaluate the temperature response of the two probes of the DRLNT intuitively, the emission spectra were normalized at 1215 nm (I1215) and then the intensities of the emissions at 1330 nm (I1330) and 1470 nm (I1470) showed an obvious positive correlation to temperature (Fig. 3(a)). Furthermore, the dependence of the ratio of I1470 to I1215 (I1470/I1215) on the temperature (T) exhibited a linear behaviour in the range of 10 to 90 °C (Fig. 3(b)), which can be described as I1470/I1215 = 0.083 T + 5.269 (T given in °C). Similarly, the ratio of I1330 to I1215 (I1330/I1215) versus temperature (T) can also be well fitted by a linear function, which is I1330/I1215 = 0.119 T + 9.372 (T given in °C) (Fig. 3(c)). Based on the results above, it can be concluded that DRLNT was able to achieve optical temperature sensing by a dual ratiometric approach with one ratiometer taking 1470 nm emission generated from Tm3+ for temperature readout and 1215 nm emission as a reference (denoted as probe-Tm) and another one using 1330 nm emission generated from Nd3+ for readout and 1215 nm emission as a reference (denoted as probe-Nd). Both probe-Tm and probe-Nd presented good relative thermal sensitivity (Fig. 3(d), e.g. 1.07 and 0.92% °C−1 at 30 °C, respectively), which made DRLNT competent for temperature detection with adequate accuracy in biological tissue.
 | ||
| Fig. 3 (a) NIR luminescence spectra of DRLNT@PEG in aqueous dispersion at 10 to 90 °C by external heating. The peaks were normalized at 1215 nm. (b) A plot of I1470/I1215versus T to calibrate one ratiometric thermometer of DRLNT (probe-Tm). Error bars were defined as s.d. (n = 3). (c) A plot of I1330/I1215versus T to calibrate another ratiometric thermometer of DRLNT (probe-Nd). Error bars were defined as s.d. (n = 3). I1470, I1215 and I1330 indicate the 3H5 → 3H6, 3H4 → 3F4 transitions of Tm3+ and 4F3/2 → 4I13/2 transition of Nd3+, respectively. (d) Relative thermal sensitivity (Sr) of probe-Tm and probe-Nd (I1470/I1215 and I1330/I1215 as ratios, respectively). The temperature range is from 10 to 90 °C. Error bars were defined as s.d. (n = 3). | ||
Mechanism of the temperature response of the DRLNT
The phenomenon of temperature-responsive NIR luminescence of the DRLNT prompted us to further explore the mechanism. Generally, temperature-dependent ion–ion energy transfer (including cross-relaxation, CR) and multiphonon relaxation were likely to explain the temperature response behaviour. The calculations of energy transfer and MPR rates were carried out to explain the intensity change of the NIR emissions with temperature (see ESI† for detailed calculation processes). For the 1215 nm emission of Tm3+, based on the calculation, the MPR rate of the 3H5 → 3F4 (Tm) process increased with temperature leading to the reduced populations of the 3H5 energy level, while the small portion of promoted cross relaxation (1G4, 3H6) → (3H4, 3H5) would lead to an increase of the emission intensity (Fig. S12, ESI†), thus resulting in a slight decrease in 1215 nm emission with increasing temperature. For the 1470 nm emission, the CR in Tm3+ ions resulting from the rich energy levels of Tm3+ and CR between Tm3+ and Gd3+ may increase upon heating.52,53 For example, Tm3+ at the 1D2 and 1G4 states would interact with Tm3+ at the 3H6 state through two processes, (1D2, 3H6) → (3F2,3, 3F2,3) (denoted as CR1) and (1G4, 3H6) → (3H4, 3H5) (denoted as CR2) (Fig. 4(a)). Tm3+ at the 3F2,3 state would then relax to the 3H4 state with the help of non-radiative transition. As a result, both CR1 and CR2 boosted the 3H4 state distribution for enhancing 1470 nm emission. Meanwhile, the CR processes between Tm3+ and Gd3+, (6P7/2, 1G4) → (6DJ, 3H4), would also enhance the 1470 nm emission. According to the calculations, the elevation of temperature promoted the rates of cross relaxations between Tm3+ and Gd3+ as well as CR1 and CR2 in Tm3+ ions (Fig. S12 and S13, ESI†). The enhanced CR would correspondingly suppress the upconversion processes of Tm3+. As shown in the upconversion luminescence spectra of the DRLNT collected under different temperatures, the emissions at 450, 475 and 645 nm corresponding to the transitions (1D2 → 3F4), (1G4 → 3H6) and (1G4 → 3F4) are inversely proportional to temperature (Fig. 4(c)). It should be noted that the depopulations of the 1D2 and 1G4 states via temperature increased MPR were hardly possible because the energy gaps from the 1D2 and 1G4 states to their next lower levels, namely 1D2 → 1G4 and 1G4 → 3F2,3, respectively, are quite large (∼6600 cm−1 for 1D2 → 1G4, of which the phonon order is 19; 6100 cm−1 for 1G4 → 3F2,3 of which the phonon order is 17.).54 The MPR rates of 1D2 → 1G4 and 1G4 → 3F2,3 were in the magnitude of 10−4 s−1 as calculated (Fig. S15, ESI†), indicating that these processes were negligible. Additionally, the rates of phonon-assisted energy transfer from Yb3+ to Tm3+ (2F5/2 (Yb3+) → 3H4 (Tm3+)) were also positively related to temperature based on calculations (Fig. S12, ESI†), which was another factor for the population of the 3H4 state augmenting 1470 emission.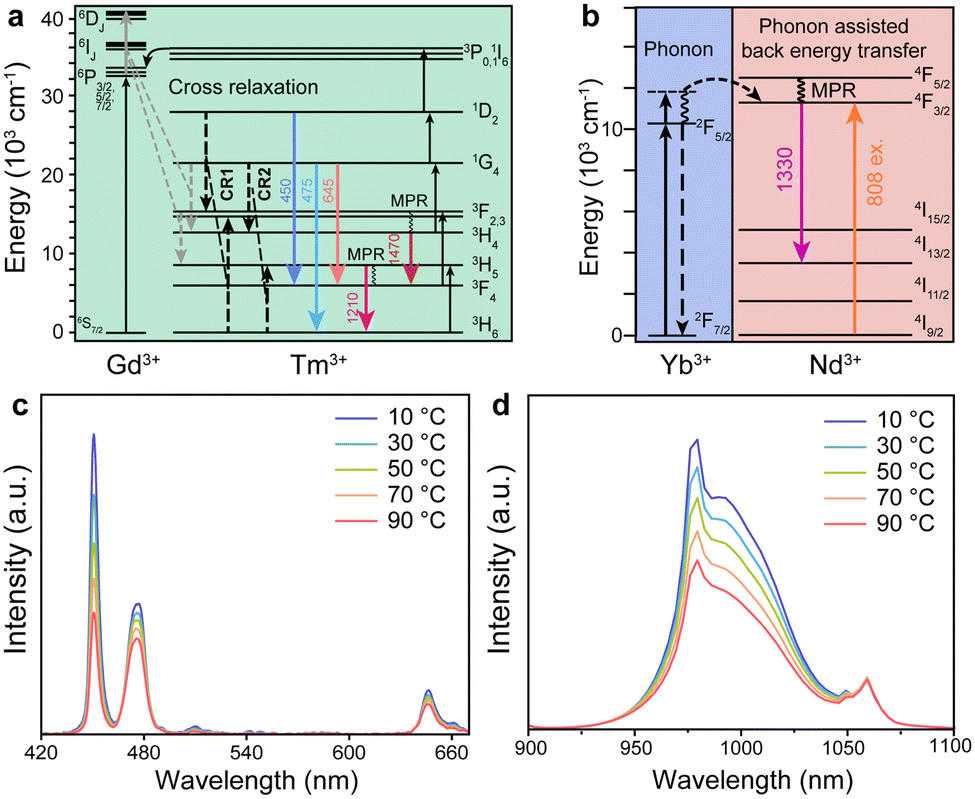 | ||
| Fig. 4 (a) Proposed mechanism of the temperature response of probe-Tm. (b) Proposed mechanism of the temperature response of probe-Nd. (c) Upconversion emission spectra and (d) NIR emissions generated from Yb3+ and Nd3+ in DRLNT at different temperatures under 808 nm excitation. | ||
Meanwhile, the power-dependent NIR emission intensity profiles of the DRLNT showed a slight increase in the slopes at a higher temperature. For example, the ones measured from 1470 nm emission changed from 0.84 at 30 °C to 0.89 at 70 °C, which might indicate that the cross relaxations and phonon relaxation processes (3F2,3 → 3H4, 3H5 → 3F4) had improvements upon temperature elevation. The slopes of logarithmic 1470 nm emission intensity to logarithmic power were all below 1 under 808 nm excitation at different temperatures (Fig. S9, ESI†). Considering that an 808 nm light source was used to excite the DRLNT, some excitation photons can also be directly absorbed by Tm3+ ions since the energy gap of 3H6 → 3H4 transition fits well with photon energy.55 Hence, Tm3+ ions can be excited by the direct 3H4 → 3F4 transition and also Yb3+/Tm3+ energy transfer, which gave rise to an overall power-dependent slope below 1. To prove the direct absorption of 808 nm photons by Tm3+, NaGdF4:Yb,Tm@NaYF4:Yb@NaGdF4:Yb@NaGdF4 nanoparticles without Nd3+ doping were prepared and the power-dependent emission intensity profiles were measured by 808 nm excitation based on the emission at 1470 nm (Fig. S11, ESI†). It showed that the 1470 nm emission can be excited by 808 nm light and the power-dependent slope was 0.72, which was below 1, indicating the existence of the one-photon process. On the other hand, if DRLNT was excited by 980 nm, the power dependent slope was larger than 1, indicating that two-photon processes happened during the NIR radiative transition (Fig. S10, ESI†).
For 1330 nm emission from Nd3+, the temperature response may be attributed to the increasing rate of Nd3+ ← Yb3+ back energy transfer, 4F3/2 (Nd3+) ← 2F5/2 (Yb3+), which was also observed by other groups30 (Fig. 4(b)). Based on our calculation, the elevation of temperature promoted a phonon-assisted process which complemented the gap between 2F5/2 (Yb3+) and 4F3/2 (Nd3+), therefore resulting in the increased rate of energy transfer from Yb3+ to Nd3+ (Fig. S12 and S14, ESI†). The contribution of temperature-induced Nd3+ ← Yb3+ back energy transfer would reduce the net intensity of Yb3+ emission, which was confirmed by the NIR luminescence results that the emission at 975 nm of the DRLNT attributed to the 2F5/2 → 2F7/2 transition in Yb3+ decreased (Fig. 4(d)). The intensity of 1060 nm emission originated from 4F3/2 → 4I11/2 barely changed with the temperature because the increasing rate of MPR of Nd3+ (4I13/2 → 4I11/2) (Fig. S12, ESI†) and thermal quenching effect upon temperature elevation reduced the emission intensity, so the increment of intensity induced by the Nd3+ ← Yb3+ back energy transfer was offset.56 The slopes of logarithmic 1330 nm emission intensity to logarithmic power also increased a little with temperature from 0.86 at 30 °C to 0.97 at 70 °C, which might indicate the gradual saturation of the 4F3/2 energy level and Nd3+ ← Yb3+ back transfer (Fig. S9, ESI†).
Temperature monitoring in vivo by the DRLNT
The biocompatibility of DRLNT was studied both in vitro and in vivo. Firstly, the methyl thiazolyl tetrazolium assay was carried out to evaluate the cytotoxicity of DRLNT@PEG in a biological system. As illustrated by Fig. S20 (ESI†), the DRLNT did not show an obvious toxic effect under the incubating dosage up to 400 μg mL−1 where the cell viability remained above ∼86%. Next, the hematoxylin and eosin (H&E)-staining analysis of the main organs (heart, liver, spleen, lung and kidney) of a mouse injected with the DRLNT 30 days after intravenous injection showed that, compared to the control mouse without DRLNT injection, no noticeable abnormality or damage of the mouse's organs was observed by the injection of the DRLNT, implying that the administration of DRLNT@PEG into the mouse model would not induce significant toxicity to living animals (Fig. S21, ESI†). To evaluate the tissue penetration performance of NIR-II/III emission generated from the DRLNT, an aqueous dispersion of the DRLNT was covered by tissue slices with different thicknesses and the optical signals were collected in the bioimaging system. As shown in Fig. S6 (ESI†), a majority of the emission intensity (>70%) of the DRLNT remained under the tissue depth similar to the mouse inflammation model (0.2 mm). It is worth noting that the optical signals can still be detected, and a signal to noise ratio of 2.47 was achieved, which was enough for bioimaging and temperature measurement, even when the thickness of the tissue reached 3 mm.57 To investigate the correlation between temperature and NIR emission intensity in the biological environment, DRLNT@PEG was dispersed in phantom mimicking biological tissue and the NIR luminescence signals were collected under a series of temperatures to obtain the calibration curve for in vivo temperature sensing (Fig. S17, ESI†).As indicated in recent studies, some factors such as the excitation power density, and the extinction coefficient of tissue components, have important effects on the accuracy of temperature readings of ratiometric luminescent nanothermometers.4,24,58,59 To ensure the temperature reading reliability of the DRLNT, those factors were investigated in detail in our work. The emission ratios of I1330/I1215 and I1470/I1215 that were used for temperature sensing in probe-Nd and probe-Tm, respectively, were monitored under different excitation power at the same temperature. It was found that the ratios of NIR-II/III emissions did not change with the excitation power density, therefore excluding the artefact induced by excitation (Fig. S18, ESI†). Moreover, the extinction coefficients of the tissue mimicking phantom for acquiring the temperature calibration curve of the DRLNT in vivo matched well with the one measured from the skin of the mouse paw in the range from 1200 to 1500 nm (Fig. S19, ESI†), which confirmed the feasibility of using phantom to obtain the temperature calibration for in vivo measurement. Detailed correction of the calibration was based on the reported method59 and shown in the ESI.† The luminescence spectra normalized at 1215 nm indicated that the emissions at 1330 and 1470 nm rose with temperature as observed in the aqueous solution (Fig. 6(a)). The calibration curves of probe-Tm and probe-Nd were determined as I1470/I1215 = 0.047 T + 3.099 and I1330/I1215 = 0.050 T + 3.517 (T given in °C) (Fig. 6(b) and (c)). The sensitivity of the two ratiometric probes was illustrated in Fig. 6(d) with typical values of 1.06 and 0.99% °C−1 at 30 °C, respectively. The repeatability (Rp) and uncertainty (δT) are also crucial for the accurate temperature reading.24,58 Detailed calculation processes of Rp and δT are given in the ESI.† The Rp of temperature detection using DRLNT was characterized by measuring the changes of emission ratios in cold-hot cycles (e.g. 10 and 70 °C, Fig. 5(a) and (b)). It showed that the best Rp value of the DRLNT in cold-hot cycles was 98.2% (probe-Tm) and 98.8% (probe Nd), respectively, which ensured the good reliability of the DRLNT for temperature sensing. The standard deviation of multiple measurements (60 times) at certain temperature points (e.g. 40 °C, Fig. 5(c) and (d)) was also evaluated, of which the value was 0.73% for probe-Tm and 0.79% for probe-Nd, indicating the high precision of the reading result of the DRLNT. Additionally, the uncertainty (δT) value can be calculated as 0.30 °C for probe-Tm and 0.31 °C for probe-Nd at 30 °C (Table S2, ESI†), indicating that the DRLNT had a decent accuracy of detection for in vivo temperature sensing. Considering that the Tm-probe had a better performance in thermal sensitivity, it was used to carry out the demonstration of imaging-based temperature detection in living bodies. It is known that the inflammation would cause temperature elevation in the lesion,60 so an inflammation model in a Balb/c mouse was established to validate the feasibility of using the DRLNT for temperature monitoring in vivo with biomedical purposes. Carrageenan dissolved in saline was administrated to the right hind paw of the mouse to induce acute inflammation and the left hind paw was injected with saline as a control.61 The DRLNT dispersed in saline (10 mg mL−1, 20 μl) was then administrated to both paws. As shown in Fig. 6(e), the temperature imaging given by probe-Tm of the DRLNT indicated the elevation of the temperature on the right paw with the average temperature value of 39.6 °C and the left paw exhibited an average temperature of 37.1 °C, which proved that the DRLNT was able to detect and visualize the temperature in a living body for disease diagnosis and physiological process monitoring.
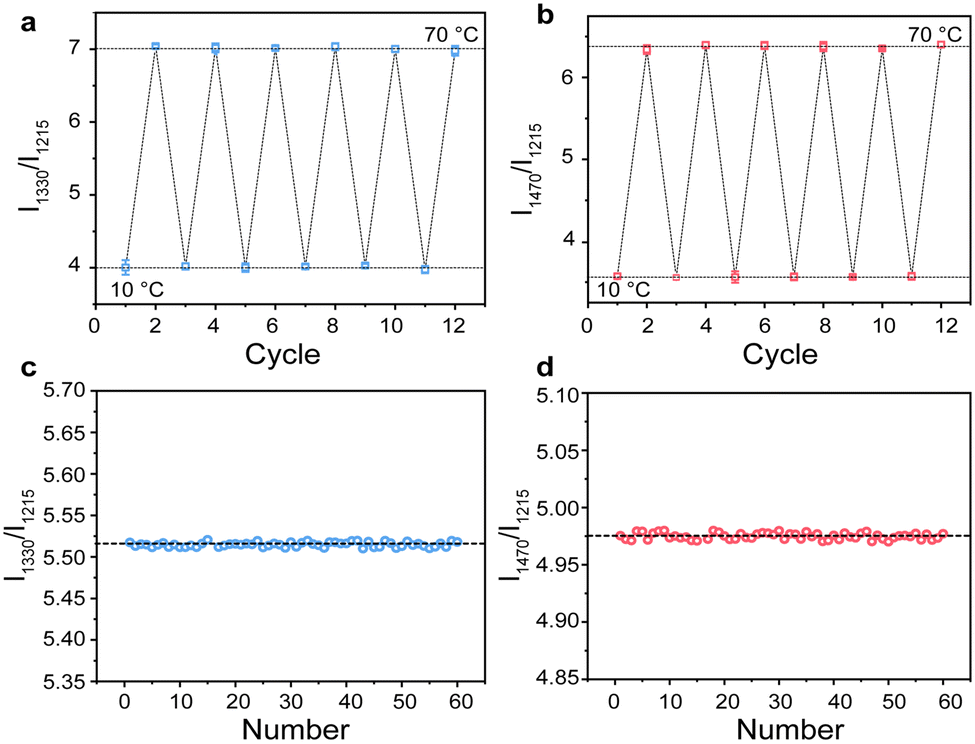 | ||
| Fig. 5 Temperature reading repeatability of (a) probe-Nd and (b) probe-Tm in the DRLNT under cold-hot cycles (10 to 70 °C). The emission ratios of I1330/I1215 and I1470/I1215 used by probe-Nd and probe-Tm, respectively, were recorded in each cycle. Multiple measurements (60 times) at 40 °C using (c) probe-Nd and (d) probe-Tm in the DRLNT. The emission ratios of I1330/I1215 and I1470/I1215 used by probe-Nd and probe-Tm, respectively, were recorded for the calculation of the standard deviations. The average value of the emission ratio was labelled by a dashed line. | ||
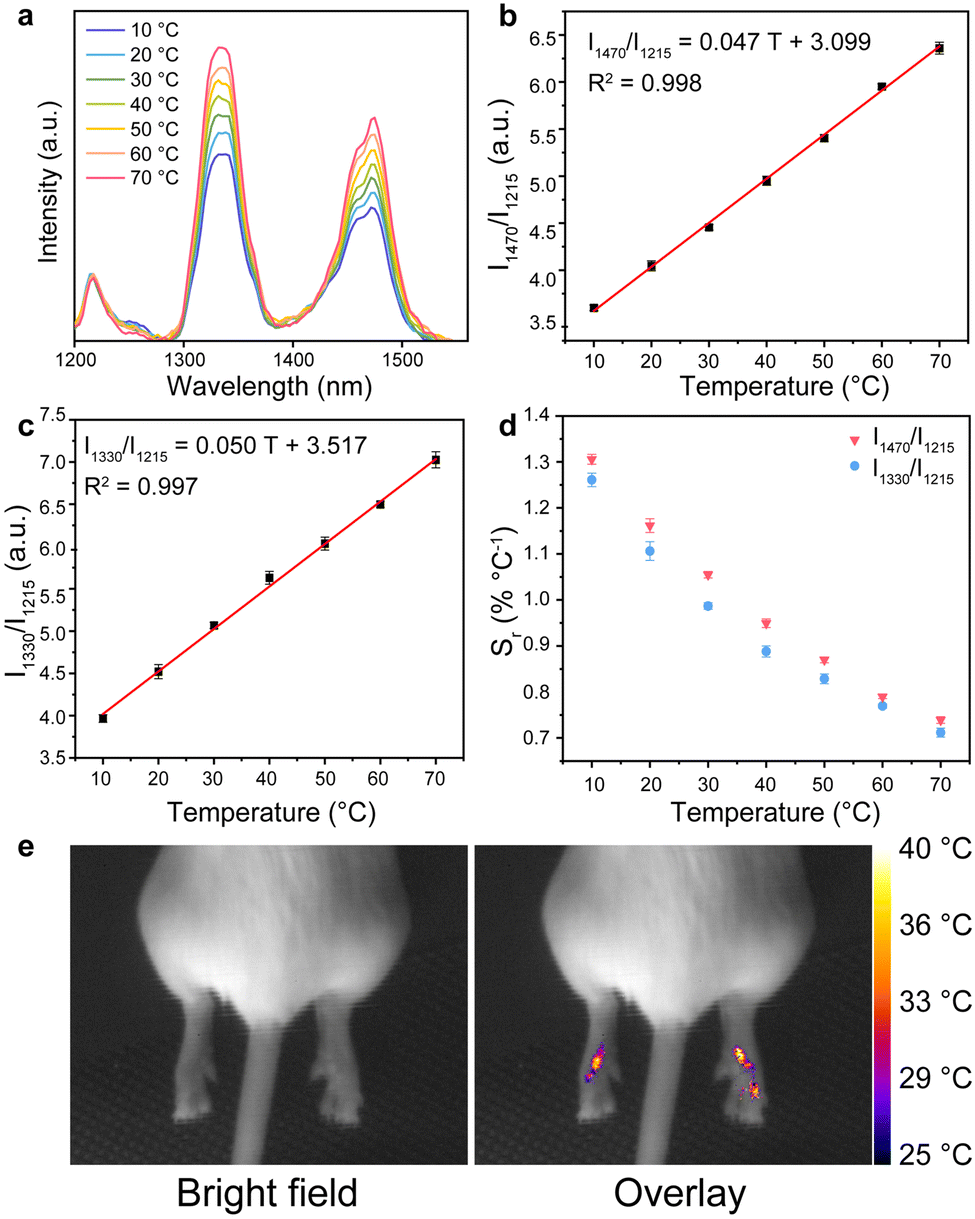 | ||
| Fig. 6 (a) NIR luminescence spectra of DRLNT@PEG in tissue phantom at 10 to 70 °C by external heating. The peaks were normalized at 1215 nm. (b) A plot of I1470/I1215versus T to calibrate probe-Tm. Error bars were defined as s.d. (n = 3). (c) A plot of I1330/I1215versus T to calibrate probe-Nd. Error bars were defined as s.d. (n = 3). (d) Relative thermal sensitivity (Sr) of probe-Tm and probe-Nd. The temperature range is from 10 to 90 °C. Error bars were defined as s.d. (n = 3). (e) The demonstration of in vivo temperature imaging using the probe-Tm of the DRLNT in a mouse inflammation model. The right hind paw was injected with carrageenan to induce inflammation. The left paw was injected with saline as a control. | ||
Conclusions
In conclusion, we have demonstrated a lanthanide-doped NIR-II/III emissive nanocomposite, NaGdF4:Yb,Tm@NaYF4:Yb@NaGdF4:Yb,Nd@NaGdF4, as a dual ratiometric luminescence nanothermometer (DRLNT) for temperature imaging in the living body. The 1215 nm emission generated from Tm3+ ions is used as a reference and the emissions at 1330 and 1470 nm, which are produced by Nd3+ and Tm3+ ions, respectively, are employed as working wavelengths so that two ratiometric temperature probes (namely probe-Tm and probe-Nd) can be established in one system. By utilizing the cross-relaxation processes among lanthanide ions (Gd3+ and Tm3+ ions), the NIR-II emissions of Tm3+ ions were significantly enhanced (e.g. ∼25 folds of quantum yield enhancement compared to the counterpart without cross-relaxation effect). We further investigated the temperature detection capability of the DRLNT and demonstrated its application of NIR-II/III bioimaging-based temperature measurement in a mouse inflammation model. The nanothermometer presented in this work not only serves as a candidate for temperature detection in vivo. Since the temperature response units of the two ratiometric temperature probes lie in different layers of the nanocomposite, in which the distance between probe-Tm and probe-Nd is about 8 nm, the DRLNT is thus hoped to be used as a powerful tool to study nanoscale heat conduction processes, providing high spatial resolution. The emission enhancement strategy using cross-relaxation improved the in vivo performance of the nanothermometer in this work. It also provides an insight into the optimization of the NIR luminescence of lanthanide luminescent materials, which can inspire the development of lanthanide nanoprobes with efficient luminescence for bioimaging, biosensing and other biomedical applications.Author contributions
Q. H., N. K. F. L. and X. Z. conceived the project, analyzed the data, and wrote the original manuscript. F. L. and X. Z. supervised the project and acquired the financial support. Q. H., N. K., Y. C., Z. X., Y. W., J. Z. and X. Z. performed the experiments, designed the methodology and established the model for study. All authors contributed to the review and editing of the manuscript.Conflicts of interest
There are no conflicts to declare.Acknowledgements
The authors thank the funding of the National Natural Science Foundation of China (82001945), the Shanghai Pujiang Program (20PJ1410700), and the starting grant of ShanghaiTech University. The authors thank the Centre for High-resolution Electron Microscopy (CℏEM), School of Physical Science and Technology, ShanghaiTech University (No. EM02161943) for the characterization support. The authors thank Prof. Jianfeng Li for the help with the characterizations.Notes and references
- G. Kucsko, P. C. Maurer, N. Y. Yao, M. Kubo, H. J. Noh, P. K. Lo, H. Park and M. D. Lukin, Nature, 2013, 500, 54–58 CrossRef CAS PubMed.
- S. S. Laha, A. R. Naik, E. R. Kuhn, M. Alvarez, A. Sujkowski, R. J. Wessells and B. P. Jena, Nano Lett., 2017, 17, 1262–1268 CrossRef CAS PubMed.
- E. C. Ximendes, U. Rocha, B. del Rosal, A. Vaquero, F. Sanz-Rodríguez, L. Monge, F. Ren, F. Vetrone, D. Ma, J. García-Solé, C. Jacinto, D. Jaque and N. Fernández, Adv. Healthcare Mater., 2017, 6, 1601195 CrossRef PubMed.
- A. Bednarkiewicz, L. Marciniak, L. D. Carlos and D. Jaque, Nanoscale, 2020, 12, 14405–14421 RSC.
- X. Zhu, W. Feng, J. Chang, Y. W. Tan, J. Li, M. Chen, Y. Sun and F. Li, Nat. Commun., 2016, 7, 10437 CrossRef CAS PubMed.
- H. Zhou, M. Sharma, O. Berezin, D. Zuckerman and M. Y. Berezin, ChemPhysChem, 2016, 17, 27–36 CrossRef CAS PubMed.
- M. Dewhirst, P. R. Stauffer, S. Das, O. I. Craciunescu and Z. Vujaskovic, in Clinical Radiation Oncology, ed. L. L. Gunderson and J. E. Tepper, Elsevier, Philadelphia, 4th edn, 2016, pp. 381–398 Search PubMed.
- J. Zhou, B. Del Rosal, D. Jaque, S. Uchiyama and D. Jin, Nat. Methods, 2020, 17, 967–980 CrossRef CAS PubMed.
- J. Zhong, W. Liu, L. Jiang, M. Yang and P. C. Morais, Rev. Sci. Instrum., 2014, 85, 094905 CrossRef PubMed.
- J. Kim, W. Choi, E.-Y. Park, Y. Kang, K. J. Lee, H. H. Kim, W. J. Kim and C. Kim, IEEE Trans. Biomed. Eng., 2019, 66, 3330–3338 Search PubMed.
- D. Jaque, B. D. Rosal, E. M. Rodríguez, L. M. Maestro, P. Haro-González and J. G. Solé, Nanomedicine, 2014, 9, 1047–1062 CrossRef CAS PubMed.
- H. Li, X. Wang, T. Y. Ohulchanskyy and G. Chen, Adv. Mater., 2021, 33, 2000678 CrossRef CAS PubMed.
- Y. Fan and F. Zhang, Adv. Opt. Mater., 2019, 7, 1801417 CrossRef.
- J.-C. G. Bünzli, Chem. Rev., 2010, 110, 2729–2755 CrossRef PubMed.
- Y. Yang, D. Tu, Y. Zhang, P. Zhang and X. Chen, iScience, 2021, 24, 102062 CrossRef CAS PubMed.
- Z. Yi, Z. Luo, X. Qin, Q. Chen and X. Liu, Acc. Chem. Res., 2020, 53, 2692–2704 CrossRef CAS PubMed.
- M. Kong, Y. Gu, Y. Chai, J. Ke, Y. Liu, X. Xu, Z. Li, W. Feng and F. Li, Sci. China: Chem., 2021, 64, 974–984 CrossRef CAS.
- X. Qiu, Q. Zhou, X. Zhu, Z. Wu, W. Feng and F. Li, Nat. Commun., 2020, 11, 4 CrossRef CAS PubMed.
- S. Yu, J. Xu, X. Shang, W. Zheng, P. Huang, R. Li, D. Tu and X. Chen, Adv. Sci., 2020, 7, 2001589 CrossRef CAS PubMed.
- A. Bednarkiewicz, J. Drabik, K. Trejgis, D. Jaque, E. Ximendes and L. Marciniak, Appl. Phys. Rev., 2021, 8, 011317 CAS.
- C. D. S. Brites, S. Balabhadra and L. D. Carlos, Adv. Opt. Mater., 2019, 7, 1801239 CrossRef.
- N. Kong, Q. Hu, Y. Wu and X. Zhu, Chem. – Eur. J., 2022, 18, e202104237 Search PubMed.
- M. Runowski, S. Goderski, D. Przybylska, T. Grzyb, S. Lis and I. R. Martín, ACS Appl. Nano Mater., 2020, 3, 6406–6415 CrossRef CAS.
- L. Labrador-Paez, M. Pedroni, A. Speghini, J. Garcia-Sole, P. Haro-Gonzalez and D. Jaque, Nanoscale, 2018, 10, 22319–22328 RSC.
- M. Sojka, M. Runowski, T. Zheng, A. Shyichuk, D. Kulesza, E. Zych and S. Lis, J. Mater. Chem. C, 2022, 10, 1220–1227 RSC.
- F. Vetrone, R. Naccache, A. Zamarrón, A. Juarranz de la Fuente, F. Sanz-Rodríguez, L. Martinez Maestro, E. Martin Rodriguez, D. Jaque, J. Garcia Sole and J. A. Capobianco, ACS Nano, 2010, 4, 3254–3258 CrossRef CAS PubMed.
- X. Zhu, J. Li, X. Qiu, Y. Liu, W. Feng and F. Li, Nat. Commun., 2018, 9, 2176 CrossRef PubMed.
- A. Nexha, J. J. Carvajal, M. C. Pujol, F. Díaz and M. Aguiló, J. Mater. Chem. C, 2020, 8, 180–191 RSC.
- C. D. Brites, S. Balabhadra and L. D. Carlos, Adv. Opt. Mater., 2019, 7, 1801239 CrossRef.
- E. C. Ximendes, W. Q. Santos, U. Rocha, U. K. Kagola, F. Sanz-Rodríguez, N. Fernández, A. d S. Gouveia-Neto, D. Bravo, A. M. Domingo, B. del Rosal, C. D. S. Brites, L. D. Carlos, D. Jaque and C. Jacinto, Nano Lett., 2016, 16, 1695–1703 CrossRef CAS PubMed.
- L. Marciniak, K. Prorok, L. Frances-Soriano, J. Perez-Prieto and A. Bednarkiewicz, Nanoscale, 2016, 8, 5037–5042 RSC.
- S. Sekiyama, M. Umezawa, S. Kuraoka, T. Ube, M. Kamimura and K. Soga, Sci. Rep., 2018, 8, 16979 CrossRef PubMed.
- E. N. Ceron, D. H. Ortgies, B. Del Rosal, F. Ren, A. Benayas, F. Vetrone, D. Ma, F. Sanz-Rodriguez, J. G. Sole, D. Jaque and E. M. Rodriguez, Adv. Mater., 2015, 27, 4781–4787 CrossRef CAS PubMed.
- M. Tan, F. Li, N. Cao, H. Li, X. Wang, C. Zhang, D. Jaque and G. Chen, Small, 2020, 16, 2004118 CrossRef CAS PubMed.
- L. Wortmann, S. Suyari, T. Ube, M. Kamimura and K. Soga, J. Lumin., 2018, 198, 236–242 CrossRef CAS.
- A. Skripka, A. Benayas, R. Marin, P. Canton, E. Hemmer and F. Vetrone, Nanoscale, 2017, 9, 3079–3085 RSC.
- Y. Liu, X. Zhu, Z. Wei, W. Feng, L. Li, L. Ma, F. Li and J. Zhou, Adv. Mater., 2021, 33, 2008615 CrossRef CAS PubMed.
- Y. Zhong and H. Dai, Nano Res., 2020, 13, 1281–1294 CrossRef CAS PubMed.
- L.-Y. Huang, S. Zhu, R. Cui and M. Zhang, Anal. Chem., 2020, 92, 535–542 CrossRef CAS PubMed.
- S. Diao, J. L. Blackburn, G. Hong, A. L. Antaris, J. Chang, J. Z. Wu, B. Zhang, K. Cheng, C. J. Kuo and H. Dai, Angew. Chem., Int. Ed., 2015, 54, 14758–14762 CrossRef CAS PubMed.
- A. Nexha, J. J. Carvajal, M. C. Pujol, F. Díaz and M. Aguiló, Nanoscale, 2021, 13, 7913 RSC.
- C. Hazra, A. Skripka, S. J. L. Ribeiro and F. Vetrone, Adv. Opt. Mater., 2020, 8, 2001178 CrossRef CAS.
- C. Matuszewska, K. Elzbieciak-Piecka and L. Marciniak, J. Phys. Chem. C, 2019, 123, 18646 CrossRef CAS.
- S. Balabhadra, M. L. Debasu, C. D. S. Brites, J. Rocha and L. D. Carlos, J. Lumin., 2016, 180, 25 CrossRef CAS.
- E. C. Ximendes, A. F. Pereira, U. Rocha, W. F. Silva, D. Jaque and C. Jacinto, Nanoscale, 2019, 11, 8864–8869 RSC.
- E. C. Ximendes, U. Rocha, T. O. Sales, N. Fernández, F. Sanz-Rodríguez, I. R. Martín, C. Jacinto and D. Jaque, Adv. Funct. Mater., 2017, 27, 1702249 CrossRef.
- M. Runowski, A. Bartkowiak, M. Majewska, I. R. Martín and S. Lis, J. Lumin., 2018, 201, 104–109 CrossRef CAS.
- J. A. Carr, M. Aellen, D. Franke, P. T. C. So, O. T. Bruns and M. G. Bawendi, Proc. Natl. Acad. Sci. U. S. A., 2018, 115, 9080–9085 CrossRef CAS PubMed.
- H. Zhang, Y. Fan, P. Pei, C. Sun, L. Lu and F. Zhang, Angew. Chem., Int. Ed., 2019, 58, 10153–10157 CrossRef CAS PubMed.
- Q. Su, H.-L. Wei, Y. Liu, C. Chen, M. Guan, S. Wang, Y. Su, H. Wang, Z. Chen and D. Jin, Nat. Commun., 2021, 12, 4367 CrossRef CAS PubMed.
- Y. Zhong, G. Tian, Z. Gu, Y. Yang, L. Gu, Y. Zhao, Y. Ma and J. Yao, Adv. Mater., 2014, 26, 2831–2837 CrossRef CAS PubMed.
- L. J. Richardson, C. E. Bonner Jr, J. Lewis, G. B. Loutts, W. J. Rodriguez and B. M. Walsh, J. Lumin., 2004, 109, 129 CrossRef CAS.
- M. Xu, D. Chen, P. Huang, Z. Wan, Y. Zhou and Z. Ji, J. Mater. Chem. C, 2016, 4, 6516–6524 RSC.
- D. Gao, D. Tian, B. Chong, L. Li and X. Zhang, J. Alloys Compd., 2016, 678, 212–218 CrossRef CAS.
- O. A. Savchuk, J. J. Carvajal, P. Haro-Gonzalez, M. Aguiló and F. Díaz, J. Alloys Compd., 2018, 746, 710–719 CrossRef CAS.
- D. Chen, Y. Liang, S. Miao, J. Bi and K. Sun, J. Lumin., 2021, 234, 117967 CrossRef CAS.
- Y. Fan, S. Wang and F. Zhang, Angew. Chem., Int. Ed., 2019, 58, 13208 CrossRef CAS PubMed.
- M. Jia, Z. Sun, H. Xu, X. Jin, Z. Lv, T. Sheng and Z. Fu, J. Mater. Chem. C, 2020, 8, 15603 RSC.
- B. del Rosal, E. Ximendes, U. Rocha and D. Jaque, Adv. Opt. Mater., 2017, 5, 1600508 CrossRef.
- S. S. Evans, E. A. Repasky and D. T. Fisher, Nat. Rev. Immunol., 2015, 15, 335–349 CrossRef CAS PubMed.
- R. Vinegar, J. F. Truax, J. L. Selph, P. R. Johnston, A. L. Venable and K. K. McKenzie, Fed. Proc., 1987, 46, 118–126 CAS.
Footnote |
| † Electronic supplementary information (ESI) available: Materials and methods, characterizations of the nanocomposites, cytotoxicity, setup for temperature measurement, luminescence intensity of DRLNT under different excitation powers and H&E staining. See DOI: https://doi.org/10.1039/d2nh00283c |
| This journal is © The Royal Society of Chemistry 2022 |