
 Open Access Article
 This Open Access Article is licensed under a Creative Commons Attribution-Non Commercial 3.0 Unported Licence
Electrodiffusioosmosis induced negative differential resistance in micro-to-millimeter size pores through a graphene/copper membrane†
Sharad Kumar
Yadav
abc,
D.
Manikandan
b,
Chob
Singh
b,
Mukesh
Kumar
b,
Vishal V. R.
Nandigana
 ac and
Pramoda K.
Nayak
*bcd
ac and
Pramoda K.
Nayak
*bcd
aDepartment of Mechanical Engineering, Indian Institute of Technology Madras, Chennai 600036, India
bDepartment of Physics, Indian Institute of Technology Madras, Chennai 600036, India. E-mail: pnayak@iitm.ac.in
cMicro Nano and Bio-Fluidics Group, Indian Institute of Technology Madras, Chennai-600036, India
d2D Materials Research and Innovation Group, Indian Institute of Technology Madras, Chennai-600036, India
First published on 10th October 2022
Abstract
Negative differential resistance (NDR) is one of the nonlinear transport phenomena in which ionic current decreases with the increase in electromotive potential. Electro-osmosis, diffusio-osmosis, and surface charge density of pores are the driving forces for observing NDR in nanoscale ion transport. Here, we report electrodiffusioosmosis induced NDR using micro to millimeter size pores in a two-dimensional (2D) graphene-coated copper (Gr/Cu) membrane. Along with NDR, we also observed ion current rectification (ICR), in which there is preferential one-directional ion flow for equal and opposite potentials. The experimentally observed NDR effect has been validated by performing ion transport simulations using Poisson–Nernst–Planck (PNP) equations and Navier–Stokes equations with the help of COMSOL Multiphysics considering salinity gradient across the membrane. Charge polarization induced electro-osmotic flow (EOF) dominates over diffusio-osmosis, causing the backflow of low concentration/conductivity solution into the pore, thereby causing NDR. This finding paves the way toward potential applications in ionic tunnel diodes as rectifiers, switches, amplifiers, and biosensors.
1. Introduction
Ionic transport through nanopores has created huge interest in various fields, including biosensing,1–3 bioelectrogenesis,4 osmotic energy generation,5–8 and nano-fluidics.1,2,8–14 The recent advancement of 2D membranes provides a unique platform for understanding the novel transport phenomena under confinement and the versatile surface chemistry of these membranes.11 Three major electrokinetic driving forces such as electric field, mechanical pressure and concentration gradient govern ionic transport in a confined geometry.11 Moreover, the transport properties are also affected by surface characteristics of the membrane and pore size and geometry.15 A pore with finite surface charges induces electrokinetic phenomena, such as electroosmosis and streaming potential.13,14 Even the small changes in the surface charge density lead to nonlinear current–voltage (I–V) characteristics, including ICR and NDR.16ICR is an electrical phenomenon where the cation and anion transport occur unevenly through tiny channels. Therefore, the ion current in one direction is either greater or smaller than in the other direction. ICR has attracted much attention in nanopore devices as the ions are transported preferentially in one direction. To generate ICR using a large pore dimension (i.e., highly charged pores of nano,17 meso,16,18–23 and micro24–28 scale diameter), there should be conductivity15,26 and viscosity24 difference of the bulk electrolyte solution placed on both sides of the membrane. In the case of nanopores, the overlapped electric double layer,13,14,17 and in the case of meso (few 100 s of nm) and sub-micron pores, the EOF is the root of the ICR mechanism.16,20 The parameters responsible for ICR are the pore dimension,26 surface charge density,17,20,21 ionic solution composition (monovalent or multivalent ions),27,29 concentration gradient,30,31 and external forces (pressure or temperature).11,18,32,33
NDR is also known as negative incremental resistance,27 in which there is a reduction in current as the applied potential difference increases. There are several conditions required to observe NDR, which include (a) viscosity22 and concentration23 gradient with external pressure, (b) high voltage12,25 or low current and low concentration levels, and (c) presence of multivalent ions in electrolyte solution.27,29,34 In addition, in the absence of multivalent ions or pressure force, the nonlinear electrokinetic flow may induce NDR.16 The combined effect of electroosmosis, diffusio-osmosis, and surface charge density of the pore is responsible for the NDR effect in any of the prior mentioned four conditions.
As the size of the nanopore is extremely tiny (less than 100 nm), nanopore ion transport shows application constraints (i.e. restricted to nanofluids). Typically, fluids have nano, meso, and micro size particles, which may cause clogging of nanopores resulting in frequent replacement and error-prone analysis of nanopores.35,36 The other big challenge is nanopore fabrication, which requires sophisticated facilities like transmission electron microscope drilling,37 electrochemical reactions,30,31,38 focused ion beam39,40 in addition to an industry-graded cleanroom facility.10,30,35–37 On the other hand, the mesopore and micropore fabrication is comparatively less complex, economically viable, and has a wide range of applications.16,18,20,24–26
In the present work, we report the NDR effect in micro to millimeter-scale diameter pores for the first time using asymmetric solutions (i.e., concentration gradient). This result is different from the prior reported work on NDR due to pressure force, multivalent ions, or pH variation. To understand the mechanism of NDR in large diameter pores, we have performed the ion transport simulations using PNP equations and Navier–Stokes equations with the help of COMSOL Multiphysics. It is observed that charge polarization induced EOF dominates over diffusio-osmosis causing the backflow of low concentration/conductivity solution into the pore, which leads to the NDR effect. The observed NDR in larger pores paves the way toward potential applications in ionic tunnel diodes as rectifiers, switches, amplifiers, and biosensors.
2. Experimental section
The commercially available Gr/Cu membrane was procured from Graphenea, where one layer of graphene is coated on a Cu film of 18 μm thick. Femtosecond laser (fs) micromachining (SATSUMA HP2, Amplitude System, France) was used for pore fabrication on the Gr/Cu membrane (10 mm × 10 mm dimension). The fs micromachining technique offers a one-step, rapid etching, and non-masking advantages41 over other conventional pore fabrication techniques like photochemical42 and reactive ion etching.43 The single pore (SP) and multiple pores (MP) of diameters 500 μm, 1 mm, and 2 mm were fabricated on the Gr/Cu membrane, where MP is attributed to four number of pores. The separation between the pores is the same as their corresponding diameters in the case of MP. The laser parameters used for the above pore fabrication include pulse repetition rate (50 kHz), laser spot size (121 μm), pulse energy (22 μJ), and scan speed (10 mm s−1). The pore fabrication time was varied based on the pore size and the number of pores. These membranes were placed across solutions of different concentrations to study ion transport behavior.The KCl powder (molecular weight 74.55 g m−1) was procured from Thermo Fisher Scientific India Pvt. Ltd and different concentrations of the solution were prepared by adding DI water. To get a 100-fold concentration gradient (∇C = 100), 10 liter solutions of 0.6 M and 6 mM KCl were prepared. DI water was mixed with 447.3 g and 0.45 g KCl (till the total volume reached 10 liters) for 0.6 M and 6 mM KCl, respectively. Similarly, the 1000-fold concentration gradient (∇C = 1000) was prepared using 0.6 M and 0.6 mM KCl and the 10![[thin space (1/6-em)]](https://www.rsc.org/images/entities/char_2009.gif) 000-fold concentration gradient (∇C = 10000) was prepared using 1 M and 0.1 mM KCl. Monovalent KCl was used for the experiment as the hydration size and the mobility of K+ and Cl− ions are nearly the same.44
000-fold concentration gradient (∇C = 10000) was prepared using 1 M and 0.1 mM KCl. Monovalent KCl was used for the experiment as the hydration size and the mobility of K+ and Cl− ions are nearly the same.44
The schematic experimental setup for the ion-transport measurement is shown in Fig. 1. The Gr/Cu membrane is sandwiched between the two silicone O-rings, similar to our previous work.45 The source and measurement unit (SMU-Tektronix 2460) is to source the potential and sense (measure) the corresponding voltage through the Ag/AgCl electrodes (Fig. S1†). The additional membrane potential measurement is performed using a digital multimeter (DMM-Tektronix 6500) which is connected to the membrane and lower concentration side Ag/AgCl electrode, as shown in Fig. S1.†
 | ||
| Fig. 1 (a) Schematic of the experimental setup used for the I–V measurement. The higher concentration (in the left reservoir) and lower concentration (in the right reservoir) solutions are separated by the membrane sandwiched between the O-rings at the junction of the two reservoirs. The source and measurement unit is used to source the potential and sense (measure) the corresponding voltage through the Ag/AgCl electrodes. | ||
3. Results and discussion
Fig. 2 shows the I–V characteristics of ion transport through 500 μm, 1 mm, and 2 mm (SP and MP) diameter pores in the Gr/Cu membrane measured at three concentration gradients, ∇C = 100, ∇C = 1000, and ∇C = 10000. It can be observed that the variation of current at V > 0 (first quadrant) is not equal to that of current at V < 0 (third quadrant) and the current rectifies at V < 0, which is the characteristic of ICR. For V > 0, there is a voltage range where the current drops with the increase in voltage, which is the characteristic of NDR. In order to see the effect of graphene, the I–V measurement was performed using only the Cu membrane. The Cu membrane with 1 mm single pore diameter demonstrates a linear resistive behavior, as shown in Fig. 3a. I–V characteristics were also determined using an insulating silicone membrane (SM) of 2 mm thick with 1 mm pore diameter without the Gr/Cu membrane and surprisingly no NDR characteristic is observed (Fig. 3b). Hence, the Gr/Cu membrane plays a role in the demonstration of ICR and NDR phenomena. In the present work, the three pore sizes (diameter) of 500 μm, 1 mm, and 2 mm are selected due to the following reasons:
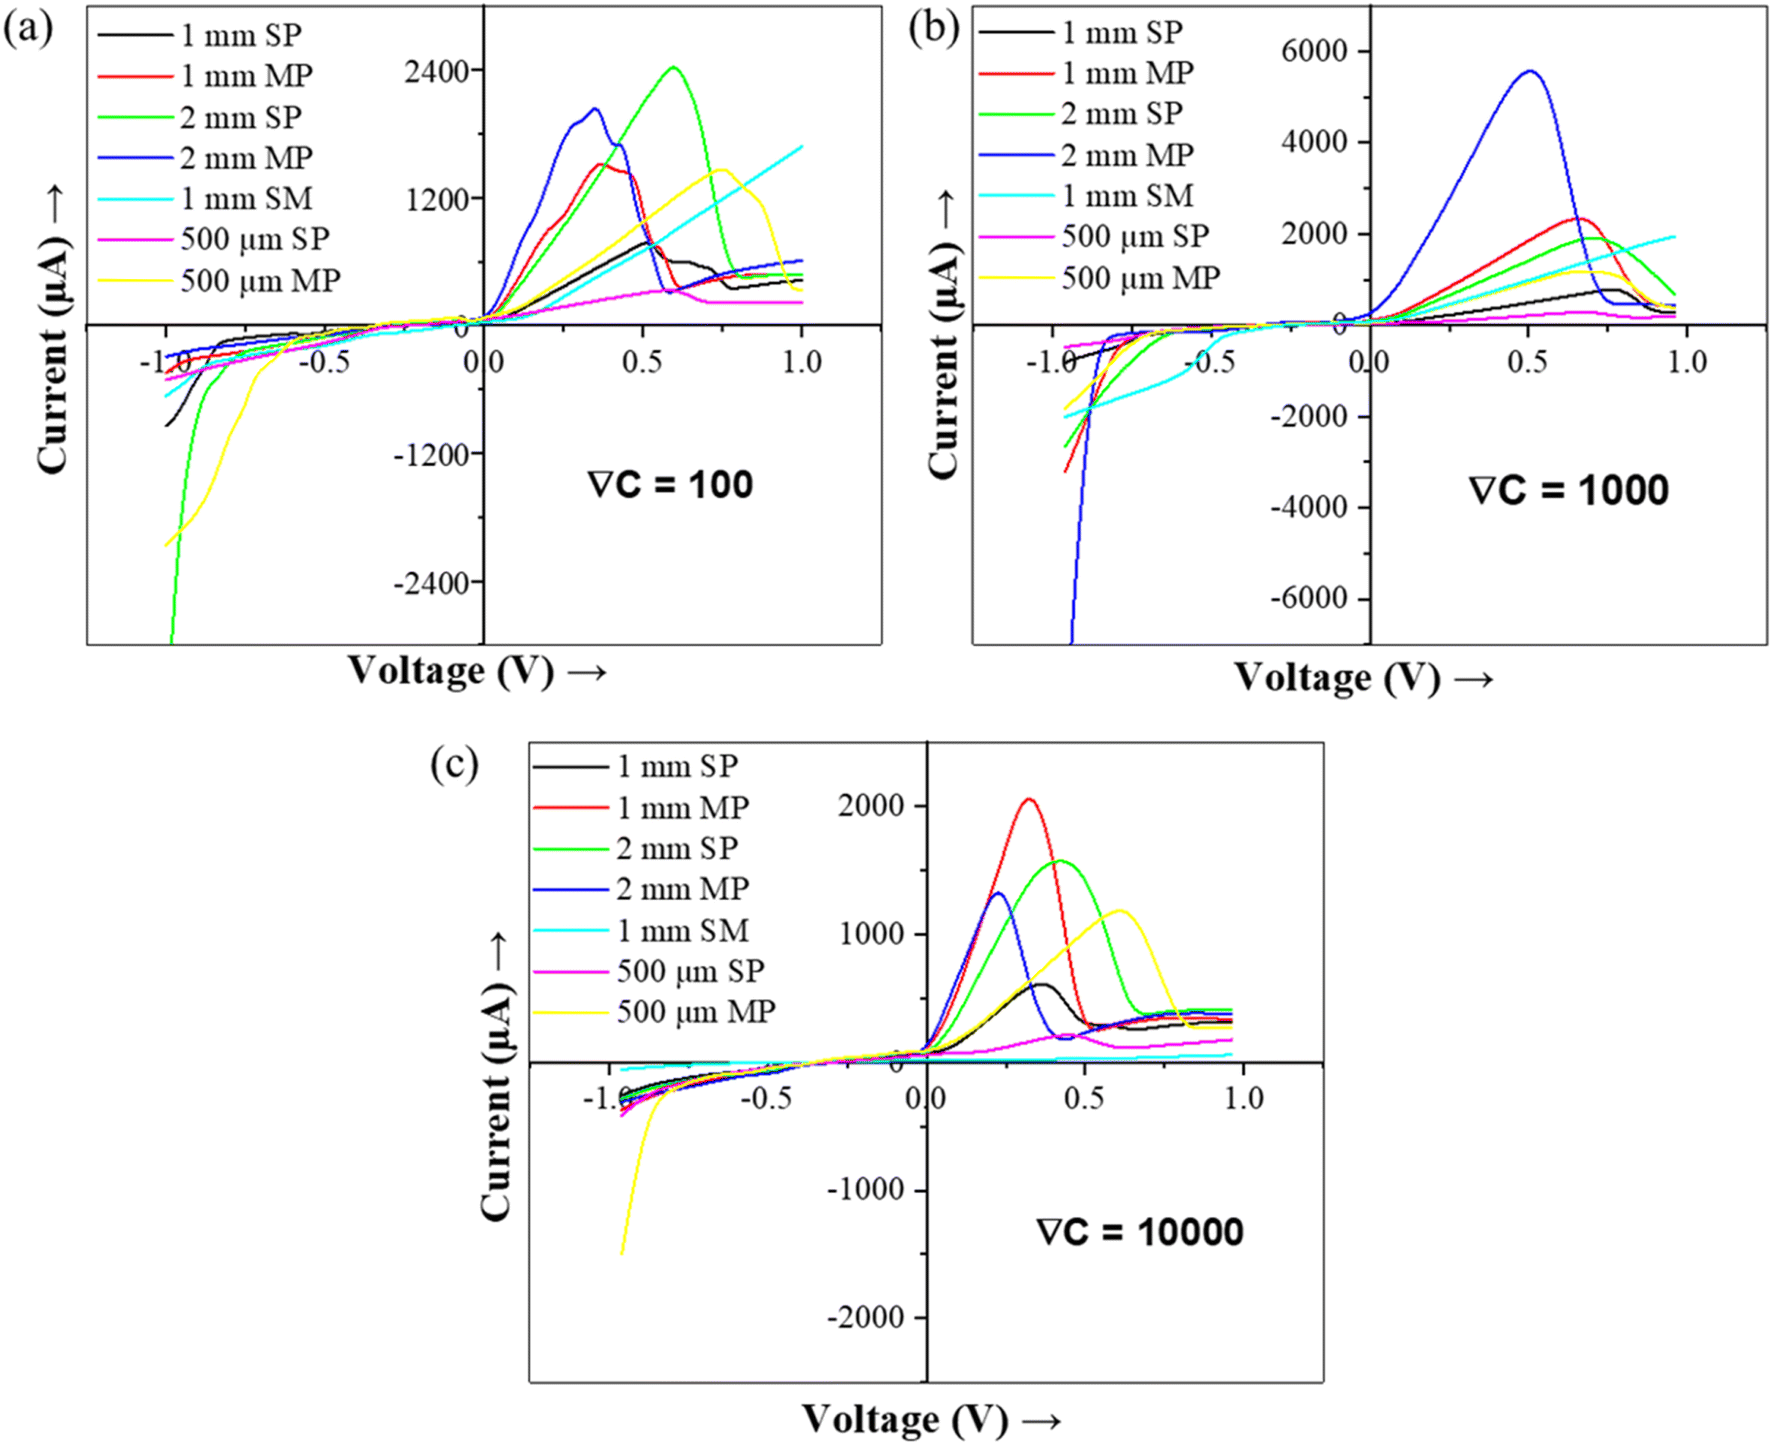 | ||
| Fig. 2 The I–V plots of ion transport through different pores at three concentration gradients of (a) ∇C = 100, (b) ∇C = 1000, and (c) ∇C = 10000. The black, red, green, blue, cyan, magenta, and yellow color line curves represent the pore diameter of 1 mm SP, 1 mm MP, 2 mm SP, 2 mm MP, 1 mm SM, 500 μm SP and 500 μm MP, respectively. SP, MP, and SM correspond to single pore, multiple pores, and the silicone membrane, respectively. | ||
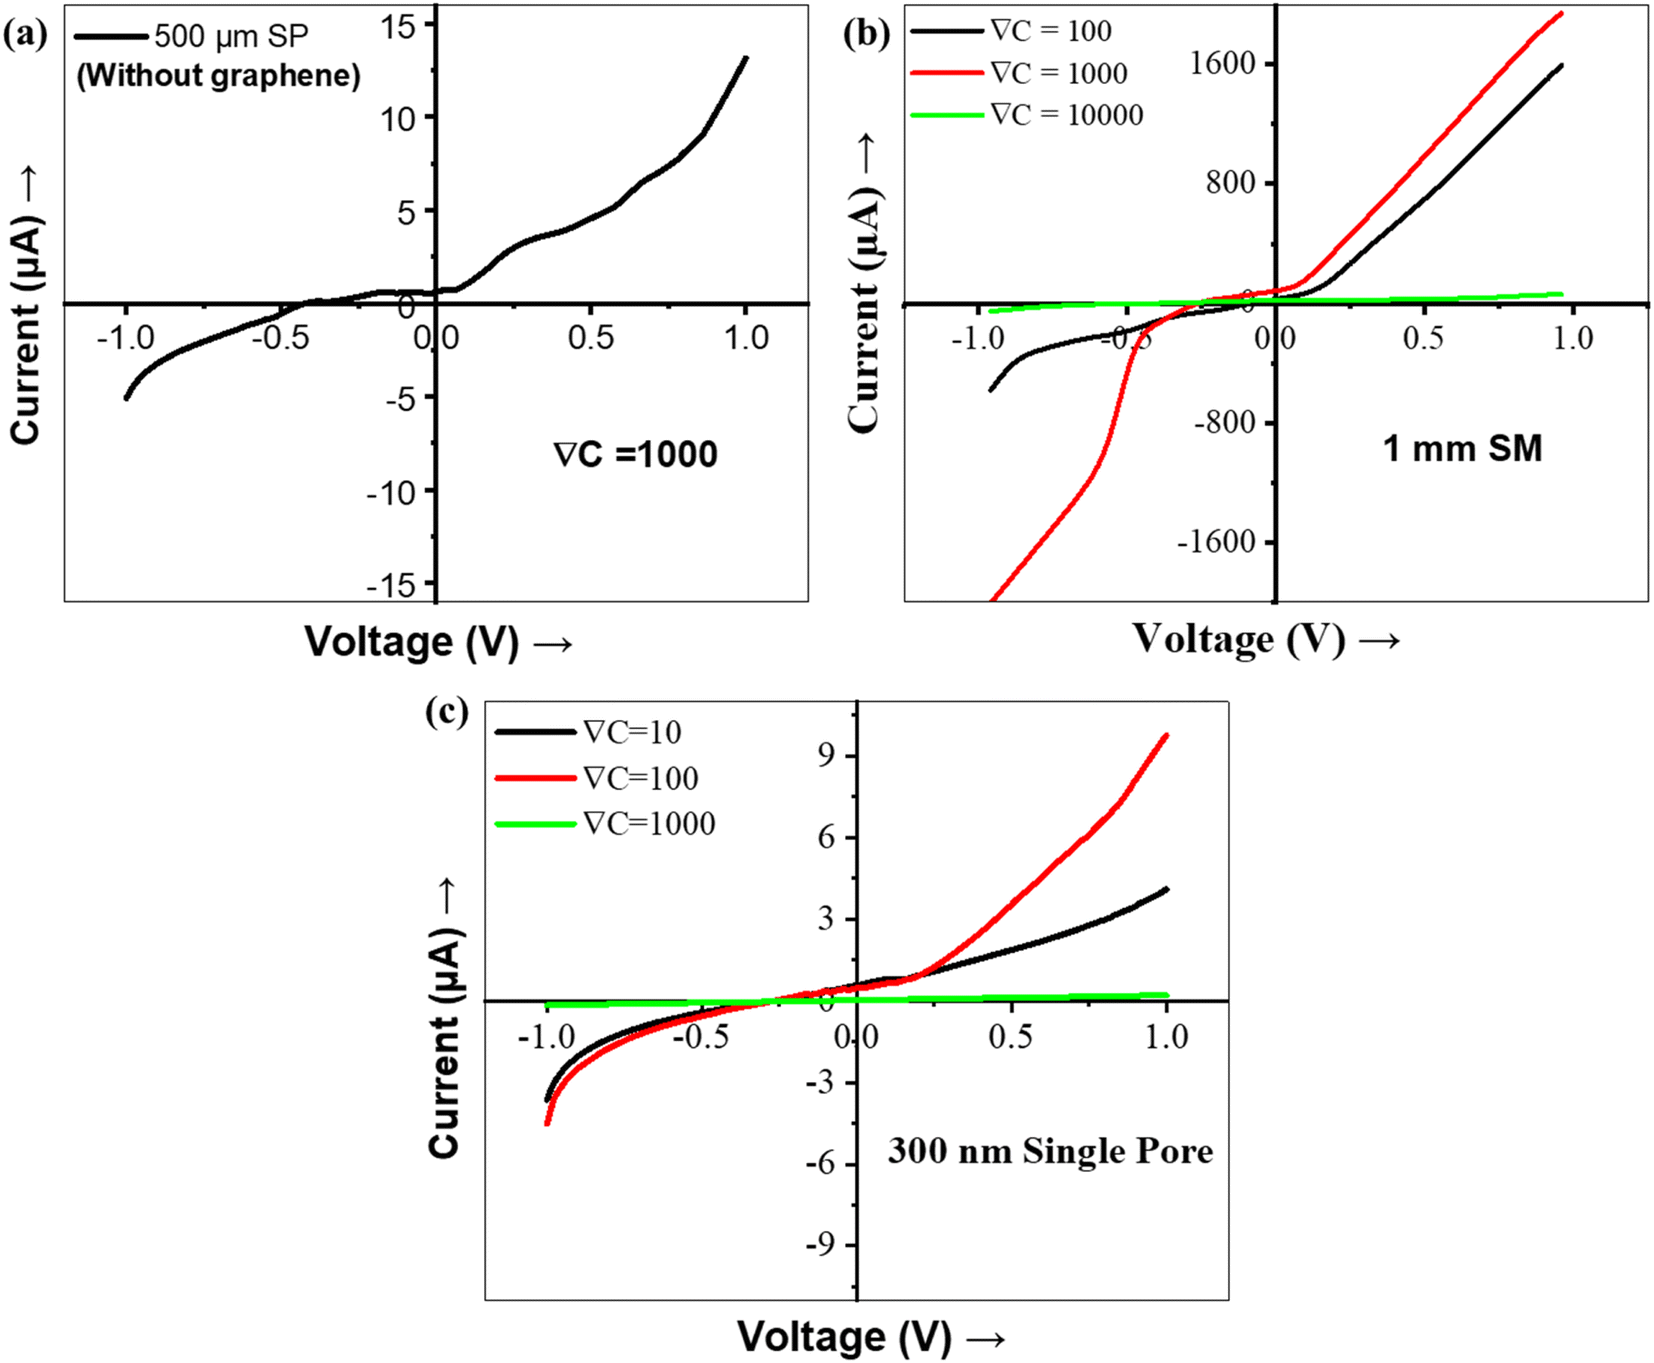 | ||
| Fig. 3 The I–V plots of the ion transport through the (a) 500 μm SP copper membrane without graphene, (b) 1 mm SM at three concentration gradients, i.e. ∇C = 100 (black), ∇C = 1000 (red) and ∇C = 10000 (green), and (c) 300 nm SP at three concentration gradients, i.e. ∇C = 10 (black), ∇C = 100 (red) and ∇C = 1000 (green). SP stands for single pore and SM stands for the silicone membrane. | ||
(a) when the diameter of the pore ≪ length of the pore (i.e., the thickness of Cu, 18 μm), we didn't observe the NDR behavior, as shown in Fig. 3c.
(b) when the pore's diameter ≫ length of the pore, NDR behavior was observed, as shown in Fig. 2.
The study is restricted up to 2 mm diameter pores only because it is hard to control the rapid mixing of two concentrations above this limit. Moreover, to go beyond the 2 mm diameter, there is a need to optimize the diffusion cell size and design.
The I–V characteristics of ion transport through different pores (in the range of 500 μm to 2 mm) are shown in Fig. 2a for ∇C = 100. The current varies nonlinearly for V > 0 whereas rectifies for V < 0. It is expected that the applied potential across the membrane causes the EOF and depending on the EOF direction, either high concentration or low concentration electrolyte enters into the pore of the membrane. When the high concentration solution (i.e. the high conducting solution) enters the pore, the current increases (V > 0), and when the low concentration solution (i.e. the low conducting solution) enters the pore, the current rectifies (for V < 0). Hence, EOF is responsible for the observed ICR behaviors in such larger pores (far larger than the EDL length).26,28 This trend is also found to be consistent for large concentration gradients i.e. at ∇C = 1000 (Fig. 2b) and at ∇C = 10000 (Fig. 2c).
Prior to this work, Yusko et al. showed ICR behavior in various porous channels of diameters 10 nm to 2 μm using asymmetry in solution viscosity and presented that the ICR can also be observed at microscale dimensions which are far large than the electrical double layer (EDL) length.26 X. He and co-workers reported ICR characteristics in a larger pore diameter (10 μm) channel using symmetry in solution and proposed a three-layer model to explain the ionic current behavior for positive and negative potentials as the charge layer (contains counter ions), EDL (contains ions in the diffusive layer), and bulk layer (contains the bulk electrolyte ions unaffected by surface electrostatic field) and showed that ICR occurs when the charged layer becomes comparable to the bulk layer regardless of EDL overlap.28
Fig. 2 shows a nonlinear variation in current for V > 0 in the first quadrant whereas in a certain range of voltages, the NDR behavior (current reduces with the increase in voltage) can be seen. To understand the NDR effect, the experiments are performed with the 1 mm SM (which is insulating in nature) and the 500 μm SP copper membrane (without graphene) of the same dimension as the Gr/Cu membrane. The I–V plot for both membranes didn't show any NDR behavior (Fig. 3), making it evident that the NDR is a combined effect of conducting copper and graphene membranes. The membrane potential variation is recorded during the experiment (Fig. S2†), showing that the membrane potential varies with the variation in bias potential. This variation is expected as the membrane gets polarized to maintain zero electric fields inside the copper sheet.46 With the introduction of graphene on the copper membrane, the graphene (with negative surface charge density) introduces an additional fixed negative surface charge on the membrane, which causes a negative surface charge density on the membrane. The diffusion-dominated flow occurs at a lower potential due to the concentration gradient. However, at a higher potential, the Gr/Cu membrane polarized and causes the EOF (which forms a vortex pattern21 at the pore) near the lower concentration (low conducting) solution, causing the backflow of this low conducting solution into the pore, which results in a reduction in current with an increase in potential known as NDR. This phenomenon is also explained by simulation using COMSOL Multiphysics described further in the Computational method section. It is worth noting here that graphene provides resistance to copper oxidation47 and there are no copper ions in the solution (DI water & KCl) implying that the half-reaction of copper deposition is impossible.
The ICR and NDR phenomena become more prominent in larger pores and MP than in smaller pores and SP (Fig. 2 and 4). The larger pore and MP allow higher ionic flux than the smaller diameter pore and SP.30 The peak current (Ip) is defined as the maximum current value just before the NDR behavior starts and the peak voltage (Vp) is the corresponding voltage at Ip. The Ip value rises with an increase in the pore diameter (Fig. S2†) as well as the number of pores (Fig. 4). The Ip for 500 μm MP nearly extrapolates to the corresponding SP at all three-concentrations gradients whereas, in the case of 1 mm and 2 mm MP, the SP result is not able to extrapolate the Ip primarily due to ion concentration polarization domination30 (Table 1).
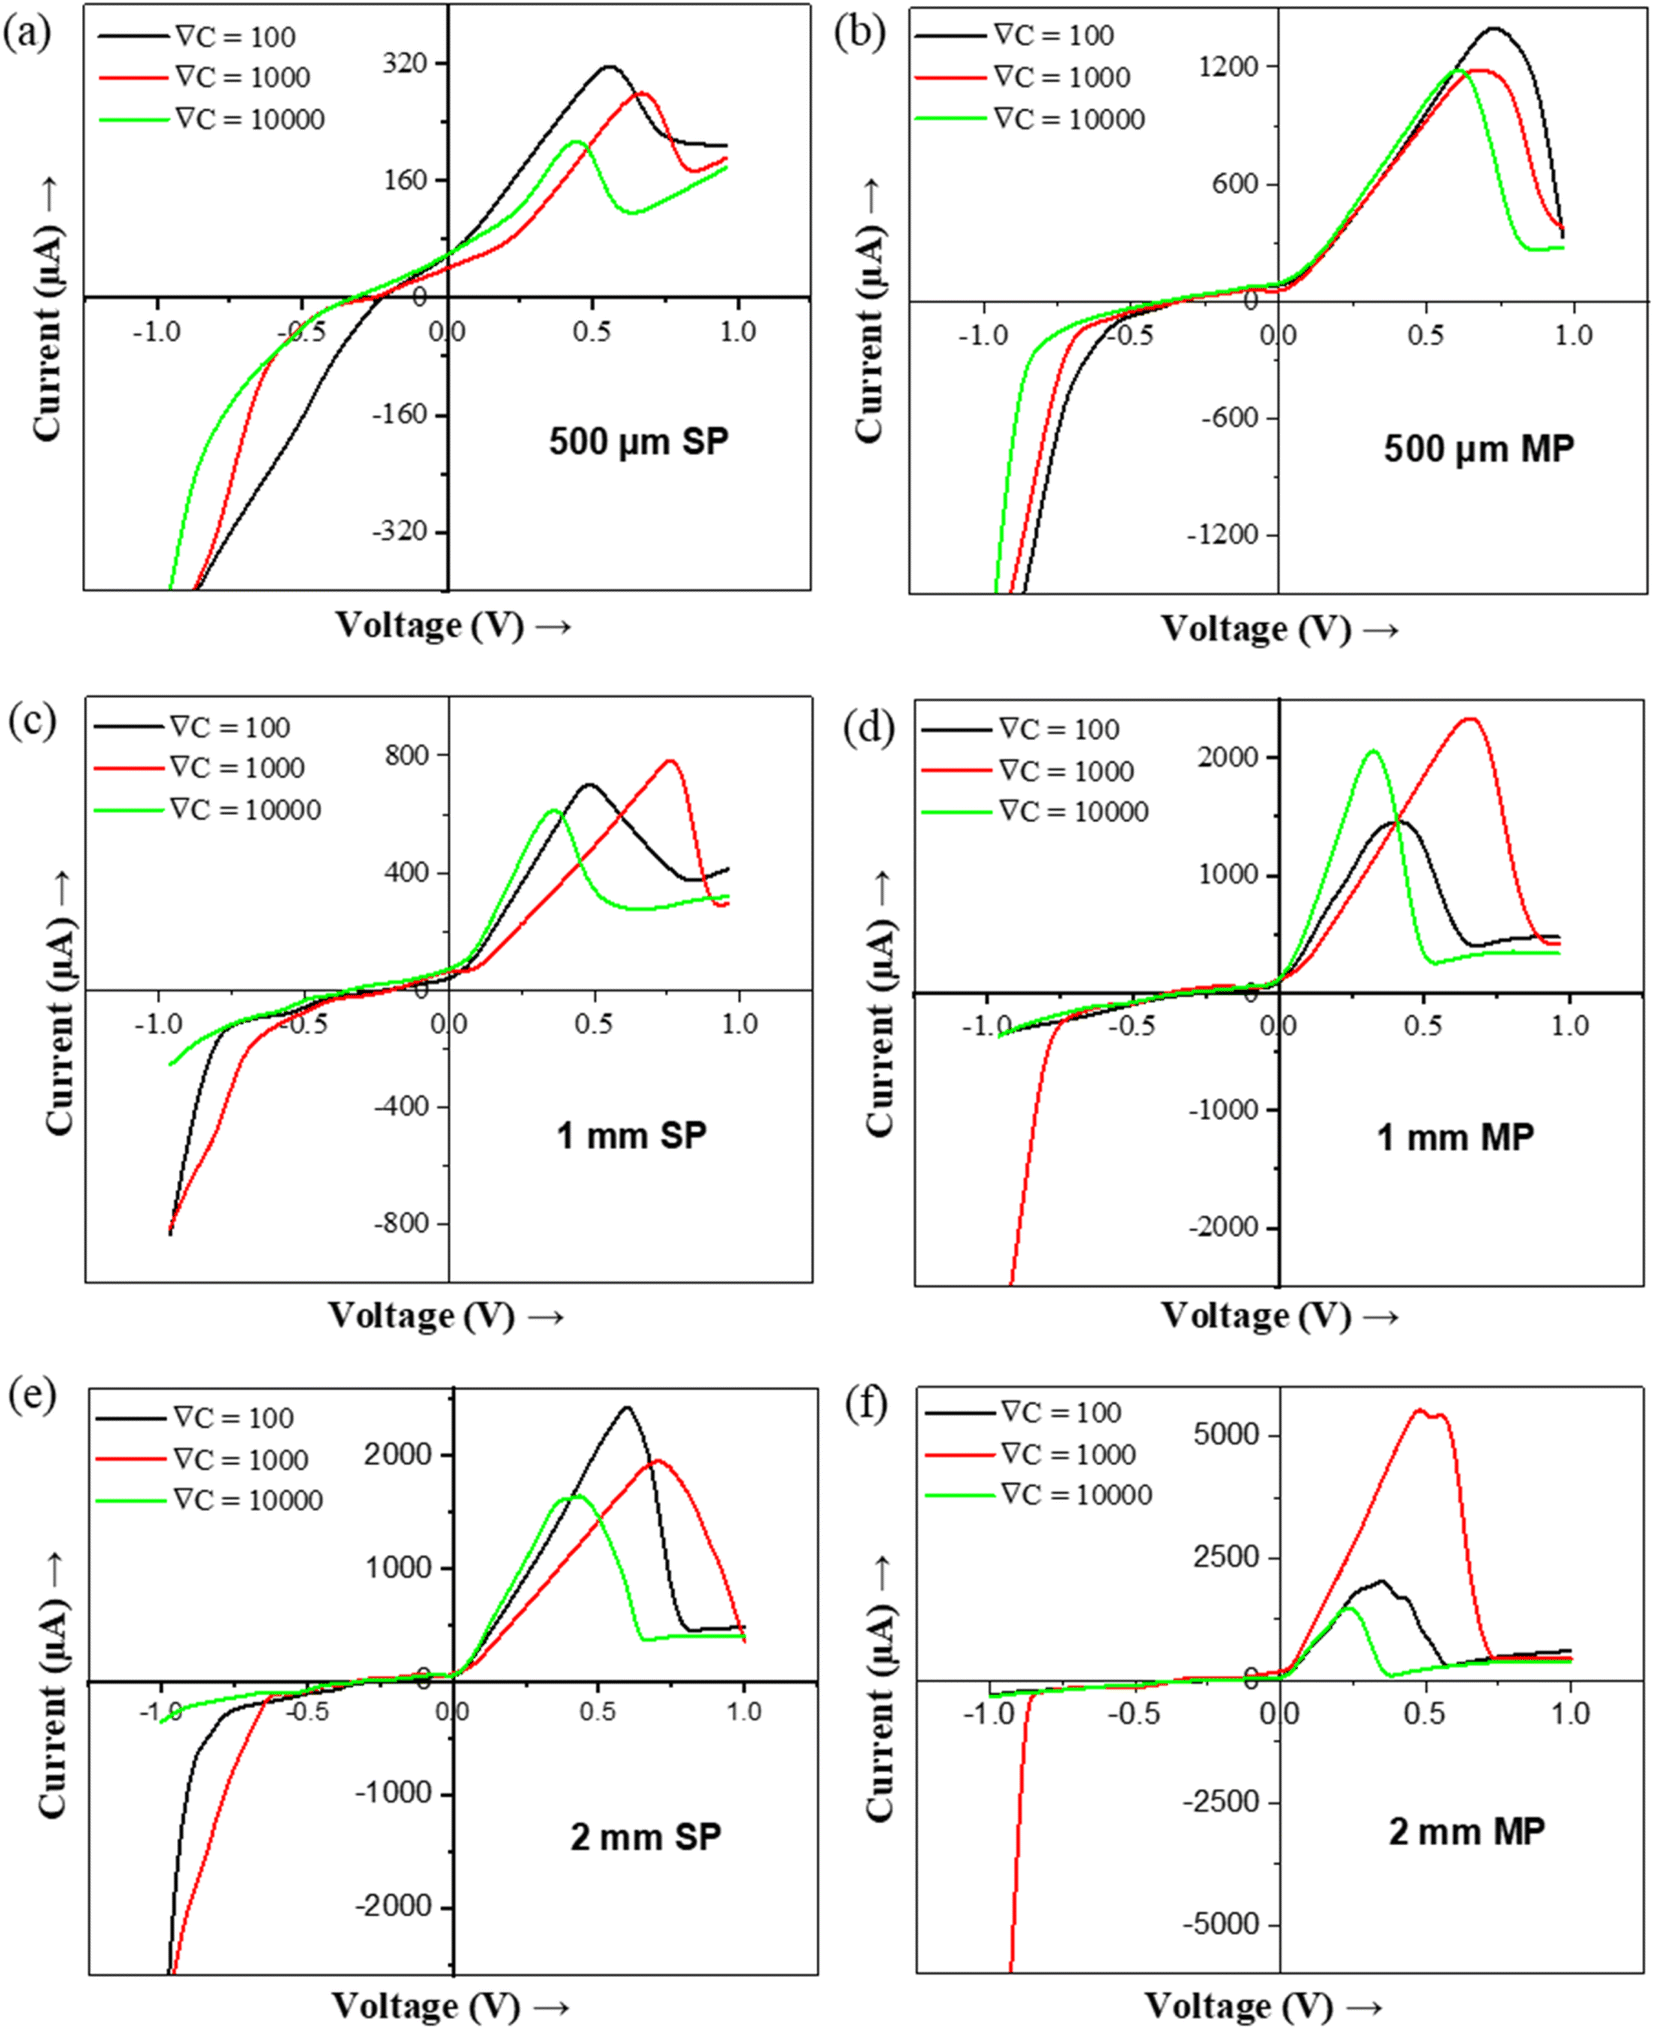 | ||
| Fig. 4 The I–V plots of the ion transport with different concentration gradients through the pore diameter of (a) 500 μm SP, (b) 500 μm MP, (c) 1 mm SP, (d) 1 mm MP, (e) 2 mm SP, and (f) 2 mm MP. The black, red, and green color line curves represent the concentration gradient ∇C = 100, ∇C = 1000 and ∇C = 10000, respectively. SP, MP, and SM correspond to single pore, multiple pores, and the silicone membrane respectively. | ||
000
| No. of pores and diameter | ∇C = 100 | ∇C = 1000 | ∇C = 10000 |
|||
|---|---|---|---|---|---|---|
| I p (μA) | V p (V) | I p (μA) | V p (V) | I p (μA) | V p (V) | |
| 500 μm SP | 338 | 0.58 | 316 | 0.68 | 226 | 0.54 |
| 500 μm MP | 1463 | 0.75 | 1220 | 0.70 | 1196 | 0.60 |
| 1 mm SP | 780 | 0.50 | 812 | 0.77 | 623 | 0.36 |
| 1 mm MP | 1522 | 0.36 | 2376 | 0.66 | 2069 | 0.32 |
| 2 mm SP | 2439 | 0.59 | 1949 | 0.70 | 1590 | 0.41 |
| 2 mm MP | 2049 | 0.35 | 5601 | 0.50 | 1334 | 0.22 |
Fig. 4 shows the effect of the concentration gradient for various sizes and numbers of pores. It can be seen that both Ip and Vp vary with variations in ∇C. Vp shifts to a higher value when ∇C increases from ∇C = 100 to ∇C = 1000 due to higher diffusion flux. The backflow of lower concentration solution effect becomes prominent at comparatively higher voltages.22 However, for a very high concentration gradient (∇C = 10000), Vp is lower than ∇C = 100 and ∇C = 1000. This is due to the very high concentration solution (large viscous) flowing rapidly through the middle of the pore and the low concentration (low viscous) solution flowing near the pore's edges without much radial diffusion.48 Hence, the current increases rapidly at ∇C = 10000 even at a lower voltage (than at ∇C = 100 and ∇C = 1000), and reaches Ip at lower Vp and then starts falling when the low viscous (less concentrated) solution starts occupying most of the pore area48 (Fig. 4).
In recent decades, several research groups have reported the mechanisms of ICR and NDR for various pore dimensions. Siwy & co-workers reported the ICR and NDR characteristics in a 5 nm diameter channel by introducing the divalent ions (Ca2+ and Mn2+). The presence of small divalent ions in the monovalent bulk solution causes a drop in current (as the applied potential increases) due to the interaction of divalent cations and the negatively charged membrane.27,29,34 Both ICR and NDR behaviors were observed by Rabinowitz et al. in a 25 nm diameter channel using the asymmetric KCl solution. According to them, the EOF governs the ICR and NDR due to the influence of vortex patterns on the ionic concentration.21 Similarly, a pressure-driven NDR effect was observed by the H. S. White group in 600 nm channels using the asymmetric solution.22,23 They predicted that NDR is induced due to the interaction of EOF and pressure force (i.e., when the pressure force overcomes the EOF) and it shifts to a higher voltage with the increase in pressure.22,23 Very recently, Lin et al. reported the electrodiffusioosmosis induced NDR using the pH-dependent asymmetry in solution.16
4. Computational method
In order to understand the NDR effect in micro to millimeter size pores, the formulation based on the PNP equations and Navier–Stokes equations was developed. These formulations are widely used to study ion transport and flow in the pores ranging from nanoscale to macroscale.16,22–24,31–33,46,49Fig. 5 shows the schematic representation of the 2D axis-symmetric simulation system used in this work. Simulation of ion transport in the mm-sized pore requires a higher computational cost as the system has an electrical double layer on the nanometer scale. However, the qualitative comparison between the experiments and simulations can be performed by downscaling the system to maintain the same aspect ratio. Hence, to describe the ion transport from the experimental system, the pore of size (diameter-D) 1 μm is created in the Gr/Cu substrate of a thickness (length-L) 18 nm by keeping the same aspect ratio (L/D = 0.018) with the experiments, and the pore is connected with the two large reservoirs. Reservoir dimensions are taken large enough to maintain bulk concentration at the ends of the reservoir.31 To create asymmetry in concentration, left and right reservoirs are filled with 600 mM and 0.6 mM KCl solution, respectively. Further, to represent the pore surface (Gr/Cu) in the simulations, we assumed that the pore surface has a constant surface potential (φs) boundary condition.50 In this system, the potential (φ) is split into two components:32,33 (i) intrinsic potential (φi), and (ii) externally applied potential (φa).| φ = φi + φa | (1) |
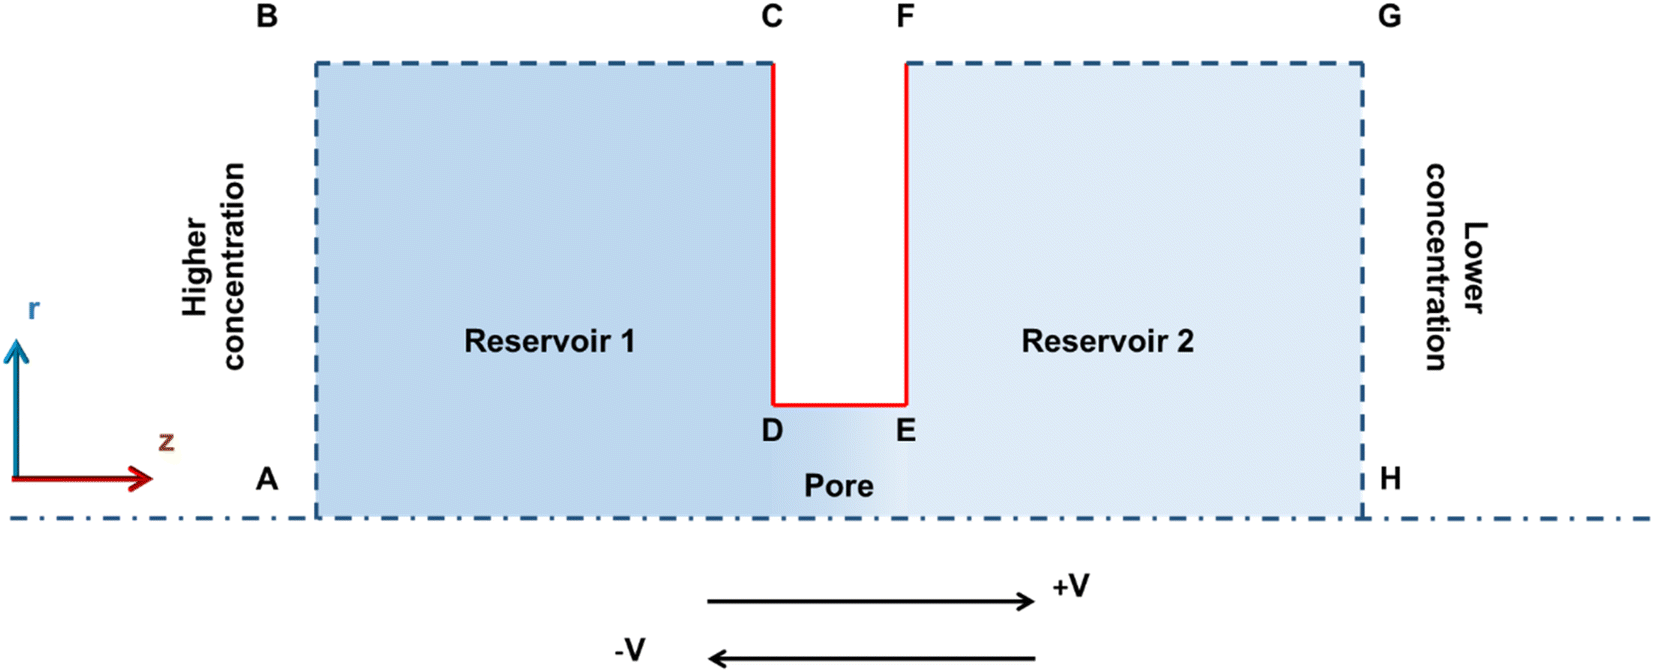 | ||
| Fig. 5 Schematic diagram of the 2D axis-symmetric model of the pore used in the simulation. Here, CDEF represents the graphene-coated copper membrane. Reservoirs 1 and 2 are filled with higher and lower concentration solutions, respectively. | ||
This method is computationally effective for coupling the potential with the ion concentration and fluid flow. The distributions of ionic concentration (c), potential (φ), and velocity (U) are calculated by numerically solving the PNP (2)–(4) equations coupled with Navier–Stokes eqn (4) and (5) under stationary conditions using COMSOL Multiphysics 6.0 and are given below,
 | (2) |
| ∇(εoεr∇φi) = −ρe | (3) |
| ∇(εoεr∇φa) = 0 | (4) |
 | (5) |
| ∇U = 0 | (6) |
Further, the following boundary conditions were assumed to solve eqn (1)–(5). (i) The pore walls (CD, DE, and EF) are considered to be impermeable to ions (n∇J = 0), and no-slip (U = 0). (ii) Reservoir's top walls (BC, FG) are taken as impermeable to ions (n∇J = 0) and slip. (iii) Higher and lower concentration is assumed at the ends of left (AB) and right reservoirs (GH), respectively. (iv) The end of the lower concentration side (GH) is grounded whereas the voltage at the higher concentration side (AB) is varied to obtain the potential across the system. (v) No external pressure is assumed in these studies. (vi) Further, to mimic the experimental system, the constant surface potential (φs = −10 mV) is assumed on all the pore surfaces (CD, DE, and EF).50
Here, the ionic current is calculated by integrating the total ionic flux over the area of the cross-section (S) as given below,16
 | (7) |
Fig. 6a shows the I–V plot using the numerical simulations and predicts the NDR effects similar to the experiments (Vp = 0.6 V). Here, the NDR effects are attributed to the diffusio-osmosis and electroosmotic (EO) flow across the pore. The surface charges on the conducting surface (Gr/Cu membrane) are sensitive to the applied voltage across the reservoirs. The charges on the conducting surface can be polarized due to the applied voltage and induce fluid vortices adjacent to the surface as reported in ref. 51 and 52. The induced fluid flow and vortices are known to be induced charge electroosmosis (ICEO).
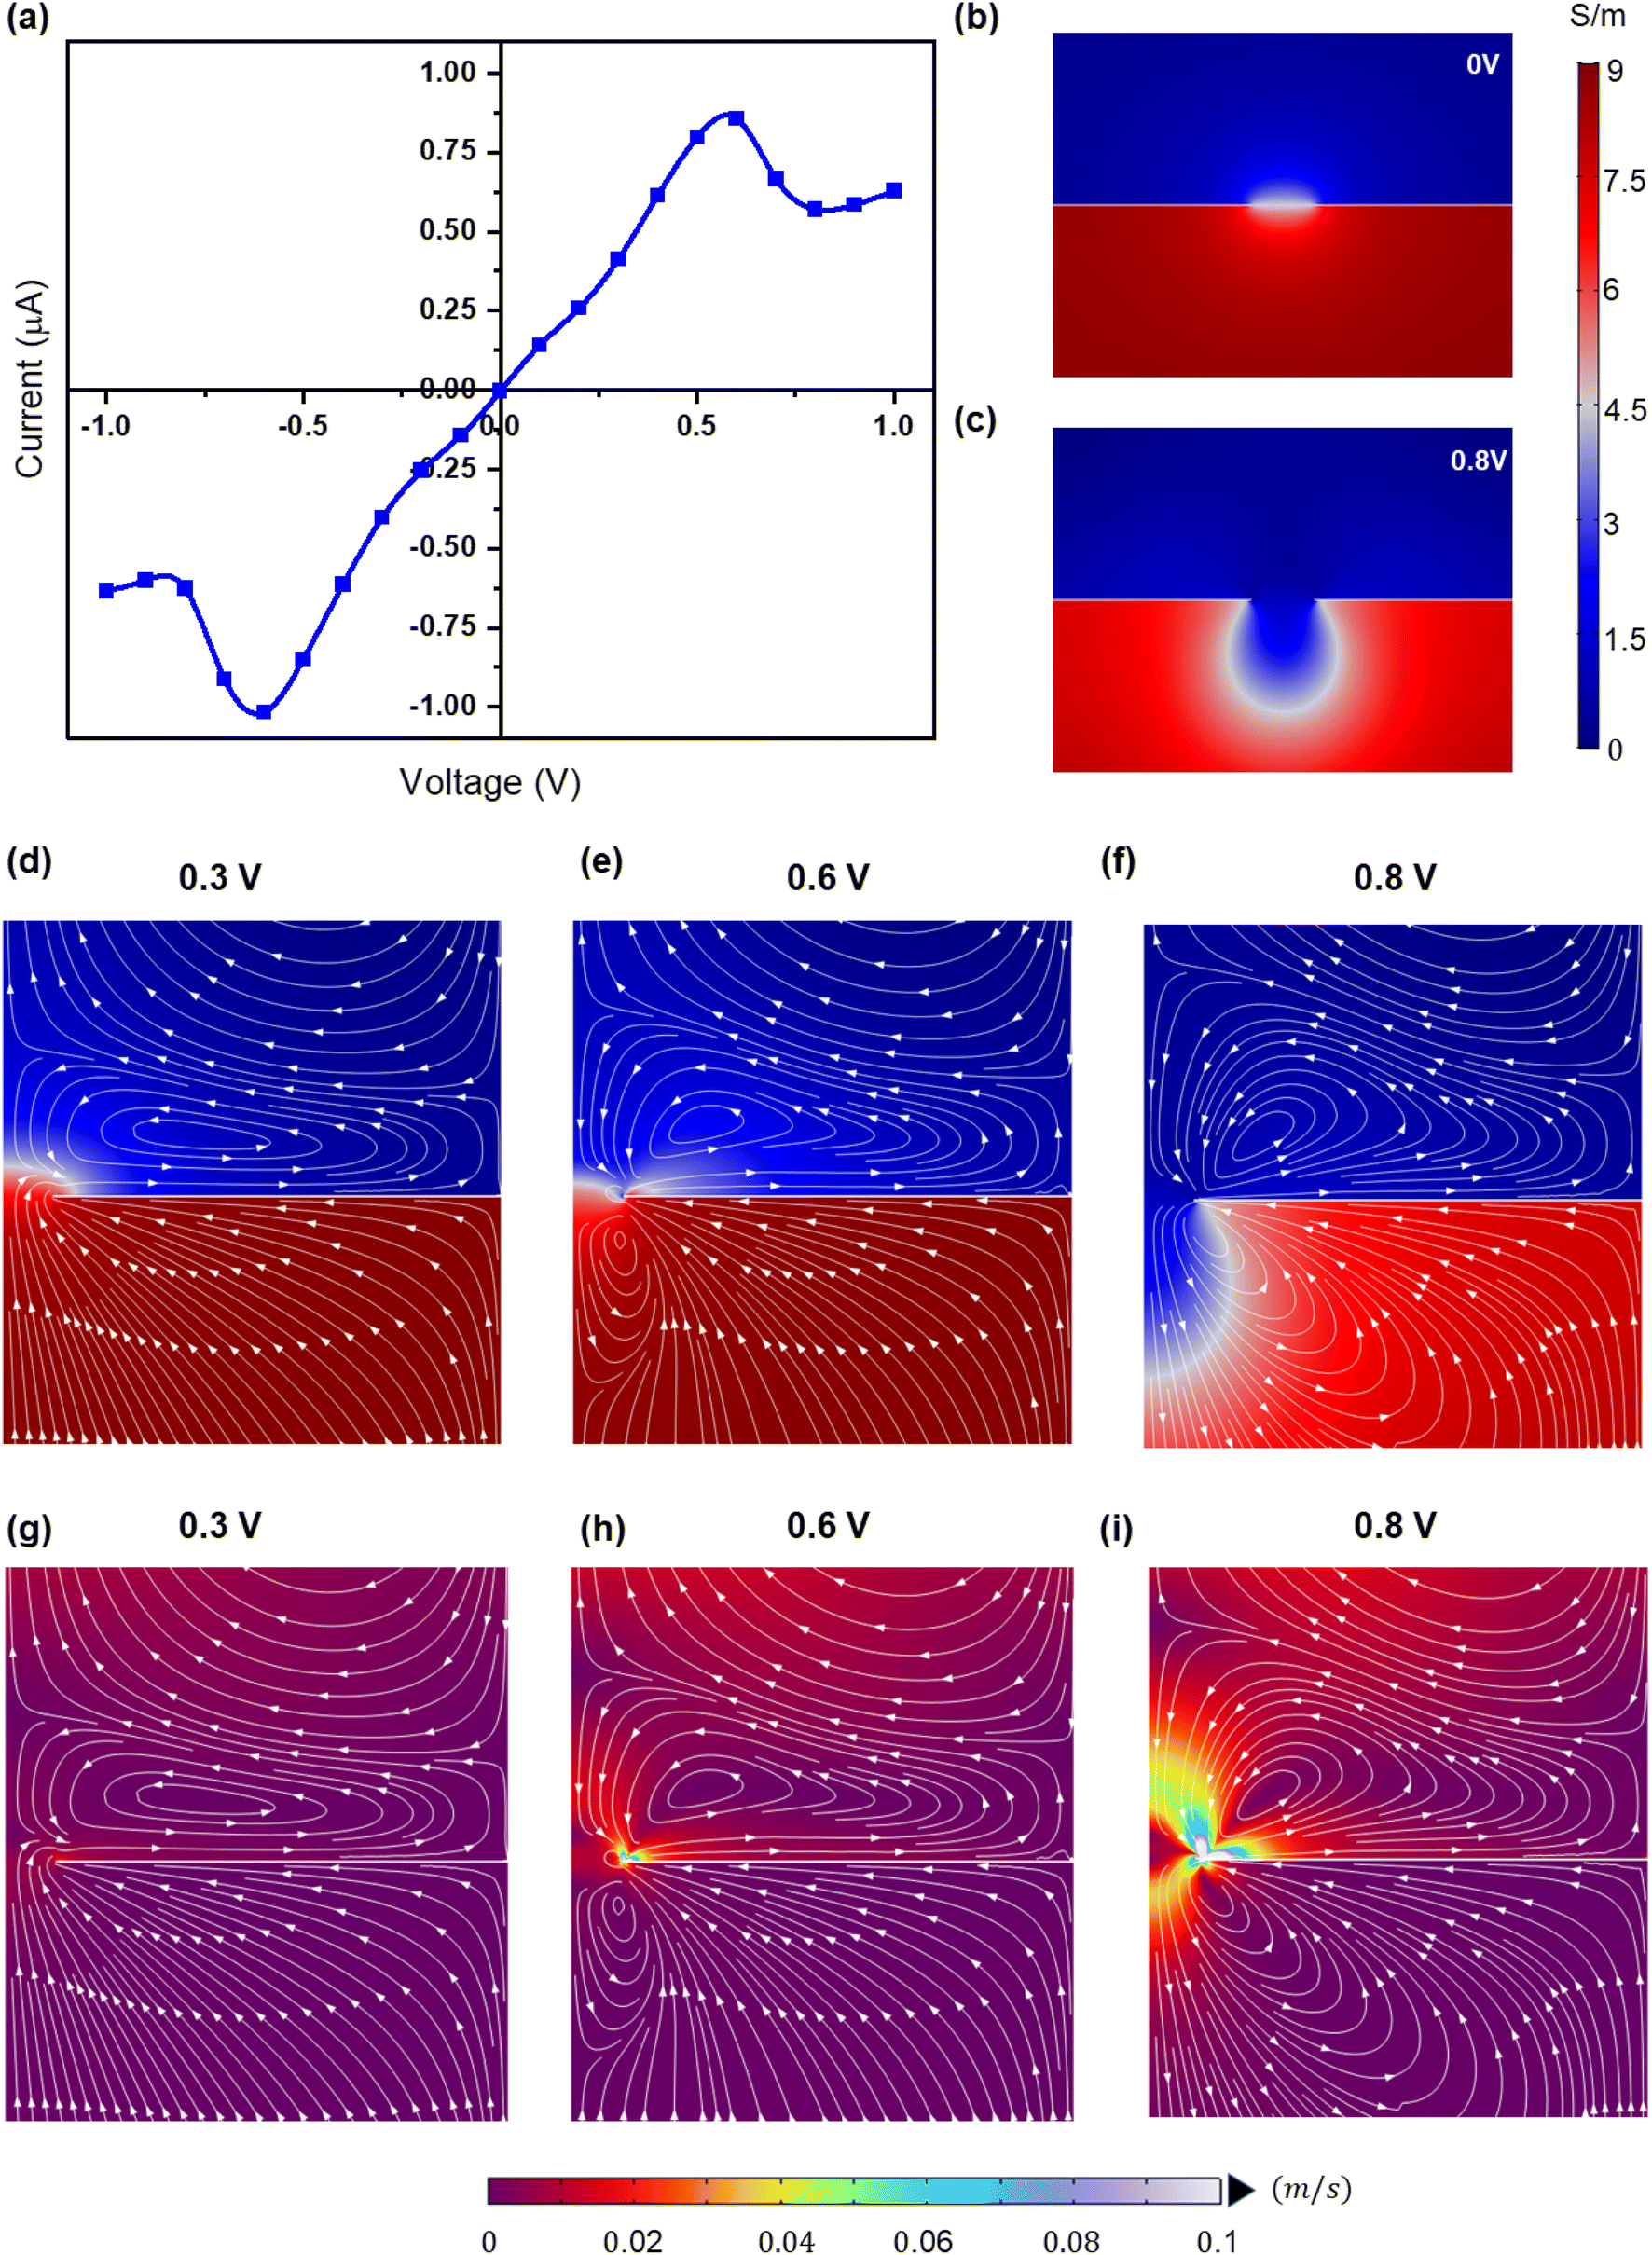 | ||
| Fig. 6 (a) I–V plot of 1 μm pores estimated from the numerical simulations. (b and c) The ionic conductivity profile for the applied voltage of 0 V and 0.8 V, respectively, (d–f) the flow streamlines with ionic conductivity contours, and (g–i) the velocity magnitude near the pore for the three voltages 0.3 V, 0.6 V, 0.8 V. | ||
To better understand the NDR behavior, the ionic conductivity profiles and flow streamlines near the pore are shown in Fig. 6b–f. The application of the voltage across the reservoirs leads to the polarization of the charges on the conducting surface (Fig. S4†). However, these surface charge variations are limited to the small area near the pore opening due to the gradient conductivity solution near this. As a result, electroosmotic (EO) fluid velocity increases near the pore opening compared to the remaining surface of the membrane (Fig. 6g–i). In order to maintain the continuity of the fluid flow, fluidic vortices are formed near the pore.49,51,52 With a further increase in the applied voltage (>0.6 V), the EO flow becomes stronger (Fig. 6g–i) and weakens the diffusio-osmosis driving the low conductivity fluid into the pore and thus the NDR (shown in “NDR_Supplementary_Video”†). The same phenomena can be extrapolated to the negative voltages as the membrane charges are switched to positive values. Moreover, in experiments, the NDR is observed in the negative voltages during the voltage sweep of +1 to −1 V (Fig. S5†).
5. Conclusion
To conclude, we observe electrodiffusioosmosis induced NDR in micro to millimeter-scale diameter pores for the first time. Ion transport simulation is performed using PNP equations and Navier–Stokes equations with the help of COMSOL Multiphysics to validate the experimental results. It is found that the charge polarization induced EOF dominates over the diffusio-osmosis causing the backflow of low concentration/conductivity solution into the pore, thereby causing NDR. The membrane surface charge induced EOF is the key to creating the NDR effect in larger pores compared to other factors reported in the literature for smaller pores. This finding paves the way toward potential applications in ionic tunnel diodes as rectifiers, switches, amplifiers, and biosensors.Conflicts of interest
The authors declare that they have no competing financial interests or personal relationships that could have appeared to influence the work reported in this paper.Acknowledgements
P. K. N. and V. V. R. N. acknowledge the financial support from the Ministry of Human Resource Development (MHRD), the Government of India (GOI) via STARS grant [STARS/APR2019/148], and the Department of Science and Technology (DST) GOI via CRG grant [CRG/2020/001684]. P. K. N. acknowledges the financial support from DST-GoI with sanction order no. SB/S2/RJN-043/2017 under Ramanujan Fellowship and support from the Institute of Eminence scheme at IIT-Madras, through the 2D Materials Research and Innovation Group. M. D. acknowledges the use of the computing resources at HPCE, IIT Madras. P. K. N. and V. V. R. N. also acknowledge gratefully the support from the Institute of Eminence scheme at IIT Madras, through the Micro Nano-Bio Fluidics Group.References
- I. Vlassiouk, T. R. Kozel and Z. S. Siwy, J. Am. Chem. Soc., 2009, 131, 8211–8220 CrossRef CAS PubMed.
- M. Ali, R. Neumann and W. Ensinger, ACS Nano, 2010, 4, 7267–7274 CrossRef CAS PubMed.
- Z. Zhang, P. Li, X.-Y. Kong, G. Xie, Y. Qian, Z. Wang, Y. Tian, L. Wen and L. Jiang, J. Am. Chem. Soc., 2018, 140, 1083–1090 CrossRef CAS PubMed.
- V. Baptista, Adv. Physiol. Educ., 2015, 39, 397–404 CrossRef PubMed.
- J. Gao, W. Guo, D. Feng, H. T. Wang, D. Y. Zhao and L. Jiang, J. Am. Chem. Soc., 2014, 136, 12265 CrossRef CAS PubMed.
- Z. Zhang, X. Sui, P. Li, G. H. Xie, X. Y. Kong, K. Xiao, L. C. Gao, L. P. Wen and L. Jiang, J. Am. Chem. Soc., 2017, 139, 8905 CrossRef CAS PubMed.
- R. Li, J. Jiang, Q. Liu, Z. Xie and J. Zhai, Nano Energy, 2018, 53, 643–649 CrossRef CAS.
- J. Ji, Q. Kang, Y. Zhou, Y. Feng, X. Chen, J. Yuan, W. Guo, Y. Wei and L. Jiang, Adv. Funct. Mater., 2017, 27, 1603623 CrossRef.
- J. Feng, M. Graf, K. Liu, D. Ovchinnikov, D. Dumcenco, M. Heiranian, V. Nandigana, N. R. Aluru, A. Kis and A. Radenovic, Nature, 2016, 536, 197–200 CrossRef CAS PubMed.
- J. Feng, K. Liu, M. Graf, M. Lihter, R. D. Bulushev, D. Dumcenco, D. T. L. Alexander, D. Krasnozhon, T. Vuletic, A. Kis and A. Radenovic, Nano Lett., 2015, 15, 3431–3438 CrossRef CAS PubMed.
- Y. Wang, H. Zhang, Y. Kang, Y. Zhu, G. P. Simon and H. Wang, ACS Nano, 2019, 13, 11793–11799 CrossRef CAS PubMed.
- G. Yossifon, P. Mushenheim, Y.-C. Chang and H.-C. Chang, Phys. Rev. E: Stat., Nonlinear, Soft Matter Phys., 2009, 79, 46305 CrossRef PubMed.
- R. B. Schoch, J. Han and P. Renaud, Rev. Mod. Phys., 2008, 80, 839–883 CrossRef CAS.
- A. Plecis, R. B. Schoch and P. Renaud, Nano Lett., 2005, 5, 1147–1155 CrossRef CAS PubMed.
- R. A. Lucas, C.-Y. Lin and Z. S. Siwy, J. Phys. Chem. B, 2019, 123, 6123–6131 CrossRef CAS PubMed.
- C.-Y. Lin, P.-H. Wong, P.-H. Wang, Z. S. Siwy and L.-H. Yeh, ACS Appl. Mater. Interfaces, 2020, 12, 3198–3204 CrossRef CAS.
- Z. S. Siwy, Adv. Funct. Mater., 2006, 16, 735–746 CrossRef CAS.
- C.-Y. Lin, L.-H. Yeh and Z. S. Siwy, J. Phys. Chem. Lett., 2018, 9, 393–398 CrossRef CAS PubMed.
- Y. Wu, G. Yang, M. Lin, X. Kong, L. Mi, S. Liu, G. Chen, Y. Tian and L. Jiang, Angew. Chem., Int. Ed., 2019, 58, 12481–12485 CrossRef CAS PubMed.
- C. Y. Lin, C. Combs, Y. S. Su, L. H. Yeh and Z. S. Siwy, J. Am. Chem. Soc., 2019, 141, 3691 CrossRef CAS PubMed.
- J. Rabinowitz, M. A. Edwards, E. Whittier, K. Jayant and K. L. Shepard, J. Phys. Chem. A, 2019, 123, 8285–8293 CrossRef PubMed.
- L. Luo, D. A. Holden, W.-J. Lan and H. S. White, ACS Nano, 2012, 6, 6507–6514 CrossRef CAS PubMed.
- L. Luo, D. A. Holden and H. S. White, ACS Nano, 2014, 8, 3023–3030 CrossRef CAS PubMed.
- Y. Qiu, R. A. Lucas and Z. S. Siwy, J. Phys. Chem. Lett., 2017, 8, 3846–3852 CrossRef CAS PubMed.
- S. Park and G. Yossifon, Phys. Rev. E, 2016, 93, 62614 CrossRef.
- E. C. Yusko, R. An and M. Mayer, ACS Nano, 2010, 4, 477–487 CrossRef CAS PubMed.
- Z. S. Siwy, M. R. Powell, E. Kalman, R. D. Astumian and R. S. Eisenberg, Nano Lett., 2006, 6, 473–477 CrossRef CAS PubMed.
- X. He, K. Zhang, T. Li, Y. Jiang, P. Yu and L. Mao, J. Am. Chem. Soc., 2017, 139, 1396–1399 CrossRef CAS PubMed.
- Z. S. Siwy, M. R. Powell, A. Petrov, E. Kalman, C. Trautmann and R. S. Eisenberg, Nano Lett., 2006, 6, 1729–1734 CrossRef CAS PubMed.
- L. Wang, Z. Wang, S. K. Patel, S. Lin and M. Elimelech, ACS Nano, 2021, 15(3), 4093–4107 CrossRef CAS PubMed.
- C.-Y. Lin, F. Chen, L.-H. Yeh and J.-P. Hsu, Phys. Chem. Chem. Phys., 2016, 18, 30160–30165 RSC.
- A. M. Benneker, H. D. Wendt, R. G. H. Lammertink and J. A. Wood, Phys. Chem. Chem. Phys., 2017, 19, 28232–28238 RSC.
- J. A. Wood, A. M. Benneker and R. G. H. Lammertink, J. Phys.: Condens. Matter, 2016, 28, 114002 CrossRef PubMed.
- M. R. Powell, M. Sullivan, I. Vlassiouk, D. Constantin, O. Sudre, C. C. Martens, R. S. Eisenberg and Z. S. Siwy, Nat. Nanotechnol., 2008, 3, 51–57 CrossRef CAS PubMed.
- J. P. Fried, J. L. Swett, X. Bian and J. A. Mol, MRS Commun., 2018, 8, 703–711 CrossRef CAS.
- Z. Tang, D. Zhang, W. Cui, H. Zhang, W. Pang and X. Duan, Nanomater. Nanotechnol., 2016, 6, 35 CrossRef.
- M. Graf, M. Lihter, M. Thakur, V. Georgiou, J. Topolancik, B. R. Ilic, K. Liu, J. Feng, Y. Astier and A. Radenovic, Nat. Protoc., 2019, 14, 1130–1168 CrossRef CAS.
- H. Kwok, K. Briggs and V. Tabard-Cossa, PLoS One, 2014, 9, e92880 CrossRef PubMed.
- P. Fürjes, Z. Fekete, L. Illés, A. L. Tóth, G. Battistig and R. E. Gyurcsányi, Procedia Eng., 2012, 47, 684–687 CrossRef.
- Y. H. Lanyon, G. De Marzi, Y. E. Watson, A. J. Quinn, J. P. Gleeson, G. Redmond and D. W. M. Arrigan, Anal. Chem., 2007, 79, 3048–3055 CrossRef CAS PubMed.
- L. Cerami, E. Mazur, S. Nolte and C. B. Schaffer, in Ultrafast Nonlinear Optics, Springer, 2013, pp. 287–321 Search PubMed.
- A. Szczesny, P. Śniecikowski, J. Szmidt and A. Werbowy, Vacuum, 2003, 70, 249–254 CrossRef CAS.
- M. Farsari, G. Filippidis, S. Zoppel, G. A. Reider and C. Fotakis, J. Micromech. Microeng., 2005, 15, 1786–1789 CrossRef CAS.
- R. W. Impey, P. A. Madden and I. R. McDonald, J. Phys. Chem., 1983, 87, 5071–5083 CrossRef CAS.
- S. K. Yadav, M. Kumar, S. Ramaprabhu, V. V. R. Nandigana and P. K. Nayak, Rev. Sci. Instrum., 2022, 93, 64104 CrossRef CAS PubMed.
- C. Zhao, Y. Song and C. Yang, Phys. Fluids, 2015, 27, 12003 CrossRef.
- S. Chen, L. Brown, M. Levendorf, W. Cai, S.-Y. Ju, J. Edgeworth, X. Li, C. W. Magnuson, A. Velamakanni, R. D. Piner, J. Kang, J. Park and R. S. Ruoff, ACS Nano, 2011, 5, 1321–1327 CrossRef CAS PubMed.
- P. Meares and K. R. Page, Philos. Trans. R. Soc. London, Ser. A, 1972, 272, 1–46 CrossRef CAS.
- C. Zhao and C. Yang, Microfluid. Nanofluid., 2015, 18, 785–794 CrossRef CAS.
- I. I. Ryzhkov and A. V. Minakov, J. Membr. Sci., 2016, 520, 515–528 CrossRef CAS.
- T. M. Squires and M. Z. Bazant, J. Fluid Mech., 2004, 509, 217–252 CrossRef.
- M. Z. Bazant and T. M. Squires, Phys. Rev. Lett., 2004, 92, 66101 CrossRef PubMed.
Footnote |
| † Electronic supplementary information (ESI) available. See https://doi.org/10.1039/d2na00443g |
| This journal is © The Royal Society of Chemistry 2022 |