
 Open Access Article
 This Open Access Article is licensed under a Creative Commons Attribution-Non Commercial 3.0 Unported Licence
Modifying the magnetic response of magnetotactic bacteria: incorporation of Gd and Tb ions into the magnetosome structure†
E. M.
Jefremovas
 *a,
L.
Gandarias
b,
L.
Marcano
cd,
A.
Gacía-Prieto
e,
I.
Orue
f,
A.
Muela
bg,
M. L.
Fdez-Gubieda
cg,
L. Fernández
Barquín
a and
J.
Alonso
*a
*a,
L.
Gandarias
b,
L.
Marcano
cd,
A.
Gacía-Prieto
e,
I.
Orue
f,
A.
Muela
bg,
M. L.
Fdez-Gubieda
cg,
L. Fernández
Barquín
a and
J.
Alonso
*a
aDpto. CITIMAC, Universidad de Cantabria, 39005 Santander, Spain. E-mail: martinjel@unican.es; javier.alonsomasa@unican.es
bDpto. Inmunología, Microbiología y Parasitología, Universidad del País Vasco (UPV/EHU), 48940 Leioa, Spain
cHelmholtz–Zentrum Berlin für Materialien und Energie, Albert-Einstein-Str. 15, 12489 Berlin, Germany
dDpto. Electricidad y Electrónica, Universidad del País Vasco (UPV/EHU), 48940 Leioa, Spain
eDpto. Física Aplicada, Universidad del País Vasco (UPV/EHU), 48013 Bilbao, Spain
fSGIker Medidas Magnéticas, Universidad del País Vasco (UPV/EHU), 48940 Leioa, Spain
gBCMaterials, Basque Center for Materials, Applications and Nanostructures, UPV/EHU, Spain
First published on 26th April 2022
Abstract
Magnetotactic bacteria Magnetospirillum gryphiswaldense MSR-1 biosynthesise chains of cube–octahedral magnetosomes, which are 40 nm magnetite high quality (Fe3O4) nanoparticles. The magnetic properties of these crystalline magnetite nanoparticles, which can be modified by the addition of other elements into the magnetosome structure (doping), are of prime interest in a plethora of applications, those related to cancer therapy being some of the most promising ones. Although previous studies have focused on transition metal elements, rare earth (RE) elements are very interesting as doping agents, both from a fundamental point of view (e.g. significant differences in ionic sizes) and for the potential applications, especially in biomedicine (e.g. magnetic resonance imaging and luminescence). In this work, we have investigated the impact of Gd and Tb on the magnetic properties of magnetosomes by using different complementary techniques. X-ray diffraction, transmission electron microscopy, and X-ray absorption near edge spectroscopy analyses have revealed that a small amount of RE ions, ∼3–4%, incorporate into the Fe3O4 structure as Gd3+ and Tb3+ ions. The experimental magnetic characterisation has shown a clear Verwey transition for the RE-doped bacteria, located at T ∼ 100 K, which is slightly below the one corresponding to the undoped ones (106 K). However, we report a decrease in the coercivity and remanence of the RE-doped bacteria. Simulations based on the Stoner–Wohlfarth model have allowed us to associate these changes in the magnetic response with a reduction of the magnetocrystalline (KC) and, especially, the uniaxial (Kuni) anisotropies below the Verwey transition. In this way, Kuni reaches a value of 23 and 26 kJ m−3 for the Gd- and Tb-doped bacteria, respectively, whilst a value of 37 kJ m−3 is obtained for the undoped bacteria.
1 Introduction
Magnetosomes are membrane-enclosed single-domain magnetic nanoparticles made of magnetite (Fe3O4) or greigite (Fe3S4) synthesised by magnetotactic bacteria (MTB). These magnetosomes are arranged in one or several chains inside the MTB, which allow the MTB to orient in water by means of the torque exerted by the Earth’s magnetic field on the chain.1 The size and shape of magnetosomes strongly depend on the MTB species, their sizes generally being comprised between 35 and 120 nm, and they can be shaped as cube–octahedral, hexagonal prisms, arrows, etc.2 The potential transfer of magnetosomes towards biomedical applications has boosted the interest of these biosynthesised magnetic nanoparticles in the recent years. Their high purity and crystallinity (referred to as high quality from hereunder), narrow size distribution, good biocompatibility, and relatively easy functionalization have made magnetosomes promising candidates as theranostic agents for magnetic hyperthermia, drug delivery, and magnetic resonance imaging (MRI), among other applications.3–10Furthermore, magnetosomes have also been considered as reliable models to investigate the relationship between the structural and magnetic properties of magnetite at the nanoscale,11–14 a matter of debate that has attracted great interest for many years in the scientific community. To this respect, magnetosomes can be employed to investigate different relevant issues, including the survival of the Verwey transition of magnetite at the nanoscale or the role of shape anisotropy in faceted nanoparticles.15–17
Nevertheless, despite these very promising features, magnetosomes present some drawbacks, especially when compared with their chemically synthesised counterparts. These include, for example, the restricted tunability of their shape, size and chemical composition, as these features are strictly genetically determined.18,19 These restrictions constitute a nuisance when trying to modify the magnetic response of magnetosomes for different applications.20–23 However, alternative routes have been devised to overcome some of these limitations. MTB exhibit a high affinity and specificity towards iron, which they extract from the medium in order to synthesise magnetosomes. In the same way, it has been demonstrated that MTB can also synthesise magnetosomes doped with some transition metals such as manganese, titanium, copper, or cobalt,23–28 by adding limited amounts of these metals to the growth medium. There are however very few studies describing the incorporation of other elements,29 which underlines the inherent complexity associated with the doping process.
Among all the possible doping candidates, the incorporation of Rare Earth (RE) ions into magnetosomes would be considerably appealing. RE doping opens the door to modifying the internal structure and the magnetic properties of the nanoparticles, both being accomplished at the same time. Moreover, RE elements are currently used in several top-notch fields, such as biomedicine, catalysis, and/or solar cells.30,31 The fascination towards RE does not stop at their potential biomedical and technological transfer, yet there is also room for the emergence of new magnetic phenomena. In this way, from a fundamental point of view, the large unquenched orbital angular momentum and high spin–orbit coupling of the 4f electrons in some RE ions can give rise to more pronounced magnetic features in comparison to transition metal ions.32,33 Therefore, there is also a great potential for investigation on RE-doped magnetosomes, apart from the ones doped with transition metals. To the best of our knowledge, the only work that has been published in this area is the one by Shimoshige et al.34 Specifically, they doped Magnetospirillum magneticum RSS-1 with Sm ions, obtaining core/shell magnetosomes made of magnetite in the core and samarium oxide in the shell.
In our work, we have been able to incorporate, for the first time, Gd3+ and Tb3+ ions into magnetosomes from the Magnetospirillum gryphiswaldense strain MSR-1. Gd3+ is a S-state ion (L = 0) with seven unpaired electrons, which has been investigated, among other things, to develop gadolinium-doped iron oxide nanoparticles exhibiting a T1–T2 dual-model MRI contrast.35,36 On the other hand, Tb3+ is an ion with six unpaired electrons, which has attracted attention for the possibility of providing magnetite nanoparticles with luminescence properties, which can be useful for monitoring the nanoparticles within the context of several biomedical applications.36,37 Furthermore, the incorporation of Gd and Tb ions into the magnetite structure has also attracted attention due to the modulation of the magnetic properties of magnetite when the larger Gd3+ and Tb3+ ions are incorporated into its inverse spinel structure.38
Bearing all these considerations in mind, we present here a combination of experimental and theoretical results to investigate the role of Gd3+ and Tb3+ cations in the magnetic response of magnetosomes. The morphological and structural properties of these RE-doped magnetosomes have been studied by transmission electron microscopy (TEM) and X-ray diffraction (XRD). The incorporation of the RE ions into the magnetosome structure has been investigated by X-ray absorption near edge spectroscopy (XANES) experiments, carried out in large scale Synchrotron facilities. In addition, the magnetic response of these doped magnetosomes has been thoroughly analysed, and compared with undoped magnetosomes, by using different experimental magnetic measurements, including zero-field cooling/field-cooling (ZFC/FC) curves and hysteresis loops (M vs. H). Finally, a modified Stoner–Wohlfarth model has been employed to simulate the experimental M vs. H loops. This has allowed us to pinpoint the specific magnetic changes taking place, and to relate these changes to the intrinsic modification of the effective anisotropies of these Gd- and Tb-doped magnetosomes.
2 Materials and methods
2.1 Magnetotactic bacteria: culture and magnetosome isolation
Magnetospirillum gryphiswaldense MSR-1 (DMSZ 6631) was grown without shaking at 28 °C in Flask Standard Medium (FSM) (Heyen and Schüler39) containing (per litre of deionized water) 0.1 g KH2PO4, 0.15 g MgSO4·7H2O, 2.38 g HEPES, 0.34 g NaNO3, 0.1 g yeast extract, 3 g soybean peptone, 0.3% (wt/vol) of sodium pyruvate as the carbon source and 100 μM of Fe(III)-citrate. For gadolinium and terbium doping of bacteria, 100 μM of Gd(III)-quinate and Tb(III)-quinate were added, respectively.Bacteria were grown in 100 mL bottles filled with 80 mL of the culture media to obtain the desired oxygen concentration conditions. The inoculation in FSM containing 100 μM of Gd/Tb-quinate is made from a 48 hour culture grown in FSM in a 1/10 dilution. In order to ensure that the bacteria are in contact with the dopant long enough, two subcultures of 48 hours are made in FSM containing 100 μM of Gd/Tb-quinate. The reproducibility was assured with more than 10 replicates of the RE doped bacteria obtained at different times since the beginning of the studies.
Two different samples were employed in the subsequent experimental measurements: whole cells and isolated magnetosomes from the bacteria. First, the whole cell samples were harvested by centrifugation, fixed in 2% glutaraldehyde, and washed three times in Milli Q water. Second, the isolation of magnetosomes was performed following the protocol described by Grünberg et al.30 with minor modifications. The cells, suspended in 20 mM HEPES–4 mM EDTA (pH = 7.4), were disrupted using a French press (P = 1.4 kbar). To promote the separation of the magnetosomes, the lysated cells were sonicated and centrifuged at 600 g for 5 min to remove cell debris. Then, magnetic separation was employed to collect the magnetosomes from the supernatant, and afterwards, they were rinsed 10 times with 10 mM Hepes–200 mM NaCl (pH = 7.4).
2.2 Transmission electron microscopy
Transmission electron microscopy (TEM) was carried out on both unstained whole bacteria (i.e., whole cells) and the isolated magnetosomes extracted from the bacteria. In both cases, samples were adsorbed onto 300 mesh carbon-coated copper grids. The images were obtained with a JEOL JEM-14000 Plus electron microscope at an accelerating voltage of 120 kV. The particle size distribution was analysed by using ImageJ software.40 More than 130 magnetosomes from different cells were measured one-by-one in order to ensure good statistics.2.3 X-ray diffraction
X-Ray diffraction (XRD) measurements were performed on Gd- and Tb-doped whole bacteria (whole cells) using a Bruker D8 Advance diffractometer working in Bragg–Bentano geometry with Cu-Kα (λ = 1.5418 Å) radiation. The selected range for the 2θ Bragg angle was 18° to 95°, with an angular step of 0.02° at a counting rate of 1 second/step. The obtained XRD patterns were analysed using Rietveld refinements. All the measurements were carried out in the whole cells in order to minimise possible oxidation of the magnetosomes after extraction.2.4 X-ray absorption near edge spectroscopy
X-ray absorption near edge spectroscopy (XANES) was performed on Gd- and Tb-doped magnetosomes extracted from the bacteria at both the Fe–K and RE-L3 edges (7112 eV for Fe–K, 7514 eV for Tb-L3, and 7243 eV for Gd-L3). Measurements were carried out at the CLAESS beamline of the ALBA synchrotron at room temperature. Fe K-edge and Tb L3-edge measurements were carried out in transmission mode, and Gd L3-edge measurements were carried out in fluorescence mode. In all cases, the measurements were performed using a double Si crystal monochromator oriented in the [111] direction.2.5 Magnetic measurements
The magnetic characterisation was carried out on the whole bacteria (whole cells). The samples were freeze-dried and encapsulated in gelatin capsules. Magnetic measurements were performed in a superconducting quantum interference device magnetometer (Quantum Design MPMS-5). Magnetisation vs. temperature (M vs. T) curves were measured following the usual zero-field-cooling/field-cooling (ZFC/FC) protocol, with an applied magnetic field of 5 mT. Magnetisation vs. magnetic field (M vs. H) loops were measured at different temperatures, 10–300 K, applying magnetic fields up to 1 T.3 Results and discussion
3.1 Structural characterisation
Transmission electron microscopy (TEM) was employed to study the size, shape, and arrangement of the RE doped magnetosomes. Fig. 1(a)–(c) show representative images of the magnetosomes extracted from the bacteria corresponding to the undoped, Gd-, and Tb-doped bacteria, respectively. We have included in Fig. S1 and S2 of the ESI† additional TEM images of the MTB and their magnetosome chains. In both Gd- and Tb-doped bacteria, the magnetosomes clearly exhibit the faceted cube-octahedral morphology typical of M. gryphiswaldense (see Fig. 1(a)). However, some of these RE doped magnetosomes seem to present a less faceted morphology compared to their undoped counterparts (see Fig. S1 in the ESI†). Along these lines, it has been reported that the presence of doping salts in the culture medium and the incorporation of the doping elements into the magnetosome structure can impose stress in the biomineralisation process.25,27,28 In fact, similar shape irregularities have also been reported, for example, in Mn-doped magnetosomes.27 Indeed, high-resolution transmission electron microscopy (HRTEM) or similar high resolution imaging techniques would be needed for quantitative analyses. We have also observed that the chains of magnetosomes inside the RE-doped MTB occasionally present minor irregularities and deformations, as depicted in Fig. S1 and S2 in the ESI.† Moreover, the RE doped bacteria tend to form larger chains (∼27 magnetosomes/chain) compared to the undoped bacteria (∼20) (see Table 1). Histograms accounting for the size-distribution of the magnetosomes are shown in Fig. 1(d)–(f), together with the corresponding Gaussian fits. For the undoped magnetosomes, two size distributions can be observed, one centered around 47(8) nm and the other one centered at 22(8) nm. This double size distribution is typical of these M. gryphiswaldense bacteria, and accounts for the difference in size between the magnetosomes located at the ends of the chain (smaller) and those located at the inner positions (larger). Just in the same way, two size distributions are also observed for the Tb-doped magnetosomes, centered at 42(6) nm and 29(2) nm. However, only a single size distribution centered at 33(9) nm is obtained for the Gd-doped magnetosomes. What is clear according to these TEM analyses, is that the Gd- and Tb-doped bacteria tend to synthesise longer chains with smaller magnetosomes. A similar size reduction was also found for M. gryphiswaldense bacteria doped with other elements, such as Mn and Co.26–28 A possible explanation for the presence of longer chains in RE doped bacteria could be that an increase in the magnetosomes/chain ratio would compensate for the reduction of the magnetic moment per magnetosome, given the smaller average size of the RE doped magnetosomes compared to the undoped ones. As a result, the net magnetic moment per chain would remain similar in both cases. However, further work will be needed to confirm this.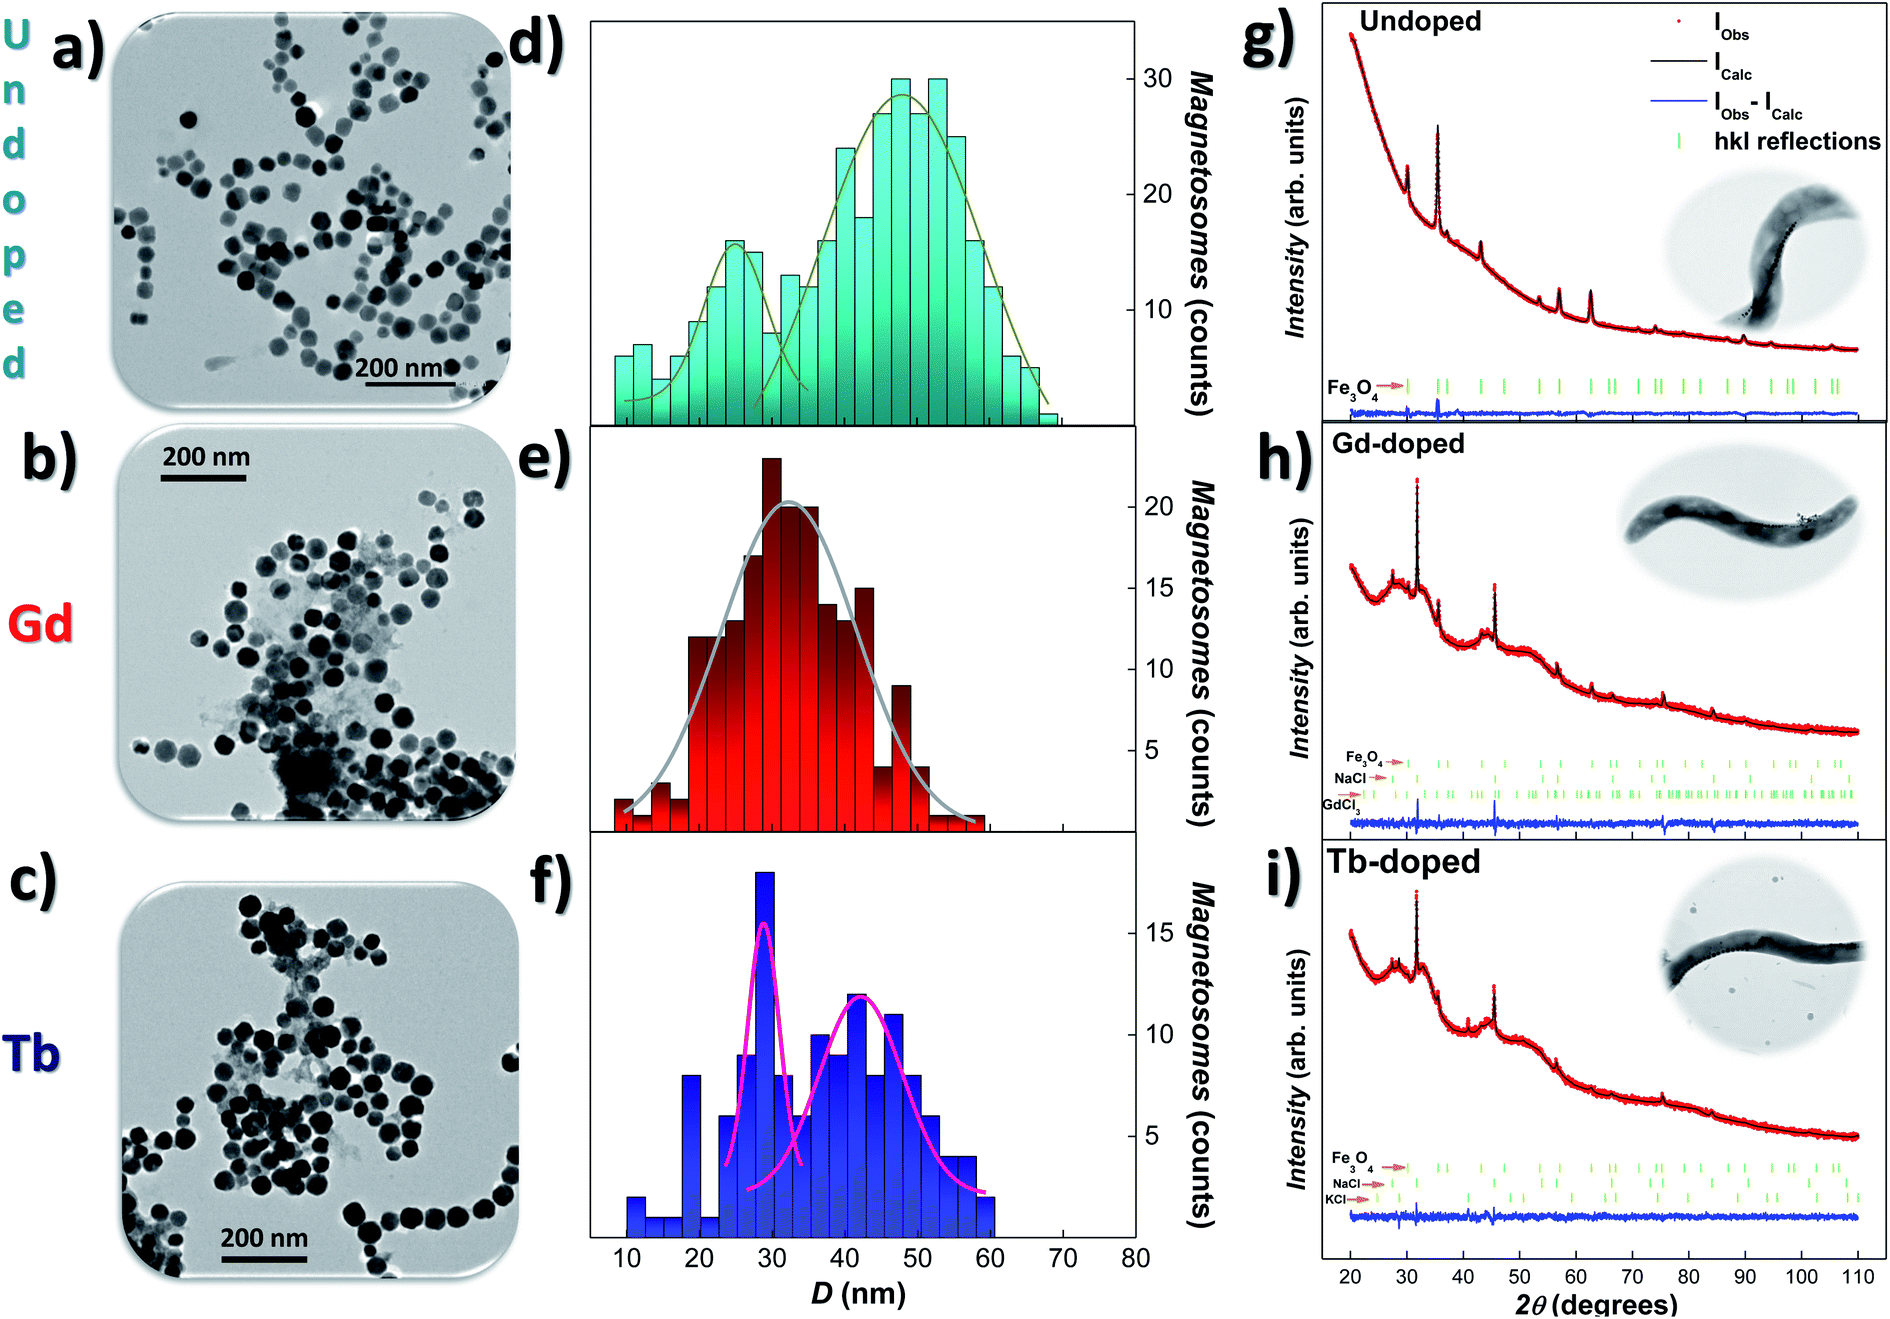 | ||
| Fig. 1 Representative TEM images (a)–(c) of the magnetosomes (extracted from the bacteria), size-distribution histograms (d)–(f) and XRD patterns (g)–(i), together with Rietveld refinements, corresponding to the undoped, Gd- and Tb-doped bacteria, respectively. The size-distributions are fitted with Gaussian distribution. In (g)–(i), the position of the hkl reflections are marked below the XRD patterns in green lines. In all cases, the Fe3O4 phase gives rise to the most intense peaks. XRD refinements for the undoped bacteria are reproduced from ref. 9 with permission. Insets in XRD show a representative TEM image of M. gryphiswaldense bacteria. | ||
| Sample | Undoped | Gd-doped | Tb-doped |
|---|---|---|---|
| 〈D〉 (nm) | 47(8), 22(8) | 33(9) | 42(6), 29(2) |
| N | 20 | 27 | 27 |
| a (Å) | 8.3985(2) | 8.3598(3) | 8.3815(1.1) |
X-ray diffraction (XRD) analyses were performed to detect the possible presence of internal structural changes in the RE-doped magnetosomes. Fig. 1(g)–(i) show the XRD patterns for the undoped, Gd- and Tb-doped bacterial samples, respectively, together with the corresponding Rietveld refinements41 (background was effectively subtracted during the analysis). The obtained Bragg errors RB are always below 4% for Gd-doped, and 15% for Tb-doped samples, ensuring the reliability of the performed analysis. The peak identification of the XRD patterns, as shown by the vertical green bars below them, has confirmed the presence of magnetite (Fe3O4) in both RE-doped bacteria (25.2(3)% content for Gd-, and 12.31(1)% for Tb-doped bacteria). Apart from the Fe3O4 phase, the XRD patterns also present some reflections corresponding to NaCl (66.0(2)% for Gd-, and 68.66(1)% Tb-doped bacteria) and KCl salts (8.5(1)% for Tb-doped bacteria). These contributions come from the PBS medium employed for washing the harvested bacteria. Besides, a poorly crystallised contribution related to the GdCl3 salt (8.8%) has also been shown in Fig. 1(h). We must clarify that the XRD contributions of these additional salts are well differentiated from the one corresponding to the magnetosomes, and therefore they do not affect the analysis of the Fe3O4 phase.
Rietveld refinements shown in Fig. 1(g)–(i) (black colour) corroborate the presence of well-formed crystalline magnetosomes in the undoped and RE doped bacteria. The obtained lattice parameters for each ensemble are a = 8.3598(3) Å for Gd-doped, and a = 8.3815(1.1) Å for Tb-doped samples. These values are slightly reduced (<0.4%) with respect to the one typically reported for bulk Fe3O4 (a = 8.397 Å)42 and undoped magnetosomes (a = 8.3985(2) Å).9 This slight contraction of the unit cell parameter could in principle seem counterintuitive, since the ionic radius of Gd3+ (1.08 Å) and Tb3+ (1.06 Å) is larger than that of Fe3+ (0.63–0.78 Å) or Fe2+ (0.92 Å).36,43 Nevertheless, similar reductions in the lattice parameter have been reported in other RE-doped Fe3O4 nanoparticles, and understood in terms of the RE-mediated strain44 and/or surface stress.45
Rietveld refinements also provide information on the mean diameter and microstrain. The obtained values of the mean diameter 〈D〉 of the magnetosomes are 34.8(2) nm for the Gd-doped, and 32.7(3) nm for Tb-doped samples, values that are in good agreement with the results obtained by TEM (see above), confirming the single crystalline nature of the magnetosomes. On the other hand, microstrain values of η = 1.92(9)% (Gd) and η = 3.9(1)% (Tb) have been obtained. These strain values indicate that the presence of both doping ions distorts the crystalline structure of the Fe3O4 magnetosomes. Similar results have been reported for other doped magnetosomes.22,25,26
At this point, TEM and XRD results have revealed that the crystalline structure of the magnetosome is mostly maintained despite the presence of Gd and Tb ions inside the Fe3O4 lattice. This structural characterisation has been completed by investigating the incorporation of the Gd and Tb ions into the magnetosomes using XANES. XANES is a very powerful element-sensitive synchrotron technique that has provided us accurate information on the oxidation state and site occupancy of the Gd and Tb ions in the spinel structure of magnetite.26,46
XANES experiments were carried out on Gd- and Tb-doped magnetosomes, extracted from the bacteria, both at the Fe–K and RE-L3 edges. Since the XANES signal of the RE salts attached to the bacterial body is so large that it masks any signal due to the RE doped magnetosomes, this time we have worked with isolated magnetosomes instead of the whole bacteria in order to avoid this effect. Fig. 2(a) and (b) show the XANES spectra for the Gd- and Tb-doped magnetosomes at the Gd-L3 (7243 eV) and Tb-L3 (7514 eV) edges, respectively. The presence of a clear absorption edge for both samples is an indicator of the incorporation of both Tb and Gd into the magnetosome structure. Nevertheless, we cannot completely discard the possibility of the presence of some Gd/Tb salts attached to the membrane of the magnetosomes, despite the multiple washings to remove any remaining salts after extraction. It should also be noted that, regardless the low Tb-content would, in principle, have led to measuring the Tb-L3 edge in fluorescence mode, the emission lines of Tb-L3 overlap with the Fe–K ones, imposing the use of transmission measuring mode. Hence, the normalised transmission spectrum shown in Fig. 2(b) corresponds to an extremely low absorption jump. It is also noticeable that the high absorption white line for the RE-doped magnetosomes, associated with the number of holes in the 5d band (valence) and the location of the 5d states. The overall shapes of the XANES spectra resemble those of the reference compounds shown in Fig. 2, i.e., GdCl3 and Tb(NO3)3. The overlapping edge position is a clear-cut indicator of the oxidation state of the absorbing atom,47 indicating that the oxidation state of the RE ions inside magnetosomes is that of RE3+.
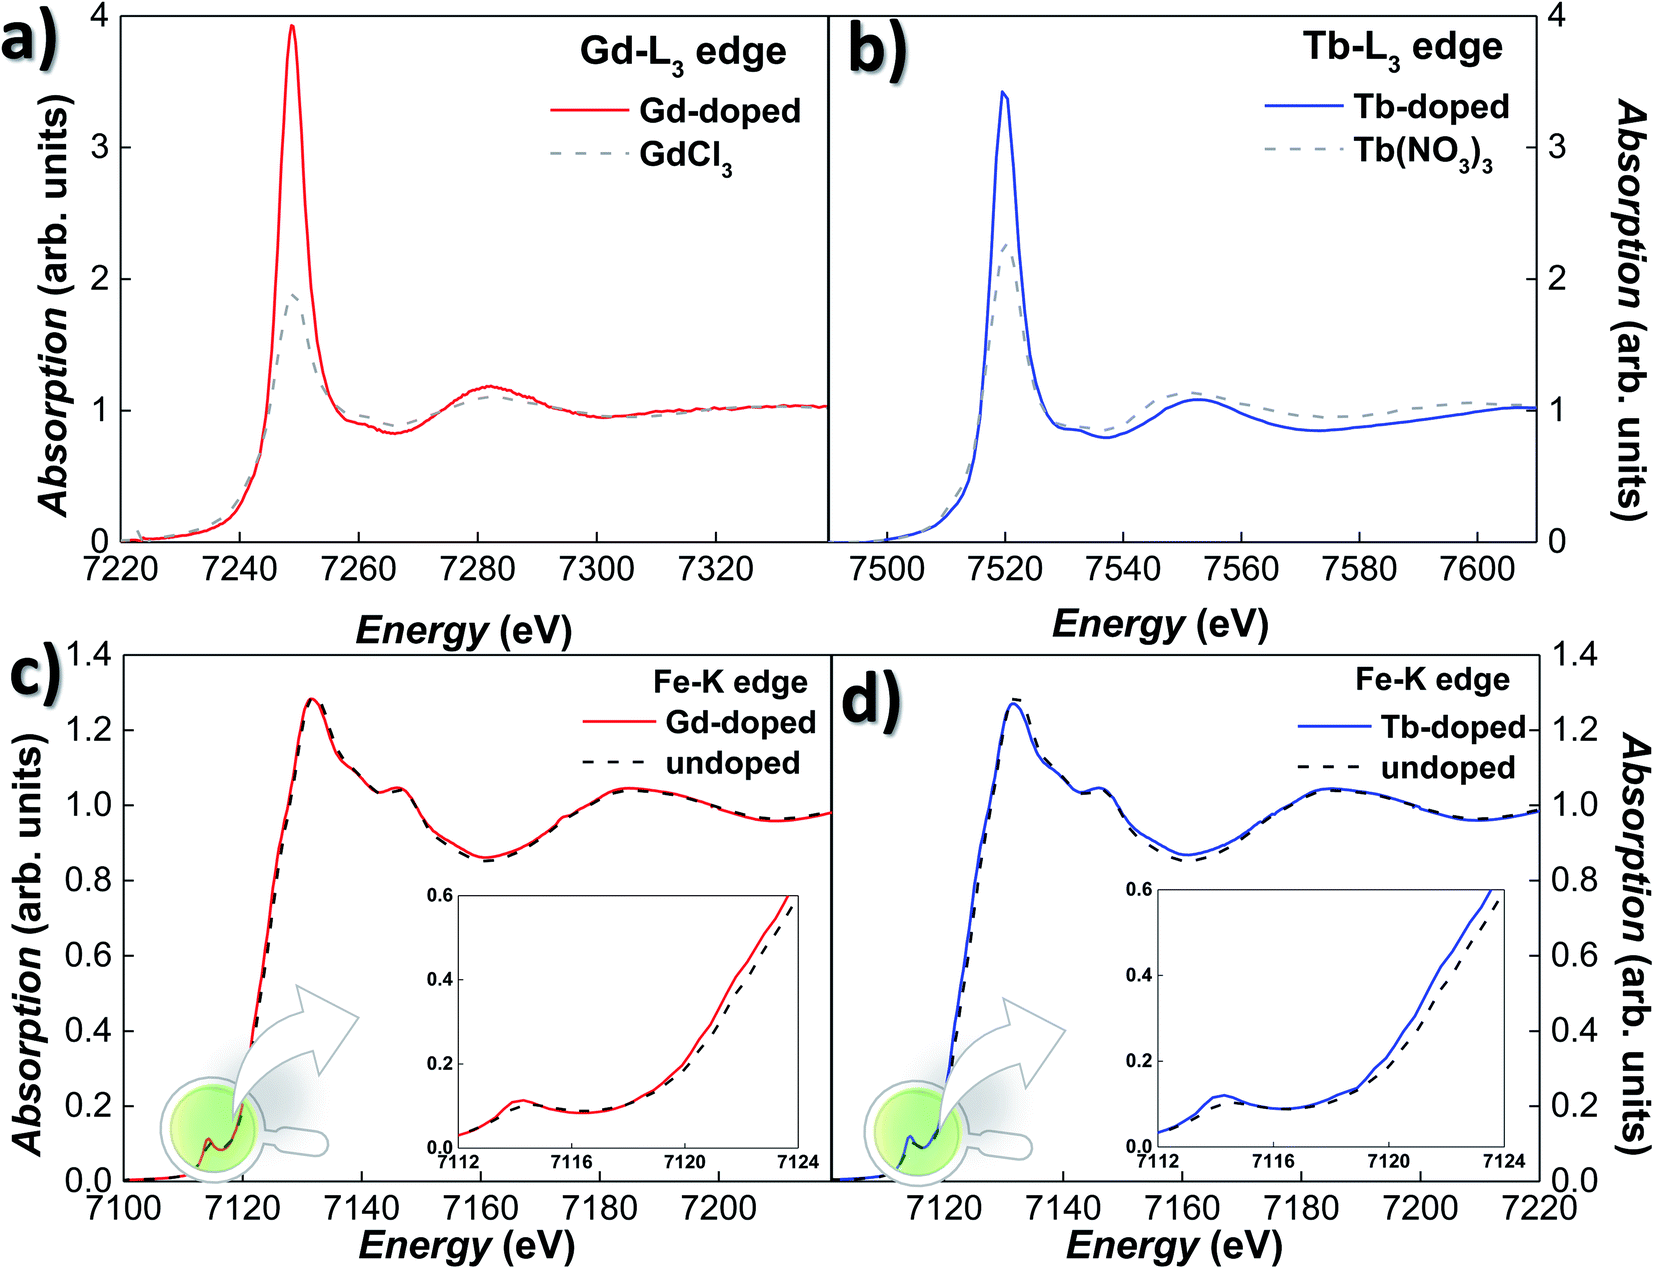 | ||
| Fig. 2 (a) and (b) normalised Gd- and Tb-L3-edge XANES spectra for Gd- and Tb-doped magnetosomes, respectively. The corresponding XANES spectrum for the GdCl3 and Tb(NO3)3 reference samples have been included for comparison. (c) and (d) normalised Fe–K edge XANES spectra of magnetosomes from Gd- and Tb-doped magnetosomes, respectively. The control spectrum (i.e., undoped magnetosomes) has been included as the reference. The insets show the pre-edge and edge regions in more detail. | ||
The incorporation of the RE3+ ions into the Fe3O4 structure of the magnetosomes is further confirmed by absorption measurements on the Fe K-edge. Fig. 2(c) and (d) show the Fe K-edge XANES spectra of the Gd- and Tb-doped magnetosomes, together with undoped magnetosomes. As shown, the Fe K-edge spectra for both Gd- and Tb-doped magnetosomes are very alike, and they qualitatively reproduce the shape of the spectrum recorded for the control magnetosomes. However, for both the Gd- and Tb- doped magnetosomes, there is a minor damping of the oscillations of the XANES spectra, that can be traced for instance, in the white line (∼7131 eV) and the valley (∼7160 eV) amplitudes. A similar damping has been observed in XANES of magnetite nanoparticles when the purity and/or crystallinity of magnetite is slightly reduced.47,48 On top of that, a displacement towards lower energies of the absorption edge can be observed, while for the undoped magnetosomes, the absorption edge is located at 7123.1 eV, being its position shifted towards 7122.5 eV for both RE-doped magnetosomes. Therefore, this negative shift of 0.6 eV could indicate a reduction of the average valence state of Fe in the RE-doped magnetosomes. Considering that the difference between the edge position for Fe2+ and Fe3+ is ∼7 eV, we can estimate the valence of the RE-doped magnetosomes to be ≈2.55–2.57, while in the undoped MTB, the valence is 2.66. This estimation has been made taking into account the fact that the edge position depends linearly on the valence, therefore, a substitution of approximately 3–4% of Fe3+ ions by Gd3+ or Tb3+ can account for the aforementioned valence reduction. In order to obtain a more accurate estimate, additional techniques such as X-ray magnetic circular dichroism may prove useful. At the same time, an increase in the pre-edge peak amplitude can also be observed for the RE-doped magnetosomes. This modification reflects a change of the symmetry around the Fe atoms, towards a more non-centrosymmetric site. Therefore, these results suggest a reduction in the number of the centrosymmetric octahedral sites occupied by Fe3+ ions, as a consequence of their substitution by Gd3+ and Tb3+ ions.
3.2 Magnetic characterisation
The magnetic response of the doped-MTB has been analysed by tracing the M vs. T and M vs. H dependence. All the measurements were performed in whole bacteria in order to minimise the effect of the interchain interactions, but also to allow a better comparison with the results obtained for undoped bacteria.26,49Fig. 3(a) shows the ZFC–FC curves of the RE-doped and undoped bacteria, shifted in the Y-axis for clarity purposes. Starting with the undoped sample, the M vs. T curves present a strong irreversibility in the whole temperature range studied, and a sharp transition in the ZFC curve around TV ∼ 105 K, which is also accompanied by a smaller peak in the FC curve. This transition corresponds to the well-known Verwey transition, constituting a fingerprint of the presence of stoichiometric magnetite.13,50 Concerning the Gd- and Tb-doped bacteria, their overall M vs. T evolution is very similar to the one of the undoped bacteria. The ZFC–FC curves evidence clear irreversibility, and the presence of the Verwey transition is also evident, although it seems to be now slightly displaced towards lower T values, ∼95 K for the Gd-doped and ∼99 K for Tb-doped bacteria. This displacement becomes more evident by comparing the derivatives of the ZFC curves for the three samples, as shown in Fig. 3(b). There, we can observe that the TV, marked by the point at which the derivative becomes null, is slightly shifted towards lower values for both the Gd- and Tb-doped bacteria. In addition, the peak of the derivative, which marks the onset of the transition, is broader, less intense, and also displaced towards lower temperatures for the RE-doped bacteria. It must be noted that the survival of the Verwey transition in magnetite nanoparticles is strongly dependent on the crystallinity and stoichiometry. Small changes in the magnetite structure, for example by doping with other elements or by creating defects/vacancies,12,26,51 can quickly lead to the displacement and disappearance of this transition. Finally, on the low-temperature side, a strong paramagnetic contribution appears in both RE doped bacteria below T ∼ 25 K. This is caused by the presence of the Gd and Tb salts attached to the bacterial body, as shown by the TEM images (see Fig. S1 and S2 in the ESI†).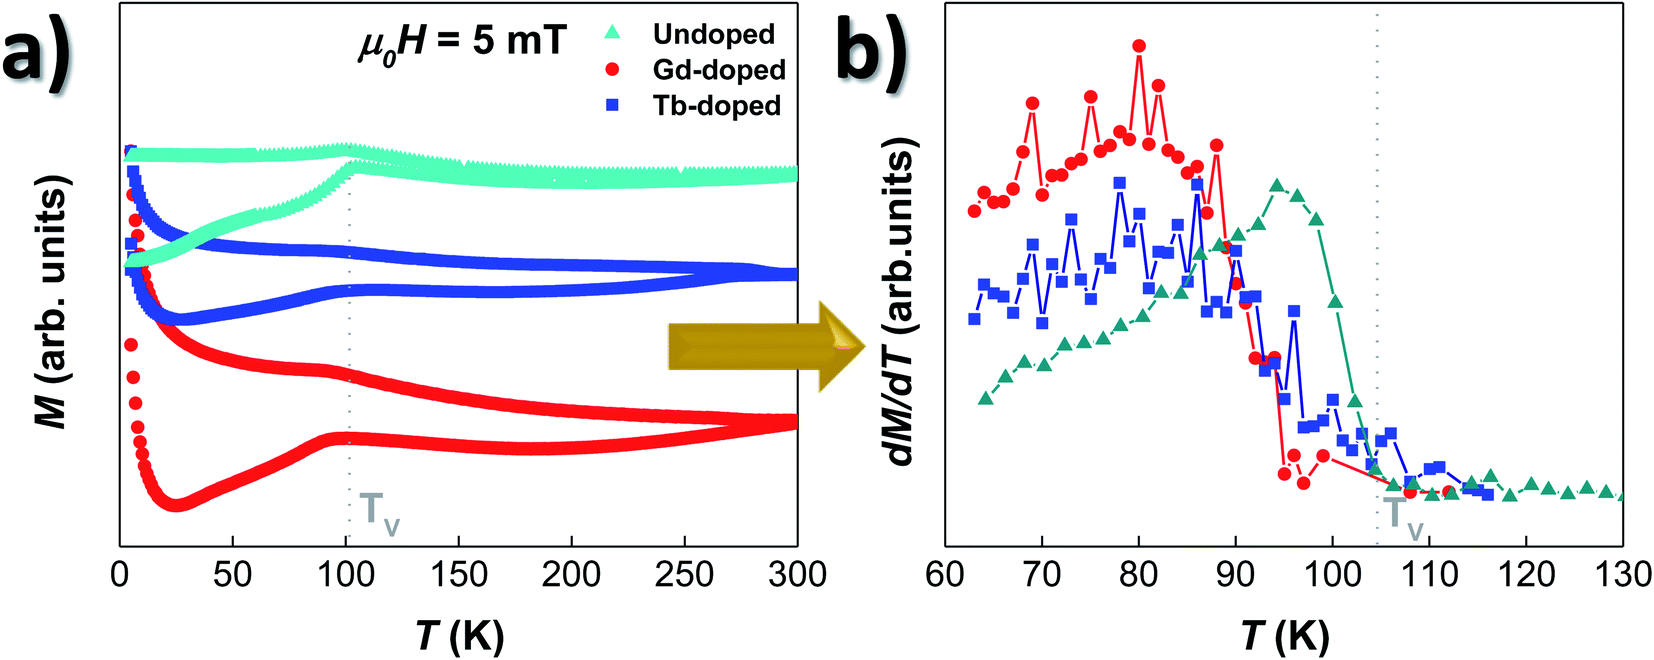 | ||
| Fig. 3 (a) M–T curves measured following the ZFC–FC protocol for the undoped (cyan), Gd- (red) and Tb-doped (blue) MTB. Note that the curves are displaced in the Y-axis for clarity purposes. (b) Derivatives of the ZFC magnetisation curves (dM dT−1) of these three samples. In both (a) and (b), the measurements for undoped MTB are included for comparison purposes, and the position of the Verwey transition corresponding to the undoped bacteria is marked with a gray line. | ||
To further explore the magnetic behaviour of the Gd- and Tb-doped magnetosomes, we have also analysed their magnetic response as a function of the applied magnetic field. Hysteresis loops, M vs. H, have been measured at different temperatures, from 5 to 300 K, after a cooling process with either no applied magnetic field (zero-field-cooling, ZFC) or with an applied field of 1 T (field-cooling, FC). We have included several of these M vs. H loops in Fig. S3 of the ESI.† Here it can be seen that at 300 K, the M vs. H loops of the 3 samples (undoped, Gd-doped, and Tb-doped) are very similar, whereas clear differences emerge when decreasing the temperature, especially, below the Verwey temperature (∼100 K). Fig. 4 shows the thermal evolution of the most relevant hysteresis parameters, i.e., the coercive field, μ0HC (left panels), and the magnetisation remanence, normalised by the saturation magnetisation, Mr/Ms (right panels). These have been measured under ZFC (top), and FC (middle) protocols, to finally compare them by plotting the difference (in absolute value) between the FC and ZFC values (bottom). There, in all cases (ZFC, FC and difference), it can be seen that either the coercive field or the remanent magnetisation corresponding to the doped and undoped bacteria no longer overlap below TV, getting more and more differentiated with decreasing temperature, all the way down to 5 K. The same happens for the M vs. H loops shown in Fig. S3 of the ESI†.
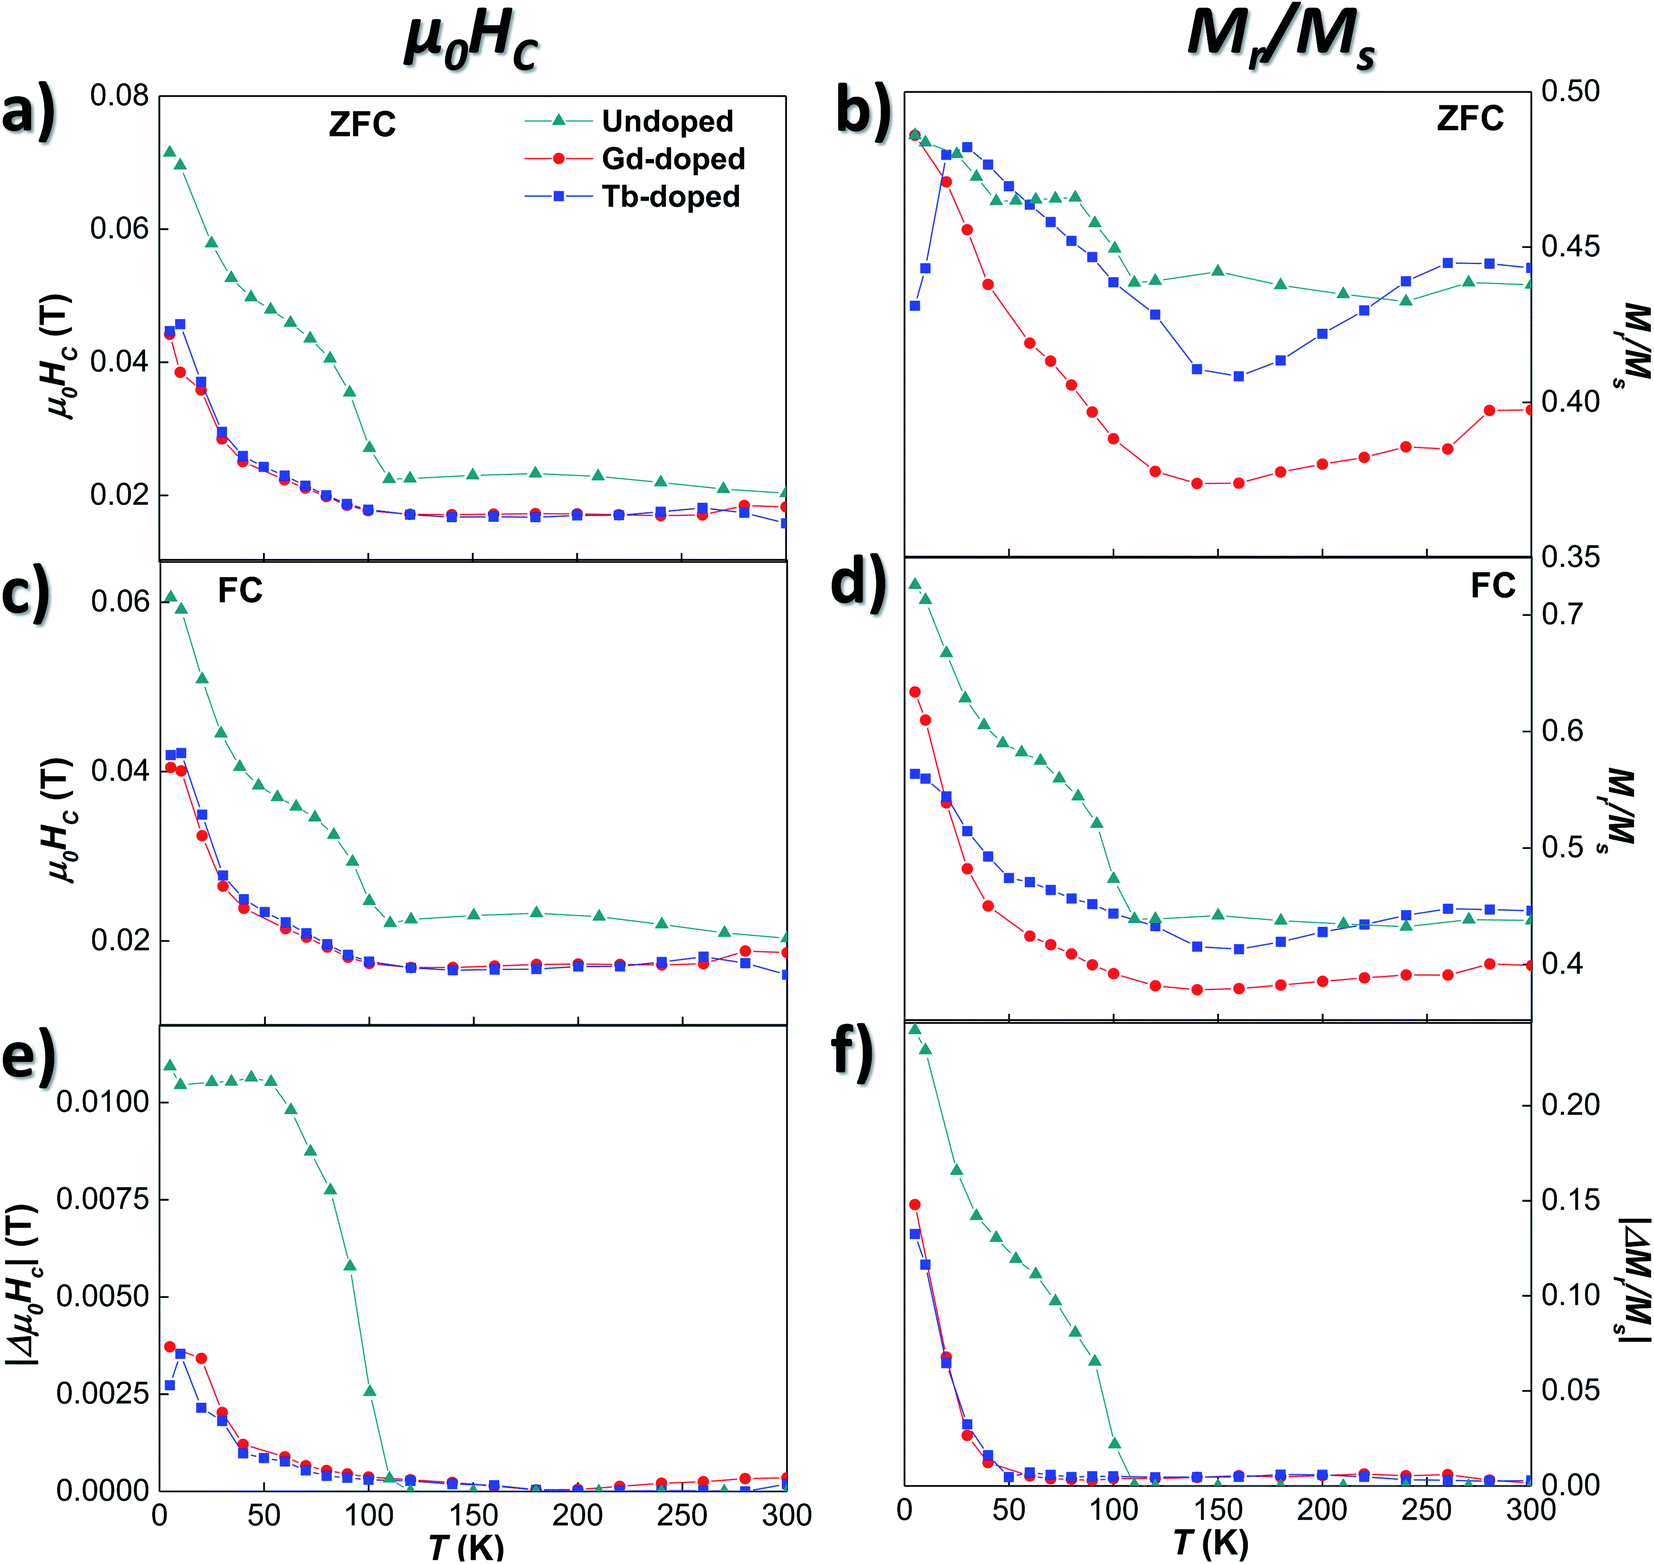 | ||
| Fig. 4 Evolution with T of the coercive field, μ0HC, ((a), (c) and (e)), and the normalised remanence, Mr/Ms ((b), (d) and (f)) for the undoped, Gd-, and Tb-doped bacteria. Samples were cooled under no field (ZFC, (a) and (b)), and under a field of 1 T (FC, (c) and (d)). (e) and (f) depict the difference between FC and ZFC measurements, in absolute value, of the μ0HC and the Mr/Ms values. | ||
We will now analyse the coercive field and remanence magnetisation in greater detail. Concerning the coercive field, both the ZFC and FC coercive field curves for the doped bacteria [Fig. 4 (a) and (c)] remain nearly constant down to 100 K, with a lower μ0HC value (∼0.017 T) than the undoped bacteria (∼0.023 T). Then, the μ0HC slowly increases up to ∼0.024 T at 50 K, and finally rises more steeply reaching a value of ∼0.045 T at 5 K, again smaller than the one obtained for the undoped bacteria. The differences in coercivity between RE-doped and undoped magnetosomes can be seen more clearly if we focus on Fig. 4(e), where the difference between ZFC and FC values, |Δμ0HC| curves, is shown. The Verwey transition, delimited by the non-zero value of |Δμ0HC|, is clearly defined around 107 K for the undoped bacteria, while in the case of the Gd- and Tb-doped samples, this transition is less abrupt and smoother. This result agrees well with the magnetic behaviour observed in the ZFC/FC M vs. T curves, indicating that the RE ions inside the magnetosomes, on one hand, reduce the effective anisotropy, and, on the other hand, slightly modify the Verwey transition due to minor structural changes.
These results are further supported by the Mr/Ms curves shown in Fig. 4(b), (d), and (f). There, it can be seen how the shoulders found at T ∼107 and 50 K for the undoped bacteria become smooth and broadened in the case of the RE-doped bacteria. Although some small differences can be observed between the values of the Mr/Ms curves of the Gd- and Tb-doped samples, when plotting the change of remanence |ΔMr/Ms| in Fig. 4(f), both curves overlap, as for |Δμ0HC|. Following a similar evolution to that of the |Δμ0HC| curves shown in (e), |ΔMr/Ms| for the RE-doped magnetosomes remains very small (<0.005) down to 90 K. Then, it slowly starts increasing up to ∼0.01 at 50 K, and below that temperature, the increase becomes more abrupt, although the maximum values reached (∼0.18) are again smaller than those obtained for the undoped magnetosomes (∼0.24). A comparison between the thermal evolution of |Δμ0HC| and |ΔMr/Ms| of the undoped, Gd-doped, Tb-doped, and Mn-doped bacterial samples is presented in Fig. S4 of the ESI†.
In order to shed light on the specific changes that are taking place in the intrinsic magnetic properties of the Gd- and Tb-doped samples, we have carried out magnetic simulations of the M vs. H loops measured at different temperatures. For this, we have employed a modified Stoner–Wohlfarth approach, which has been extensively described in our previous studies.4,27 Briefly, the equilibrium configuration of the magnetic moment of each magnetosome is calculated as the sum of three contributions: (i) the magnetocrystalline anisotropy energy, EC; (ii) the effective uniaxial anisotropy energy, Euni, arising from the competition between the magnetosome shape anisotropy and the dipolar interactions between magnetosomes inside the chain; and (iii) the Zeeman energy term, EZ.26,52 In spherical coordinates, considering the 〈100〉 crystallographic directions of magnetite as the reference system, the total energy density is given by:
| E(θ,ϕ) = EC(θ,ϕ) + Euni(θ,ϕ) + EZ(θ,ϕ) | (1) |
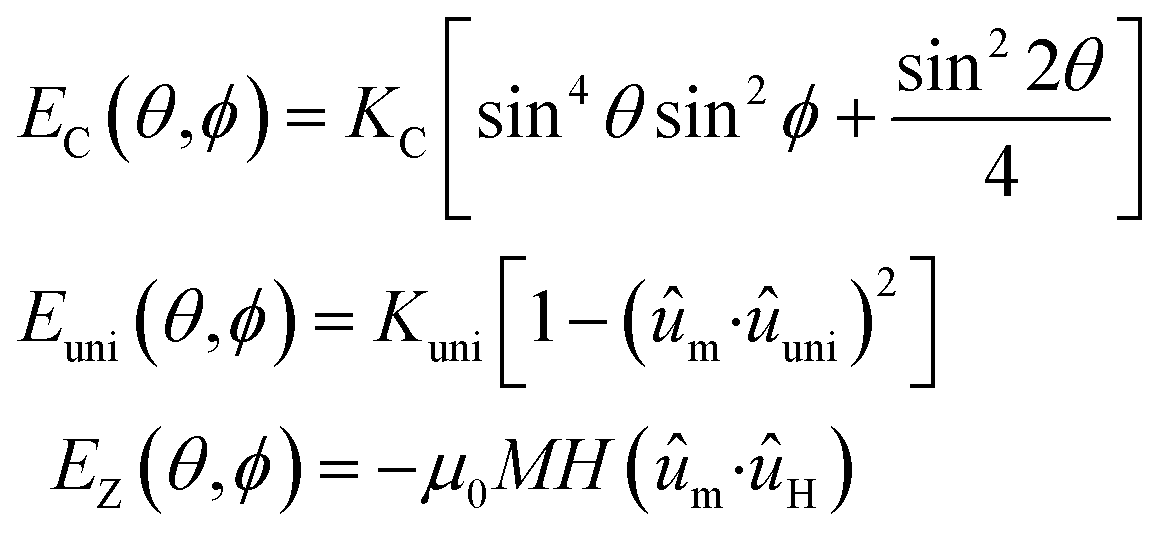 | (2) |
Based on these considerations, the ZFC M vs. H loops at different temperatures have been simulated employing the dynamical approach already described in ref. 52 and 53. The anisotropy terms, KC and Kuni, have been adjusted to attain the best match between experimental M vs. H loops and the corresponding simulations. As shown in Fig. 5(a)–(f), the calculated loops closely follow the experimental ones. The thermal evolution of KC and Kuni for the undoped, Gd- and Tb-doped samples is shown in Fig. 5(g) and (h). At room temperature, the values of KC for the three samples are similar: −11.0 kJ m−3 for the undoped and Gd-doped samples, and −12.0 kJ m−3 for the Tb-doped sample. These values are close to the theoretical KC value for bulk magnetite, −10.8 kJ m−3. With decreasing temperature, |KC| (in absolute value) slightly increases for the undoped and Gd-doped bacteria, while it instead decreases for the Tb-doped sample, but overall, the change is small, remaining around |KC| ≈ 11–12 kJ m−3. However, below 180 K, |KC| tends to decrease for the undoped sample, becoming null at 110 K, around the Verwey transition. This indicates that the role of the cubic magnetocrystalline anisotropy becomes negligible below TV for the undoped magnetosomes, as reported before.26,27 A similar behaviour is also observed for the RE doped bacteria, but the drop in |KC| is displaced towards lower temperatures for both the Gd- and Tb-doped bacteria, becoming practically null at ∼90 and ∼100 K, respectively. This follows the same trend observed in the ZFC–FC curves, which indicates, again, that the incorporation of RE ions into the magnetite structure is modifying the Verwey transition. The particular differences in the KC values and evolution between Gd- and Tb-doped bacteria may be associated with differences in the incorporation of the Gd3+ and Tb3+-ions into the magnetosome structure.
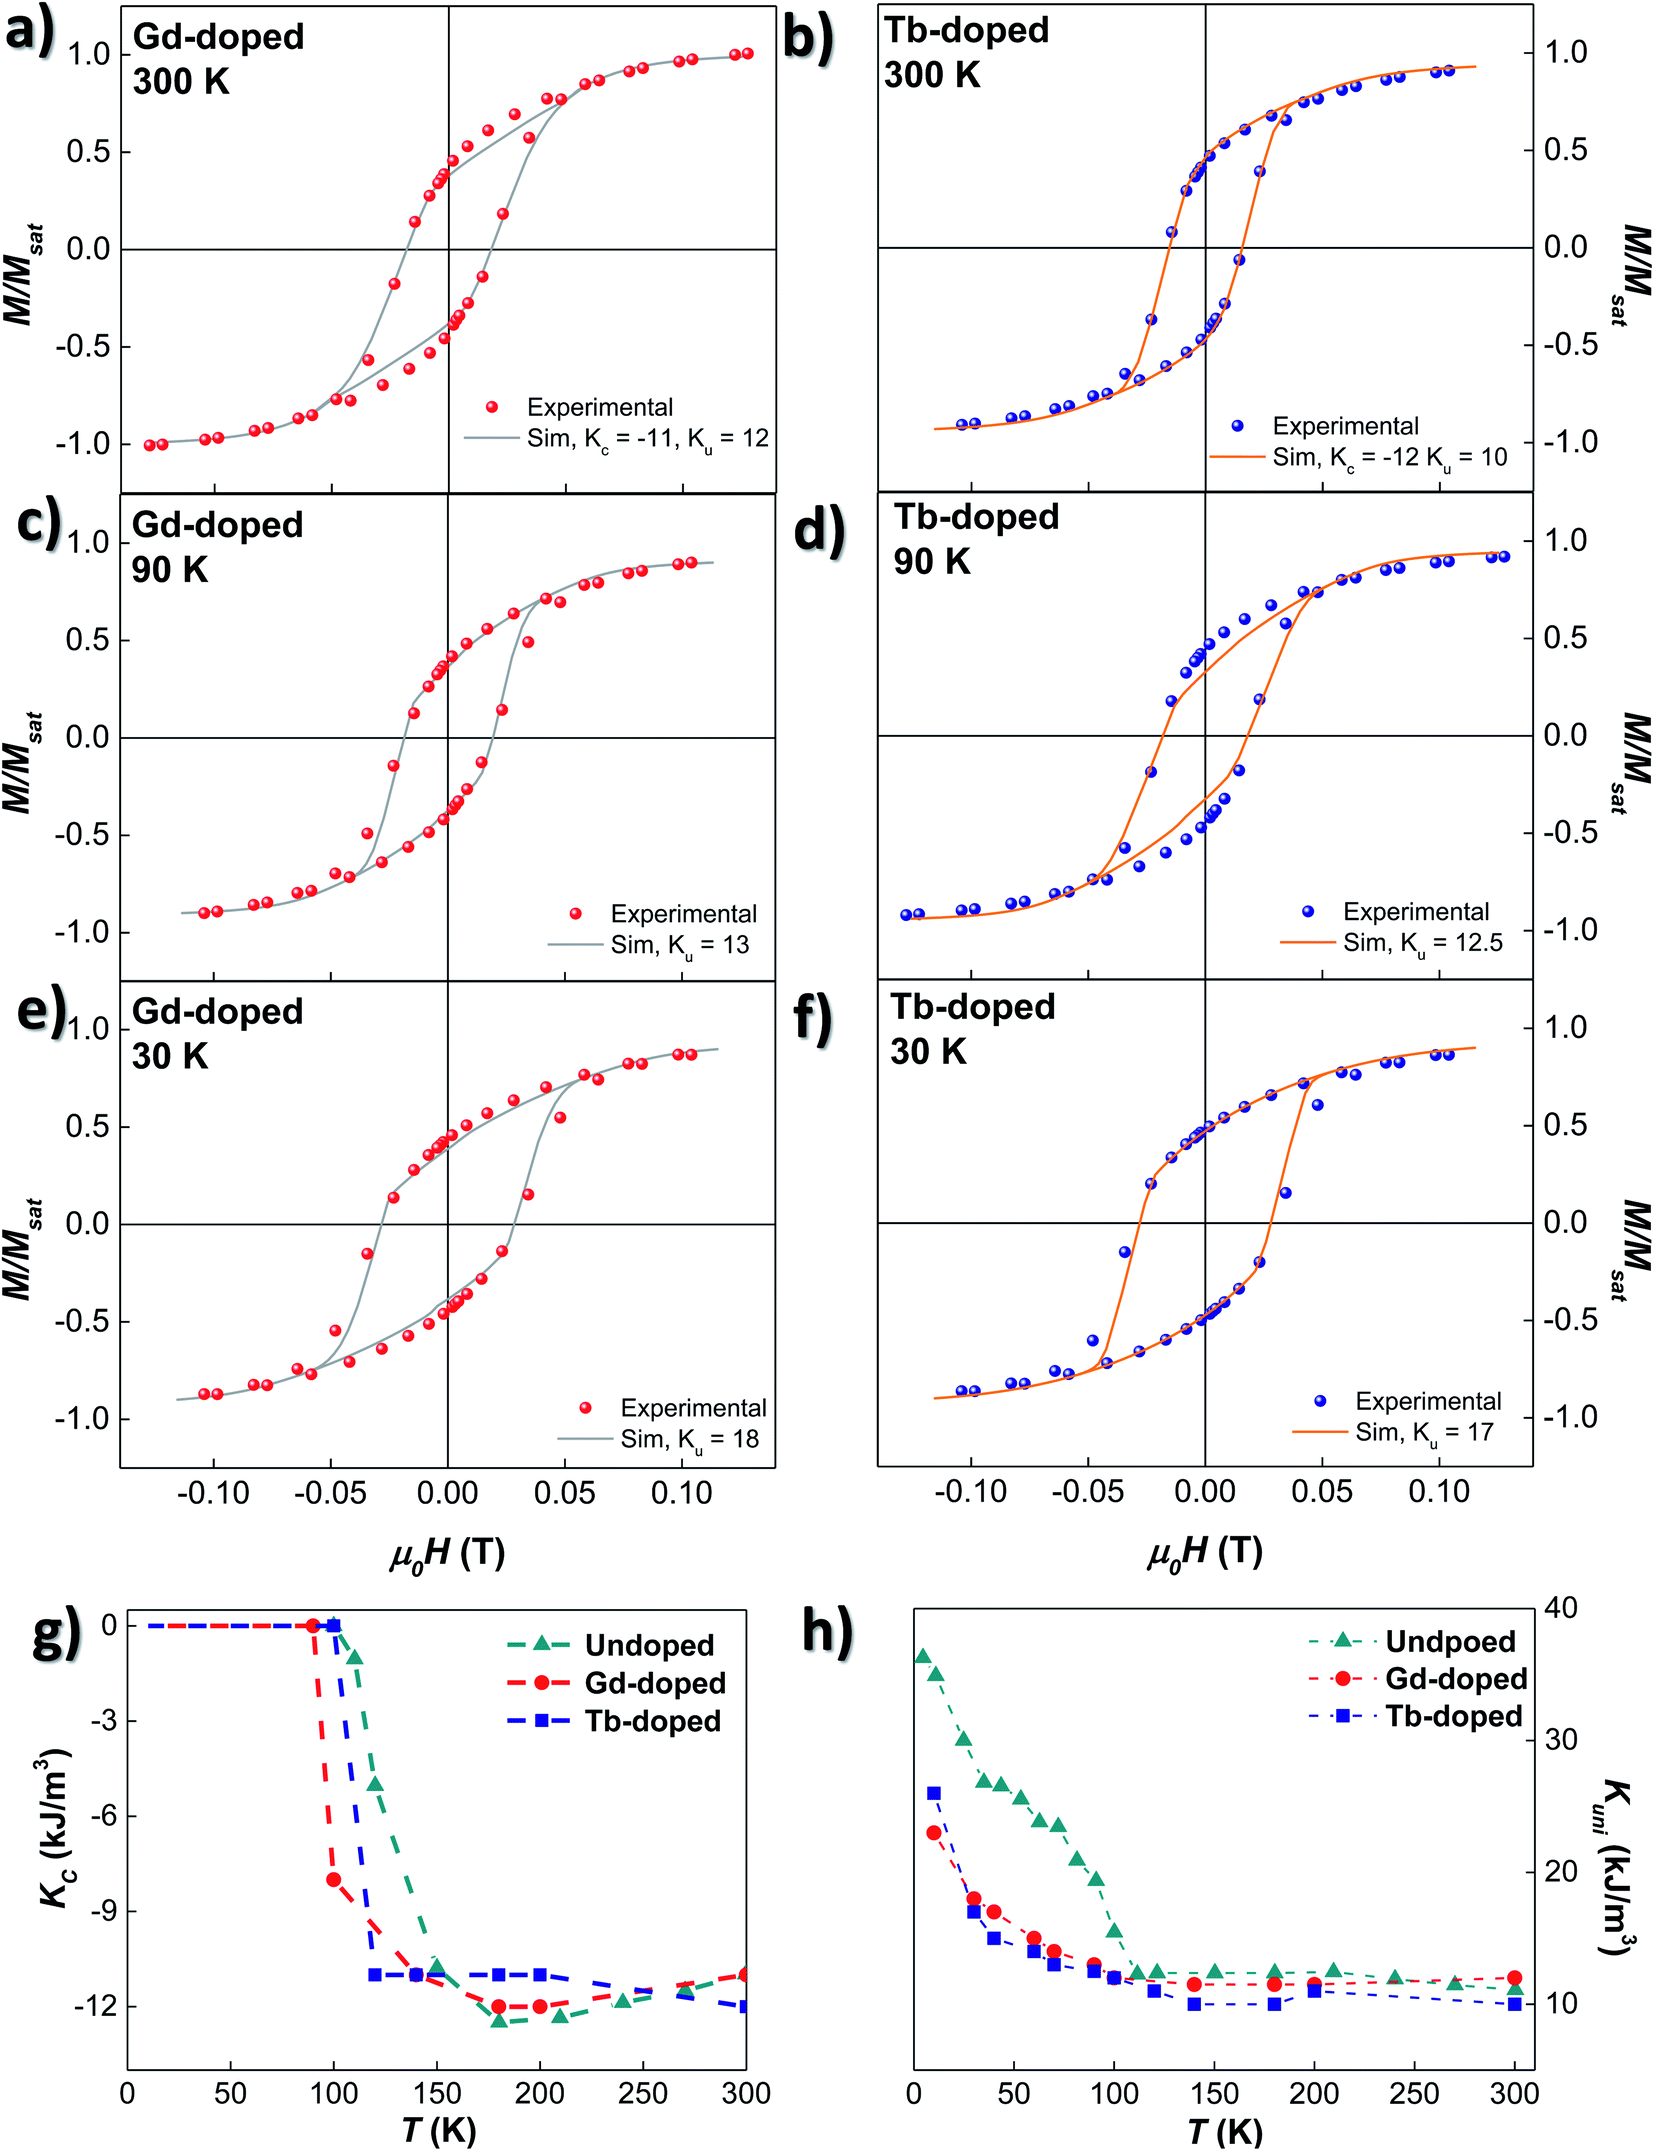 | ||
| Fig. 5 (a)–(f) Experimental (dots) and simulated (continuous line) M vs. H loops measured at T = 300, 90 and 30 K, for Gd- ((a), (c) and (e)) and Tb-doped bacteria ((b), (d) and (f)), respectively. (g) and (h) depict the thermal evolution of KC and Kuni extracted from the simulated M vs. H loops included in (a)–(f). For comparison purposes, values from the undoped MTB have also been calculated and inserted. | ||
Concerning the uniaxial anisotropy term, Kuni, it remains almost constant for the three samples down to TV: ∼11.5 kJ m−3 for the undoped and Gd-doped, and ∼10 kJ m−3 for the Tb-doped bacteria. In both cases, the Kuni value is smaller than the one obtained for the undoped magnetosomes (∼12 kJ m−3). Being above the Verwey transition, Kuni is mainly related to the effect of shape anisotropy and dipolar interactions, and this decrease could be ascribed to differences in the size distribution and/or morphology of the magnetosomes, as already observed in the TEM images. These differences are more appreciable in the case of the Tb-doped bacteria. Below TV, Kuni increases substantially for the undoped bacteria, up to 37 kJ m−3. However, for the Gd- and Tb-doped bacteria, the increase is slower, and the onset is not so well defined (90–100 K). Besides, the change in the slope obtained for Kuni of the undoped magnetosomes below 50 K is also present in the Gd- and Tb-doped bacteria, but is less obvious, especially in the case of the Gd-doped bacteria. In the end, at 10 K, a maximum Kuni value of 23 and 26 kJ m−3 is reached for the Gd- and Tb-doped bacteria, respectively. Qualitatively similar results were obtained in the case of Mn-doped bacteria.27
All these results clearly indicate that there is a modification of both the magnetocrystalline and uniaxial anisotropies in RE-doped magnetosomes. The changes above the Verwey transition can be most likely associated to modifications in the shape/size of the RE-doped magnetosomes in comparison to the undoped ones. On the other hand, at low temperatures, the observed changes in the evolution of magnetocrystalline anisotropy, together with the less abrupt increase of the uniaxial anisotropy, lead us to conclude that the substitution of Fe3+ ions by Gd3+ and Tb3+ is effectively modifying both the Verwey transition and the final monoclinic crystalline structure of the RE-doped magnetosomes. To the best of our knowledge, this is the first time that such a modification has been reported in the literature for magnetite nanoparticles doped with Gd or Tb.
4 Conclusions
In this work, we have been able to modify the magnetic properties of magnetotactic bacteria M. gryphiswaldense by doping them with magnetic rare earth ions Gd3+ and Tb3+. These rare earth ions are incorporated in a proportion of around 3–4% by substituting Fe3+ in octahedral positions, a substitution that barely modifies the magnetosome shape, size and chain morphology. The magnetite Fd3m crystalline structure is either almost unaffected by the RE-incorporation, despite the large difference in the atomic radii between RE3+ and Fe3+. However, the incorporation of Gd3+ and Tb3+, even if low in content, clearly modifies the magnetic response of the bacterial magnetosomes. This alteration is especially noticeable in the thermal evolution of the magnetic anisotropy contributions (magnetocrystalline, shape, and interactions) of the doped bacteria, which differs from the undoped ones, especially below the Verwey transition (smooth KC reduction, smaller Kuni). The decrease in uniaxial anisotropy can be related to small differences in the size distribution and morphology of RE-doped magnetosomes, whereas the low temperature changes in magnetocrystalline anisotropy indicate a modification of the final monoclinic crystalline structure at low temperatures due to the substitution of Fe3+ ions by Gd3+ and Tb3+.All in all, this work paves the way towards a better understanding of how the magnetic response of magnetite nanoparticles in general, and bacterial magnetosomes in particular, can be modified by the incorporation of RE3+ ions into the magnetite structure. The results presented in this study are not only of fundamental interest, but they also open the door to expanding the biomedical applications of magnetosomes by the incorporation of relevant RE ions.
Conflicts of interest
There are no conflicts to declare.Acknowledgements
This work was supported in part by the Spanish MCIN/AEI under Projects MAT2017-83631-C3-R and PID2020-115704RB-C33. The work of Elizabeth M. Jefremovas was supported by the “Concepción Arenal Grant” awarded by Gobierno de Cantabria and Universidad de Cantabria. The work of Lourdes Marcano was supported by the Postdoctoral Fellowship from the Basque Government under Grant POS-2019-2-0017. The authors would like to thank “Nanotechnology in translational hyperthermia” (HIPERNANO)-RED2018-102626-T. We thank the ALBA (CLAESS beamline) synchrotron radiation facilities and staff for the allocation of beamtime and assistance during the experiments.Notes and references
- D. A. Bazylinski, C. T. Lefèvre and B. H. Lower, Nanomicrobiology, Springer, 2014, pp. 39–74 Search PubMed.
- L. Yan, H. Da, S. Zhang, V. M. López and W. Wang, Microbiol. Res., 2017, 203, 19–28 CrossRef CAS PubMed.
- A. Muela, D. Munoz, R. Martin-Rodriguez, I. Orue, E. Garaio, A. Abad Diaz de Cerio, J. Alonso, J. A. García and M. L. Fdez-Gubieda, J. Phys. Chem. C, 2016, 120, 24437–24448 CrossRef CAS.
- D. Gandia, L. Gandarias, I. Rodrigo, J. Robles-García, R. Das, E. Garaio, J. Á. García, M.-H. Phan, H. Srikanth and I. Orue, et al. , Small, 2019, 15, 1902626 CrossRef CAS PubMed.
- E. Alphandéry, Front. Bioeng. Biotechnol., 2014, 2, 5 Search PubMed.
- E. Alphandéry, I. Chebbi, F. Guyot and M. Durand-Dubief, Int. J. Hyperth., 2013, 29, 801–809 CrossRef PubMed.
- A. S. Mathuriya, Biotechnol. Lett., 2015, 37, 491–498 CrossRef CAS PubMed.
- Z. Nemati, M. R. Zamani Kouhpanji, F. Zhou, R. Das, K. Makielski, J. Um, M.-H. Phan, A. Muela, M. Fdez-Gubieda and R. R. Franklin, et al. , Nanomaterials, 2020, 10, 1662 CrossRef CAS PubMed.
- E. M. Jefremovas, L. Gandarias, I. Rodrigo, L. Marcano, C. Grüttner, J. Á. García, E. Garayo, I. Orue, A. García-Prieto and A. Muela, et al. , IEEE Access, 2021, 9, 99552–99561 Search PubMed.
- M. Fdez-Gubieda, J. Alonso, A. García-Prieto, A. García-Arribas, L. Fernández Barquín and A. Muela, J. Appl. Phys., 2020, 128, 070902 CrossRef CAS.
- A. U. Gehring, H. Fischer, M. Charilaou and I. García-Rubio, Geophys. J. Int., 2011, 187, 1215–1221 CrossRef CAS.
- L. Marcano, A. García-Prieto, D. Muñoz, L. F. Barquín, I. Orue, J. Alonso, A. Muela and M. Fdez-Gubieda, Biochim. Biophys. Acta, Gen. Subj., 2017, 1861, 1507–1514 CrossRef CAS PubMed.
- R. Moreno, S. Poyser, D. Meilak, A. Meo, S. Jenkins, V. K. Lazarov, G. Vallejo-Fernandez, S. Majetich and R. F. Evans, Sci. Rep., 2020, 10, 1–14 CrossRef PubMed.
- R. Prozorov, T. Prozorov, S. K. Mallapragada, B. Narasimhan, T. J. Williams and D. A. Bazylinski, Phys. Rev. B: Condens. Matter Mater. Phys., 2007, 76, 054406 CrossRef.
- D. Gandia, L. Gandarias, L. Marcano, I. Orue, D. Gil-Cartón, J. Alonso, A. García-Arribas, A. Muela and M. L. Fdez-Gubieda, Nanoscale, 2020, 12, 16081–16090 RSC.
- G. Goya, T. Berquo, F. Fonseca and M. Morales, J. Appl. Phys., 2003, 94, 3520–3528 CrossRef CAS.
- A. Mitra, J. Mohapatra, S. Meena, C. Tomy and M. Aslam, J. Phys. Chem. C, 2014, 118, 19356–19362 CrossRef CAS.
- J. J. Jacob and K. Suthindhiran, Mater. Sci. Eng. C, 2016, 68, 919–928 CrossRef CAS PubMed.
- D. Faivre and D. Schuler, Chem. Rev., 2008, 108, 4875–4898 CrossRef CAS PubMed.
- I. Castellanos-Rubio, O. Arriortua, L. Marcano, I. Rodrigo, D. Iglesias-Rojas, A. Barón, A. Olazagoitia-Garmendia, L. Olivi, F. Plazaola and M. L. Fdez-Gubieda, et al. , Chem. Mater., 2021, 33, 3139–3154 CrossRef CAS PubMed.
- Y. Orooji, M. H. Irani-Nezhad, R. Hassandoost, A. Khataee, S. R. Pouran and S. W. Joo, Spectrochim. Acta, Part A, 2020, 234, 118272 CrossRef CAS PubMed.
- J. Li, N. Menguy, M.-A. Arrio, P. Sainctavit, A. Juhin, Y. Wang, H. Chen, O. Bunau, E. Otero and P. Ohresser, et al. , J. R. Soc., Interface, 2016, 13, 20160355 CrossRef PubMed.
- S. Staniland, W. Williams, N. Telling, G. Van Der Laan, A. Harrison and B. Ward, Nat. Nanotechnol., 2008, 3, 158–162 CrossRef CAS PubMed.
- T. Prozorov, T. Perez-Gonzalez, C. Valverde-Tercedor, C. Jimenez-Lopez, A. Yebra-Rodriguez, A. Körnig, D. Faivre, S. K. Mallapragada, P. A. Howse and D. A. Bazylinski, et al. , Eur. J. Mineral., 2014, 26, 457–471 CrossRef CAS.
- M. Tanaka, R. Brown, N. Hondow, A. Arakaki, T. Matsunaga and S. Staniland, J. Mater. Chem., 2012, 22, 11919–11921 RSC.
- L. Marcano, D. Muñoz, R. Martin-Rodriguez, I. Orue, J. Alonso, A. García-Prieto, A. Serrano, S. Valencia, R. Abrudan and L. Fernandez Barquin, et al., J. Phys. Chem. C, 2018, 122, 7541–7550 CrossRef CAS.
- L. Marcano, I. Orue, A. García-Prieto, R. Abrudan, J. Alonso, L. Fernández Barquín, S. Valencia, A. Muela and M. L. Fdez-Gubieda, J. Phys. Chem. C, 2020, 124, 22827–22838 CrossRef CAS.
- D. Muñoz, L. Marcano, R. Martín-Rodríguez, L. Simonelli, A. Serrano, A. García-Prieto, M. Fdez-Gubieda and A. Muela, Sci. Rep., 2020, 10, 1–12 CrossRef PubMed.
- G. Vargas, J. Cypriano, T. Correa, P. Leão, D. A. Bazylinski and F. Abreu, Molecules, 2018, 23, 2438 CrossRef PubMed.
- R. Kershi, F. Ali and M. Sayed, J. Adv. Ceram., 2018, 7, 218–228 CrossRef CAS.
- G. Wang, Q. Peng and Y. Li, Acc. Chem. Res., 2011, 44, 322–332 CrossRef CAS PubMed.
- N. Rezlescu, E. Rezlescu, C. Pasnicu and M. Craus, J. Phys.: Condens. Matter, 1994, 6, 5707 CrossRef CAS.
- W. Huan, C. Cheng, Y. Yang, H. Yuan and Y. Li, J. Nanosci. Nanotechnol., 2012, 12, 4621–4634 CrossRef CAS PubMed.
- H. Shimoshige, Y. Nakajima, H. Kobayashi, K. Yanagisawa, Y. Nagaoka, S. Shimamura, T. Mizuki, A. Inoue and T. Maekawa, PloS one, 2017, 12, e0170932 CrossRef PubMed.
- G. Zhang, R. Du, L. Zhang, D. Cai, X. Sun, Y. Zhou, J. Zhou, J. Qian, K. Zhong and K. Zheng, et al. , Adv. Funct. Mater., 2015, 25, 6101–6111 CrossRef CAS.
- A. Rȩkorajska, G. Cichowicz, M. K. Cyranski, M. Pȩkała and P. Krysinski, J. Magn. Magn. Mater., 2019, 479, 50–58 CrossRef.
- R. M. Petoral Jr, F. Soderlind, A. Klasson, A. Suska, M. A. Fortin, N. Abrikossova, L. Selegård, P.-O. Kall, M. Engstrom and K. Uvdal, J. Phys. Chem. C, 2009, 113, 6913–6920 CrossRef.
- S. Yeo, H. Choi, C. S. Kim, G. T. Lee, J. H. Seo, H. J. Cha and J. C. Park, Nanoscale, 2017, 9, 13976–13982 RSC.
- U. Heyen and D. Schüler, Appl. Microbiol. Biotechnol., 2003, 61, 536–544 CrossRef CAS PubMed.
- C. A. Schneider, W. S. Rasband and K. W. Eliceiri, Nat. Methods, 2012, 9, 671–675 CrossRef CAS PubMed.
- J. Rodríguez-Carvajal, Phys. B, 1993, 192, 55–69 CrossRef.
- M. Fleet, Acta Crystallogr., Sect. B: Struct. Crystallogr. Cryst. Chem., 1981, 37, 917–920 CrossRef.
- H. Zhang, V. Malik, S. Mallapragada and M. Akinc, J. Magn. Magn. Mater., 2017, 423, 386–394 CrossRef CAS.
- S. S. Laha, E. Abdelhamid, M. P. Arachchige, A. Kumar and A. Dixit, J. Am. Ceram. Soc., 2017, 100, 1534–1541 CrossRef CAS.
- A. Fischer, M. Schmitz, B. Aichmayer, P. Fratzl and D. Faivre, J. R. Soc., Interface, 2011, 8, 1011–1018 CrossRef CAS PubMed.
- M. L. Fdez-Gubieda, A. García-Prieto, J. Alonso and C. Meneghini, Iron Oxides, 2016, 397–422 Search PubMed.
- M. L. Fdez-Gubieda, A. Muela, J. Alonso, A. Garcia-Prieto, L. Olivi, R. Fernandez-Pacheco and J. M. Barandiarán, ACS Nano, 2013, 7, 3297–3305 CrossRef CAS PubMed.
- J. Baumgartner, G. Morin, N. Menguy, T. P. Gonzalez, M. Widdrat, J. Cosmidis and D. Faivre, Proc. Natl. Acad. Sci., 2013, 110, 14883–14888 CrossRef CAS PubMed.
- P. Bender, L. Marcano, I. Orue, D. A. Venero, D. Honecker, L. F. Barquín, A. Muela and M. L. Fdez-Gubieda, Nanoscale Adv., 2020, 2, 1115–1121 RSC.
- J. García and G. Subías, J. Phys.: Condens. Matter, 2004, 16, R145 CrossRef.
- V. Brabers, F. Walz and H. Kronmüller, Phys. Rev. B: Condens. Matter Mater. Phys., 1998, 58, 14163 CrossRef CAS.
- I. Orue, L. Marcano, P. Bender, A. García-Prieto, S. Valencia, M. Mawass, D. Gil-Cartón, D. A. Venero, D. Honecker and A. García-Arribas, et al. , Nanoscale, 2018, 10, 7407–7419 RSC.
- J. Carrey, B. Mehdaoui and M. Respaud, J. Appl. Phys., 2011, 109, 083921 CrossRef.
Footnote |
† Electronic supplementary information (ESI) available: Fig. S1 and S2: Collection of TEM images, where the appearance of R salts attached to the bacterial body and particularities of the magnetosome chains can be inspected. Fig. S3 includes the ZFC/FC M vs. H curves measured at different temperatures for the RE–doped MTB. Fig. S4 offers a comparison between the thermal evolution of ΔHC and |ΔMr/Ms| of the undoped, Gd [100![[thin space (1/6-em)]](https://www.rsc.org/images/entities/char_2009.gif) :100], Tb [100:100], Mn [480:100] and Mn [100:100] bacterial samples. See https://doi.org/10.1039/d2na00094f :100], Tb [100:100], Mn [480:100] and Mn [100:100] bacterial samples. See https://doi.org/10.1039/d2na00094f |
| This journal is © The Royal Society of Chemistry 2022 |