 Open Access Article
Unidirectional self-actuation transport of a liquid metal nanodroplet in a two-plate confinement microchannel†
Erli
Ni
a,
Lin
Song
b,
Zhichao
Li
a,
Guixuan
Lu
a,
Yanyan
Jiang
 *ac and
Hui
Li
 *a
*a
aKey Laboratory for Liquid-Solid Structural Evolution and Processing of Materials, Ministry of Education, Shandong University, Jinan 250061, China. E-mail: yanyan.jiang@sdu.edu.cn; lihuilmy@hotmail.com
bState Key Laboratory of Solidification Processing, Northwestern Polytechnical University, Xi'an 710072, China
cShenzhen Research Institute of Shandong University, Shenzhen 518057, China
First published on 13th April 2022
Abstract
Controllable directional transport of a liquid metal nanodroplet in a microchannel has been a challenge in the field of nanosensors, nanofluidics, and nanofabrication. In this paper, we report a novel design that the self-actuation of a gallium nanodroplet in a two-plate confinement microchannel could be achieved via a continuous wetting gradient. More importantly, suitable channel parameters could be used to manipulate the dynamic behavior of the gallium nanodroplet. The self-actuation transport in the two-plate confinement microchannel is the result of the competition between the driving force from the difference of the Laplace pressure and energy dissipation from the viscous resistance. Furthermore, we have identified the conditions to assess whether the droplet will pass through the contractive cross-section or not. This work can provide guidance for manipulating liquid metal nanodroplets in microchannels.
Introduction
Manipulating the nanodroplet movement in a microchannel has been investigated extensively due to its application in daily life and industrial processes. For instance, shorebirds use surface tension to induce transport of millimetric droplets in their beaks;1,2 in microfluidics,3–5 printing,6,7 and oil–water separation,8 the microchannel is conducive to achieve directional transport of droplets. Thus far, there have been many techniques to propel droplet motion using an external oscillatory electric field,9,10 chemical reaction,11 vibrating substrates,12,13 thermal gradients,14,15 light,16 and magnetic fields.17 Lv et al.18 reported a strategy to drive droplets by light-induced asymmetric deformation of the channel wall. Bush et al.1 created the pressure difference to move droplets by repeatedly opening and closing the non-parallel plates. Under some sophisticated conditions, especially in the fields of biosensing,19 medical diagnostics,20 and drug delivery,21 it is of great importance to maintain liquid stability. However, its stability may be destroyed by external forces. Furthermore, most of the abovementioned methods require the addition of functional particles/substances (i.e., photosensitive surfactants18 and magnetic particles22,23) to the droplet, possibly leading to unnecessary contamination24 and consequently limiting their potential applications. Therefore, realizing the self-actuation of the droplet without an externally applied force becomes a dream.A feasible strategy to achieve the self-actuation of a liquid is to design a surface with the wetting gradient, which has been widely exploited by living organisms. For example, semiaquatic insects25 could move freely on water by secreting surfactants to modify the surface tension of water; desert beetles26 use their backs with patterns of hydrophobic troughs and hydrophilic bumps to collect fog or water vapor from the air. Such a surface tension gradient creates a difference in the contact angle on both sides of the droplet, which could provide the driving force for its self-actuation. Inspired by these natural phenomena, Chaudhury et al.27 for the first time fabricated an artificial wetting gradient to control the spontaneous movement of water. Subsequently, some researchers have made great progress in designing and fabricating a wetting gradient surface. In our previous work,28 radial texture gradient substrates were used to achieve the self-actuation of a gallium nanodroplet. Jiang et al.29 introduced a strategy based on slippery surfaces with immobilized lubricant menisci to directionally transport microdroplets with high efficiency. Theodorakis et al.30 observed that droplets with better adhesion to the substrate exhibit, as a rule, essentially spontaneous unidirectional movement toward the rigid part of the substrate. Ju et al.31 designed a cone-shaped structure to fabricate an efficient fog collection system inspired by the cactus, which benefits from the gradient of the Laplace pressure, the gradient of the surface free energy, and multi-function integration. The preparation of the wetting gradient surface has been achieved by using techniques such as photolithography,32,33 microcontact printing,34 self-assembled monolayers (SAM),35–37 and chemical vapor deposition.38 In addition to experimental studies, molecular dynamics (MD) simulations also play an indispensable role in understanding self-actuation. Zhang et al.39 performed the classical MD method to investigate the self-driving behaviors of liquid mercury (Hg) on a graphene–Cu composite substrate. Hao et al.40 controlled both velocity and direction of the nanodroplet movement on a wedge-shaped groove employing MD simulations.
To date, controlling the self-actuation of a nanodroplet in a two-plate confinement microchannel has not been well studied. Furthermore, most self-actuation studies attach importance to aqueous liquids, but the self-actuation of liquid metals is even more significant because these fluids may have many desirable properties, such as favorable metallic conductivity,41 low bulk viscosity,42 and larger surface tension than water. Therefore, this paper has proposed an innovative approach to achieve long-range spontaneous motion of a liquid gallium nanodroplet in a two-plate confinement microchannel with the wetting gradient. We have performed the MD method to study the transport behaviors of gallium nanodroplets in two-plate confinement or varying cross-section microchannels.
Methods
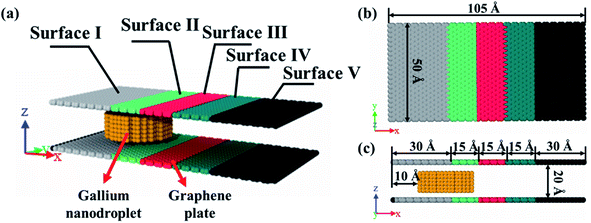
The model was composed of two parallel graphene plates with specific wetting gradients, and a liquid gallium nanodroplet, as schematically shown in Fig. 1a. A gallium nanodroplet with 1002 atoms was put between parallel graphene plates. The graphene plates were divided into five zones to mimic surfaces with different wettabilities, named surfaces I–V in turn. As shown in Fig. 1b and c, the initial location of the liquid gallium nanodroplet was 10 Å far from the left edge of the channel, and the head and tail surfaces of the channel, that is, surface I and surface V, were 30 Å in length. The lengths of other surfaces were 15 Å. The height between the two plates was set as 20 Å.Molecular dynamics (MD) simulations were performed to study how to achieve the self-actuation of the gallium nanodroplet in the two-plate confinement microchannel, using the large-scale atomic/molecular massively parallel simulator (LAMMPS) package.43 In the simulation, the time integration of Newton's equation of motion was calculated by using the velocity Verlet algorithm44 with a time step of 1.0 fs, meanwhile, the system temperature was controlled by the Nose–Hoover thermostat method45 under the conditions of NVT ensemble and three-dimensional periodic boundary. Visualization and analysis of simulation trajectory data were conducted by using Open Visualization Tool (OVITO) software packages. The processing time of the simulations was 1000 ps.
The adaptive intermolecular empirical bond order (AIREBO) interatomic potential was used to describe the C–C interaction among carbon atoms of graphene plates. The AIREBO potential could be expressed as follows:46
 | (1) |
The interactions among gallium atoms were modeled by the embedded atom method (EAM) interatomic potential, which could reproduce some basic properties including the melting point and liquid density of gallium quite well. The EAM potential is given as:47
 | (2) |
 | (3) |
Results and discussion
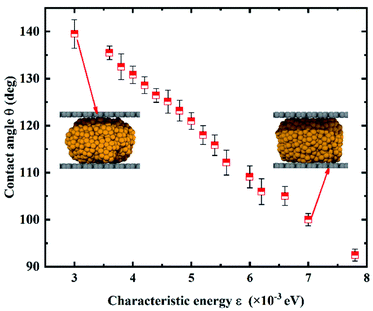
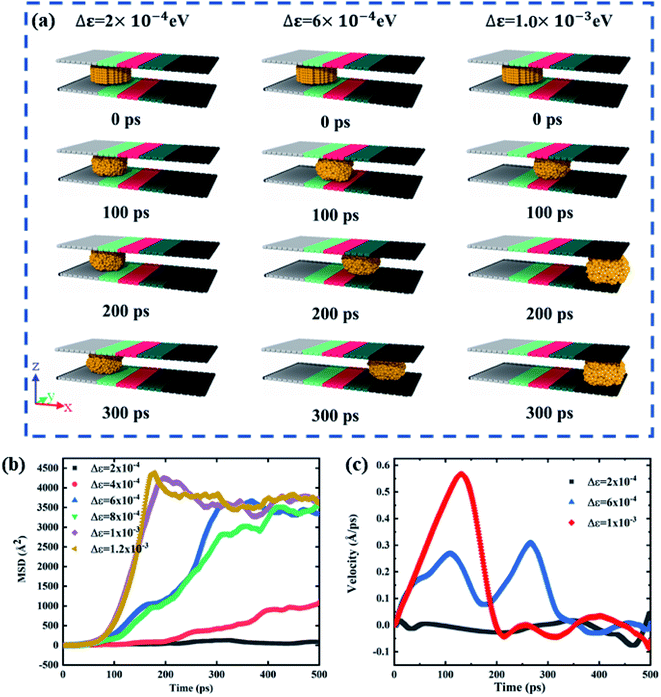
Wettability of the gallium nanodroplet between two graphene plates has been first investigated at equilibrium to unveil variation of the wettability with the different characteristic energies ε. The contact angle of the gallium nanodroplet between two graphene parallel plates is employed to evaluate the wettability. The density distribution function is used to obtain the droplet profile, and then the contact angle is determined by the fitting method (the details are shown in the ESI†). As shown in Fig. 2, the contact angle shows a monotonous decrease with the increase of the characteristic energy ε, indicating a successful transition of surface wettability by tuning ε. Especially, when ε increases from 3 × 10⁻³ eV to 7.8 × 10⁻³ eV, the contact angle continuously decreases from 139.50° to 92.45°. This change can also be seen from the snapshots in the insets of Fig. 2. More importantly, the MD simulation results show that the relationship between the characteristic energy ε and the contact angle θ is almost linear. Thus, there is a quantitative relationship between ε and θ, indicating that the wetting gradient surface could be created by setting Δε.To obtain the two-plate confinement microchannel with the specific wetting gradient, we set Δε in continuous regions on the two graphene plates. The energy parameter ε from surface I to surface V increases successively, indicating that a wetting gradient with decreasing contact angle is established. The mass center of the gallium nanodroplet is placed on the joint between surface I and surface II. Fig. 3a shows the snapshots of the gallium nanodroplet at different time points. An obviously continuous motion of the gallium droplet is observed along the x-direction once it is released after the initial equilibrium, demonstrating that the suitable wetting gradient could make the gallium nanodroplet achieve the long-range spontaneous self-actuation in the two-plate confinement microchannel. Meanwhile, the movements of the gallium nanodroplet vary with different wetting gradients (Δε). Fig. 3b shows the mean square displacement (MSD) of the gallium nanodroplet under different gradients. The MSD is significantly increased with the increase of the wetting gradient Δε. If Δε < 6 × 10⁻⁴ eV, the wetting gradient is too small to drive the gallium nanodroplet in the two-plate confinement microchannel, so the gallium nanodroplet has no obvious displacement in the gradient direction. When 6 × 10⁻⁴ eV ≤ Δε < 1 × 10⁻³ eV, the gallium nanodroplet could move slowly in the two-plate confinement microchannel and reach surface V within 400 ps. Then, the droplet vibrates at a small scale because there is no wetting gradient to drive the droplets. If Δε ≥ 1 × 10⁻³ eV, the large wetting gradient could drive the gallium nanodroplet from surface I to surface V rapidly (ESI, Movies 1–3†). The average velocity of all the gallium atoms in the nanodroplet under Δε = 2 × 10⁻⁴ eV, Δε = 6 × 10⁻⁴ eV and Δε = 1 × 10⁻³ eV is also investigated. As shown in Fig. 3c, the average velocity of the gallium droplet initially goes higher with increasing wetting gradient, which is derived from the larger acceleration of the droplet under a higher wetting gradient. It can be seen that the velocity remains almost zero under Δε = 2 × 10⁻⁴ eV. When Δε = 1 × 10⁻³ eV, the gallium nanodroplet quickly achieves its maximum velocity and then its velocity fades away after reaching the right edge of the two-plate confinement microchannel. Interestingly, the average velocity of the gallium droplet is wave-like when Δε = 6 × 10⁻⁴ eV.
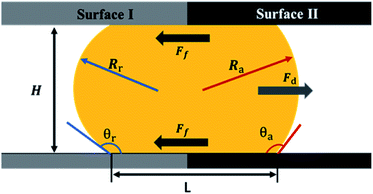
To get a better understanding of the motion of the gallium droplet, we next analyze the driving mechanism of the gallium nanodroplet transport in the two-plate confinement microchannel. Fig. 4 illustrates the theoretical scenario of the gallium nanodroplet motion. The gallium nanodroplet in the two-plate confinement microchannel with height H forms respective menisci with angles θ1 and θ2 on both sides. Without the wetting gradient, the two menisci are symmetric (θ1 = θ2), and the droplet is in a stable state of mechanical equilibrium. When the gallium nanodroplet is placed on the wetting gradient surface, the contact angles on both sides are different, which will drive the droplet to move toward the direction of the decreasing contact angle. Fig. 4 shows that the curvature radius on both sides of the droplet changes with different contact angles. According to the geometric relationship, a smaller contact angle would form a curvature with a larger radius, indicating that the droplet would move towards the direction of the larger radius of curvature in the two-plate confinement microchannel. Therefore, the curvature variation at each end of the droplet would generate a difference in the Laplace pressure (ΔP) to propel the gallium droplet, which scales as:49
 | (4) |
 | (5) |
 | (6) |
In addition to the driving force, the gallium droplet would also suffer resistance resulting from viscosity. The viscosity of the gallium droplet would conspicuously hinder the motion, especially in the two-plate confinement channel. The gallium nanodroplet motion is resisted by the viscous resistance Ff which could be expressed as:2
 | (7) |
The driving force and the resistance of the gallium nanodroplet moving in the two-plate confinement microchannel are calculated. Fig. 5a and b show the driving force and the viscous resistance of the gallium nanodroplet within 300 ps. We can see that the driving force remains basically balanced (as shown by the dotted line in Fig. 5a) until the gallium nanodroplet reaches surface V, indicating that the wetting gradient could continuously provide the driving force for the movement. However, the viscous resistance ( ) would increase when the droplet is continuously accelerated. When Δε = 2 × 10⁻⁴ eV, the small wetting gradient makes the contact angle on both sides basically the same. Therefore, there is no energy asymmetry and the Laplace pressure difference (ΔP), so the gallium nanodroplet has no obvious displacement and velocity in the gradient direction. For the gradient of Δε = 6 × 10⁻⁴ eV, the absolute value of the viscous resistance approaches or even exceeds the absolute value of the driving force when the velocity reaches the maximum, suggesting that the driving force provided by the wetting gradient is not enough to accelerate the gallium nanodroplet. Therefore, the droplet velocity would decrease after reaching its peak. The droplet reaches surface V by accelerating twice (two peaks) and decelerating once (one trough). When the gallium nanodroplet completely reaches surface V, there is no longer the wetting gradient to provide the driving force, resulting in its velocity fading away. If Δε = 1.2 × 10⁻³ eV, the larger wetting gradient significantly increases the energy asymmetry on both sides of the droplet, generating a large enough driving force. In this case, the driving force completely dominates the competition with the viscous resistance as shown in Fig. 5a and b. Therefore, the sufficient driving force could keep the droplet in an accelerated state. Finally, the droplet completely reaches surface V, and the velocity reaches maximum. Based on the above analysis, we may safely come to conclusion that the displacement and velocity of the nanodroplet in the two-plate confinement channel are determined by the competition between the driving force and the energy dissipation in the droplet moving process.
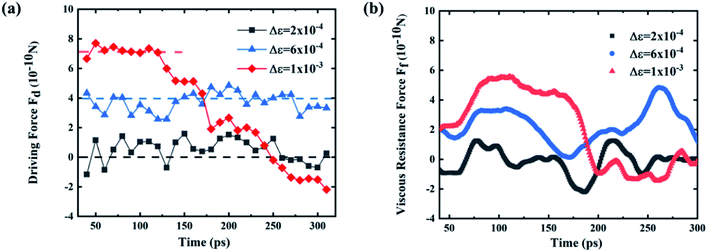 | ||
| Fig. 5 (a) Driving force and (b) viscous resistance of the gallium nanodroplet when Δε = 2 × 10⁻⁴ eV, Δε = 6 × 10⁻⁴ eV and Δε = 1 × 10⁻³ eV. | ||
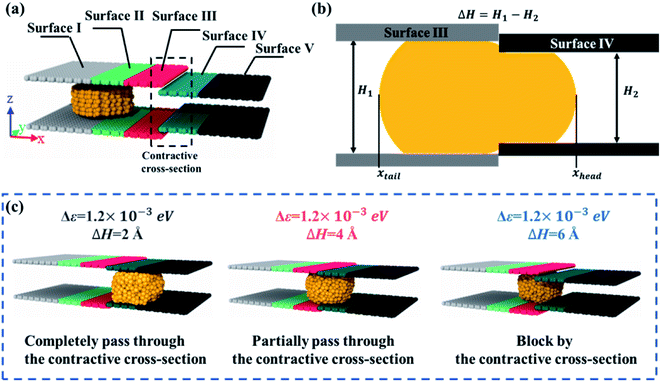
The above studies focus on that the gallium nanodroplet moves in the flat and smooth two-plate microchannel in the presence of a wetting gradient without any other external forces. However, in many situations, the channel walls may not be flat, but be rough or have obstructions. Especially, in the field of microfluidics, the varying cross-section could be used to control velocities, interaction times and so on. Therefore, we are next about to discuss the dynamic behavior of the gallium nanodroplet in the varying cross-section microchannel with the wetting gradient. As shown in Fig. 6a, we have created a contractive cross-section by designing two steps between surface III and surface IV. The heights of channel cross-sections are H1 and H2 respectively as shown in Fig. 6b; thus, the difference of the height between two cross-sections is defined as ΔH. Then, the mass center of the gallium nanodroplet is placed on the joint between surface I and surface II. The gallium nanodroplet would gradually move toward the direction of the contractive cross-section driven by the wetting gradient (Δε is set as 1.2 × 10⁻³ eV). To better describe the dynamic behaviors, the head and tail positions of the droplet are named respectively xhead and xtail as shown in Fig. 6b. The dynamic behaviors of the gallium nanodroplet at different cross-section height differences ΔH could be presented as three different scenarios: (1) completely passing through the contractive cross-section; (2) partially passing through the contractive cross-section, and (3) being blocked by the contractive cross-section. It can be seen that the gallium nanodroplet could completely pass through the contractive cross-section when ΔH = 2 Å, as shown in Fig. 6c (ESI, Movies 4–6†). The gallium nanodroplet partially passes through the contractive cross-section when ΔH = 4 Å. Finally, the nanodroplet would be blocked by the contractive cross-section when ΔH = 6 Å.
The interactions between the gallium nanodroplet and surfaces (I–V) are used to further explain these different dynamic behaviors. The interactions are represented by the adhesion energy, Ead,i (i is the sequence number of surfaces). The adhesion energy Ead,i is defined as the absolute value of the LJ interaction potentials between gallium atoms and carbon atoms on surface i. Then, the difference of adhesion energies between surface III and surface IV could be expressed as:50
| ΔEad = Ead,4 − Ead,3 | (8) |
As shown in Fig. 6a, surface III and surface IV are the front and rear surfaces of the contractive cross-section, respectively. Therefore, we could analyze the detail of the gallium nanodroplet across the contractive cross-section by ΔEad. ΔEad > 0 suggests that the droplet is in closer contact with surface IV; that is, more gallium atoms could pass through the contractive cross-section. In contrast, ΔEad < 0 means that more gallium atoms stay on surface III. The ability of the droplet to establish more interactions with surface IV will eventually determine whether the droplet will be able to fully pass through the contractive cross-section.
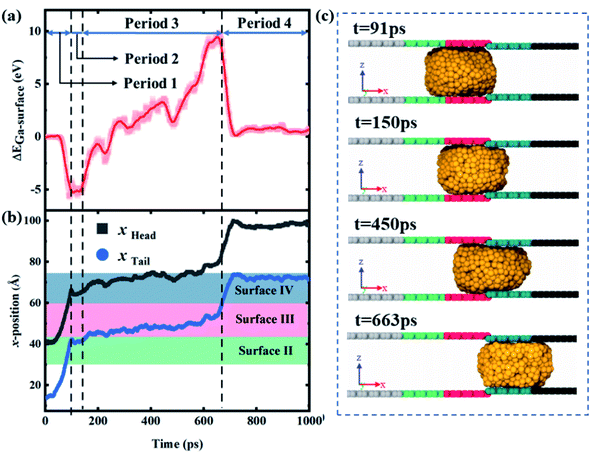
Fig. 7a and b show that the variation of ΔEad and the head and tail positions of the droplet with time for a case where the gallium nanodroplet could completely pass through the contractive cross-section at Δε = 1.2 × 10⁻³ eV and ΔH = 2 Å. This process could be divided into four different periods as shown in Fig. 7a. During the first period from t = 0 to 91 ps, the gallium droplet contacts surface III and does not touch surface IV at all. Therefore, ΔEad depends entirely on Ead,3, resulting in the decrease of ΔEad from 0 to a negative minimum. At t = 91 ps, the head of the droplet reaches the joint of the contractive cross-section, as shown in Fig. 7b and c. During the second period from t = 91 to 150 ps, ΔEad remains steady for a while. In the final stage of the second period (t = 150 ps), the head of the gallium nanodroplet drills into the contractive cross-section as shown in Fig. 7c.
The third period corresponds to t = 150–663 ps, the ΔEad increases from the minimum to the maximum, and gradually turns from negative to positive, indicating that Ead,4 is significantly enhanced. As the time goes on, the head and tail (xhead, xtail) move very slowly because the droplet is hampered by the contractive cross-section. Until t = 633 ps, the tail of the droplet completely leaves surface III, suggesting that the droplet completely passes through the contractive cross-section. During the final period from t = 633 to 1000 ps, ΔEad begins to decrease and the tail of the droplet rapidly leaves surface IV under the acceleration of the wetting gradient. Eventually, the gallium nanodroplet moves away from surface IV and reaches surface V.
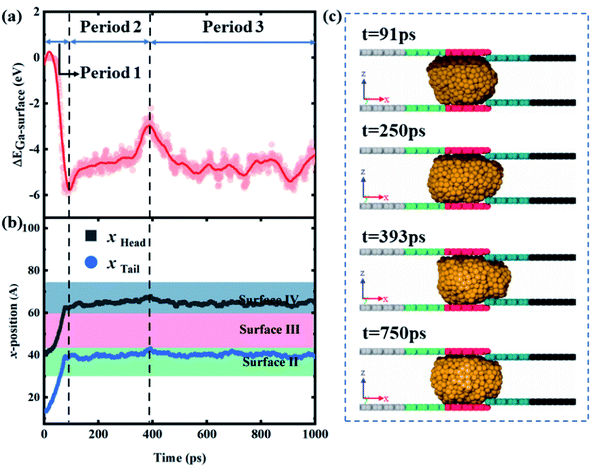
As shown in Fig. 8a, ΔEad is always negative and Ead,4 is smaller than Ead,3 when Δε = 1.2 × 10⁻³ eV and ΔH = 4 Å, indicating that the droplet could not fully contact surface IV. Similarly, the gallium nanodroplet successfully gets transported to the joint of the contractive cross-section in the first period. Then, Ead,4 gradually increases, which manifests as an increasing contact area between the droplet and surface IV as shown in Fig. 8c. Until t = 393 ps, ΔEad reaches the maximum and xhead becomes the largest. Subsequently, Ead,4 and Ead,3 become stable, ΔEad fluctuates lightly resulting in the head and tail positions of the droplet remaining stationary. This stable state lasts from 393 ps to 1000 ps (the third period), indicating that the gallium nanodroplet is stuck at the contractive cross-section. Therefore, the gallium nanodroplet would partially contact surface IV forming the scenarios of partially passing through the contractive cross-section. If ΔH becomes larger (ΔH = 6 Å), the droplet cannot enter the contractive cross-section over the whole process, and ΔEad is basically provided by Ead,3. Therefore, there is not enough energy to overcome the energy barrier created by larger ΔH. Finally, the droplet would stay in front of the contractive cross-section as shown in Fig. S2.†
To further delineate the self-actuation behaviors of the gallium nanodroplet in the contractive cross-section microchannel, the force analysis based on the Young–Laplace equation is carried out. For a droplet confined inside the channel, the curvatures of its trailing and advancing menisci could be obtained in terms of the geometric relationships as follows:
 | (9) |
 | (10) |
Lastly, the pressure difference ΔPC in the x-direction within the gallium nanodroplet confined inside the contractive cross-sections can be written as
 | (11) |
If we define the ratio  , then eqn (11) can be expressed as
 | (12) |
Obviously, whether the gallium nanodroplet could pass through the contraction section or ΔPC is positive or negative, is dependent on the contact angle θr, the wetting gradient Δθ and the ratio λ. In this work, θr could be regard as a constant, implying that ΔPC is determined by Δθ and the ratio λ, which varies with the change of the wetting gradient Δε and the difference of cross-section height ΔH. It can be seen that when cos(θr − Δθ) > (1 + λ)cos![[thin space (1/6-em)]](https://www.rsc.org/images/entities/char_2009.gif) θr, the droplet would pass through the contractive cross-section completely. If cos(θr − Δθ) = (1 + λ)cos
θr, the droplet would pass through the contractive cross-section completely. If cos(θr − Δθ) = (1 + λ)cos![[thin space (1/6-em)]](https://www.rsc.org/images/entities/char_2009.gif) θr, the droplet would be trapped by the contractive cross-section, thus keeping the state of partially passing through the contractive cross-section. However, when cos(θr − Δθ) < (1 + λ)cos
θr, the droplet would be trapped by the contractive cross-section, thus keeping the state of partially passing through the contractive cross-section. However, when cos(θr − Δθ) < (1 + λ)cos![[thin space (1/6-em)]](https://www.rsc.org/images/entities/char_2009.gif) θr, because ΔPC < 0, the whole droplet appears to be completely blocked. In addition, in the case of the same wetting gradient, the larger ΔH (the larger λ) means that it is difficult for the gallium nanodroplet to pass through the contractive cross-section. On the other hand, if ΔH is fixed, the droplet is more likely to pass through the contractive cross-section with the increase of the wetting gradient (the increase of Δθ). Therefore, we define the wetting gradient Δε and the difference of cross-section height ΔH as channel parameters, which could be employed to manipulate the dynamic behaviors of the gallium nanodroplet in the contractive cross-section microchannel.
θr, because ΔPC < 0, the whole droplet appears to be completely blocked. In addition, in the case of the same wetting gradient, the larger ΔH (the larger λ) means that it is difficult for the gallium nanodroplet to pass through the contractive cross-section. On the other hand, if ΔH is fixed, the droplet is more likely to pass through the contractive cross-section with the increase of the wetting gradient (the increase of Δθ). Therefore, we define the wetting gradient Δε and the difference of cross-section height ΔH as channel parameters, which could be employed to manipulate the dynamic behaviors of the gallium nanodroplet in the contractive cross-section microchannel.
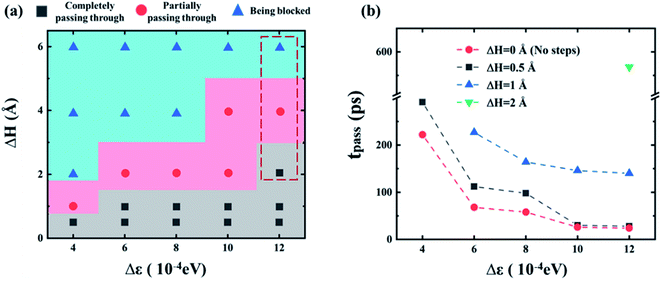
Furthermore, the relationship between the dynamic behaviors and the channel conditions is summarized in Fig. 9a. With the increasing wetting gradient Δε and the difference of cross-section height ΔH, the gallium nanodroplet is more difficult to pass through the contractive cross-section. Under the same wetting gradient, gallium droplet would show a transition from completely passing to partially passing and finally being blocked by the contractive cross-section with the increase of ΔH. This map could provide guidance on how to manipulate metal nanodroplets in microfluidic applications.
Fig. 9b shows a comparison of the time consumed to fully pass through the contractive cross-section, tpass, under different ΔH and Δε. tpass is defined as follows:
| tpass = t2 − t1 | (13) |
Conclusions
In summary, we have found that the gallium nanodroplet can have spontaneous and unidirectional self-actuation in the two-plate confinement microchannel without any external energy input. The results indicate that the gallium nanodroplet would undergo different motion processes driven by different wetting gradients. The difference between the curvatures of droplet trailing and advancing menisci would generate a difference in the Laplace pressure (ΔP) to propel the gallium nanodroplet. At the same time, the movement of the gallium nanodroplet is resisted by the viscous resistance. Therefore, the competition between driving force Fd and viscous resistance Ff would generate different dynamic behaviors. Furthermore, this study also investigates the dynamic behavior of gallium nanodroplets in the contractive cross-section microchannel. There are three different scenarios including completely passing through the contractive cross-section, partially passing through the contractive cross-section and being blocked by the contractive cross-section. Based on the Young–Laplace equation, we identify the channel parameters that can manipulate the transport behaviors of the nanodroplet. Additionally, the time consumed to fully pass through the contractive cross-section could also be regulated by adjusting the channel parameters. The results suggest a subtle approach to manipulate liquid metal nanodroplets in a microchannel, which may offer potential for a wide range of applications, especially in the field of microfluidics.Conflicts of interest
There are no conflicts to declare.Acknowledgements
The authors acknowledge the support from the National Natural Science Foundation of China (U1806219), the Guangdong Basic and Applied Basic Research Foundation (Grant No. 2019A1515110846) and the fund of the State Key Laboratory of Solidification Processing in NWPU (Grant No. SKLSP202108). The Special Funding also supports this work in the Project of the Taishan Scholar Program and Qilu Young Scholar Program of Shandong University.References
- J. W. M. Bush, F. Peaudecerf, M. Prakash and D. Quéré, Adv. Colloid Interface Sci., 2010, 161, 10–14 CrossRef CAS PubMed.
- M. Prakash, D. Quéré and J. W. M. Bush, Science, 2008, 320, 931–934 CrossRef CAS PubMed.
- J. N. Belling, L. K. Heidenreich, J. H. Park, L. M. Kawakami, J. Takahashi, I. M. Frost, Y. Gong, T. D. Young, J. A. Jackman, S. J. Jonas, N.-J. Cho and P. S. Weiss, ACS Appl. Mater. Interfaces, 2020, 12, 45744–45752 CrossRef CAS PubMed.
- P. N. Nge, C. I. Rogers and A. T. Woolley, Chem. Rev., 2013, 113, 2550–2583 CrossRef CAS PubMed.
- F. Ahmadi, K. Samlali, P. Q. N. Vo and S. C. C. Shih, Lab Chip, 2019, 19, 524–535 RSC.
- X. Cao, Y. Ye, Q. Tang, E. Chen, Z. Jiang, J. Pan and T. Guo, J. Phys. Chem. Lett., 2020, 11, 8442–8450 CrossRef CAS PubMed.
- N. Ochirkhuyag, R. Matsuda, Z. Song, F. Nakamura, T. Endo and H. Ota, Nanoscale, 2021, 13, 2113–2135 RSC.
- C. Luo and X. Heng, Langmuir, 2014, 30, 10002–10010 CrossRef CAS PubMed.
- J. Zeng, S. Zhang, K. Tang, G. Chen, W. Yuan and Y. Tang, Nanoscale, 2018, 10, 16079–16086 RSC.
- C. Liu, J. Sun, Y. Zhuang, J. Wei, J. Li, L. Dong, D. Yan, A. Hu, X. Zhou and Z. Wang, Nanoscale, 2018, 10, 23164–23169 RSC.
- N. J. Suematsu, Y. Mori, T. Amemiya and S. Nakata, J. Phys. Chem. Lett., 2021, 12, 7526–7530 CrossRef CAS PubMed.
- T. Li, J. Li, H. Lin, Y. Duan, Y. Xia, Y. Jiang and H. Li, Appl. Surf. Sci., 2019, 473, 393–400 CrossRef CAS.
- D. Wu, Z. Zhang, Y. Zhang, Y. Jiao, S. Jiang, H. Wu, C. Li, C. Zhang, J. Li, Y. Hu, G. Li, J. Chu and L. Jiang, Adv. Mater., 2020, 32, 2005039 CrossRef CAS PubMed.
- E. Oyarzua, J. H. Walther and H. A. Zambrano, Phys. Chem. Chem. Phys., 2018, 20, 3672–3677 RSC.
- C. Bakli, S. H. P. D and S. Chakraborty, Nanoscale, 2017, 9, 12509–12515 RSC.
- S. An, M. Zhu, K. Gu, M. Jiang, Q. Shen, B. Fu, C. Song, P. Tao, T. Deng and W. Shang, Nanoscale, 2020, 12, 4295–4301 RSC.
- W. Lei, G. Hou, M. Liu, Q. Rong, Y. Xu, Y. Tian and L. Jiang, Sci. Adv., 2018, 4, eaau8767 CrossRef CAS PubMed.
- J.-a. Lv, Y. Liu, J. Wei, E. Chen, L. Qin and Y. Yu, Nature, 2016, 537, 179–184 CrossRef CAS PubMed.
- J. Charmet, P. Arosio and T. P. J. Knowles, J. Mol. Biol., 2018, 430, 565–580 CrossRef CAS PubMed.
- M. Zarei, Biosens. Bioelectron., 2017, 98, 494–506 CrossRef CAS PubMed.
- G. B. Celli and A. Abbaspourrad, Annu. Rev. Food Sci. Technol., 2018, 9, 481–501 CrossRef PubMed.
- J. V. I. Timonen, M. Latikka, L. Leibler, R. H. A. Ras and O. Ikkala, Science, 2013, 341, 253–257 CrossRef CAS PubMed.
- J. Vialetto, M. Hayakawa, N. Kavokine, M. Takinoue, S. N. Varanakkottu, S. Rudiuk, M. Anyfantakis, M. Morel and D. Baigl, Angew. Chem., Int. Ed., 2017, 56, 16565–16570 CrossRef CAS PubMed.
- S. Huang, J. Li, L. Chen and X. Tian, J. Phys. Chem. Lett., 2021, 12, 3577–3585 CrossRef CAS PubMed.
- J. W. M. Bush and D. L. Hu, Annu. Rev. Fluid. Mech., 2006, 38, 339–369 CrossRef.
- A. R. Parker and C. R. Lawrence, Nature, 2001, 414, 33–34 CrossRef CAS PubMed.
- M. K. Chaudhury and G. M. Whitesides, Science, 1992, 256, 1539–1541 CrossRef CAS PubMed.
- E. Ni, K. Lu, L. Song, Y. Jiang and H. Li, Langmuir, 2021, 37, 13654–13663 CrossRef CAS PubMed.
- J. Jiang, J. Gao, H. Zhang, W. He, J. Zhang, D. Daniel and X. Yao, Proc. Natl. Acad. Sci. U. S. A., 2019, 116, 2482 CrossRef CAS PubMed.
- P. E. Theodorakis, S. A. Egorov and A. Milchev, J. Chem. Phys., 2017, 146, 244705 CrossRef PubMed.
- J. Ju, H. Bai, Y. Zheng, T. Zhao, R. Fang and L. Jiang, Nat. Commun., 2012, 3, 1247 CrossRef PubMed.
- J. Long, Q. Weng, W. Hong, Z. Cao, P. Zhou and X. Xie, Exp. Therm. Fluid Sci., 2019, 103, 9–17 CrossRef CAS.
- J. Li, X. Zhou, J. Li, L. Che, J. Yao, G. McHale, M. K. Chaudhury and Z. Wang, Sci. Adv., 2017, 3, eaao3530 CrossRef PubMed.
- M. Gai, J. Frueh, T. Tao, A. V. Petrov, V. V. Petrov, E. V. Shesterikov, S. I. Tverdokhlebov and G. B. Sukhorukov, Nanoscale, 2017, 9, 7063–7070 RSC.
- I. U. Chowdhury, P. S. Mahapatra and A. K. Sen, Phys. Fluids, 2019, 31, 042111 CrossRef.
- Y. Xing, W. Shang, Q. Wang, S. Feng, Y. Hou and Y. Zheng, ACS Appl. Mater. Interfaces, 2019, 11, 10951–10958 CrossRef CAS PubMed.
- K. M. Ashraf, C. Wang, S. S. Nair, K. J. Wynne, D. A. Higgins and M. M. Collinson, Langmuir, 2017, 33, 4207–4215 CrossRef CAS PubMed.
- S. C. Hernández, C. J. C. Bennett, C. E. Junkermeier, S. D. Tsoi, F. J. Bezares, R. Stine, J. T. Robinson, E. H. Lock, D. R. Boris, B. D. Pate, J. D. Caldwell, T. L. Reinecke, P. E. Sheehan and S. G. Walton, ACS Nano, 2013, 7, 4746–4755 CrossRef PubMed.
- Z. Zhang, X. Guo, H. Tang, J. Ding, Y.-G. Zheng and S. Li, ACS Appl. Mater. Interfaces, 2019, 11, 28562–28570 CrossRef CAS PubMed.
- S. Hao, Z. Xie, Z. Li, J. Kou and F. Wu, Nanoscale, 2021, 13, 15963–15972 RSC.
- M. Dickey, Adv. Mater., 2017, 29, 1606425 CrossRef PubMed.
- K. E. Spells, Proc. Phys. Soc., 1936, 48, 299 CrossRef CAS.
- S. Plimpton, J. Comput. Phys., 1995, 117, 1–19 CrossRef CAS.
- N. S. Martys and R. D. Mountain, Phys. Rev. E: Stat., Nonlinear, Soft Matter Phys., 1999, 59, 3733–3736 CrossRef CAS.
- W. Shinoda, R. DeVane and M. L. Klein, Mol. Simul., 2007, 33, 27–36 CrossRef CAS.
- F. Suarez, D. P. Parekh, C. Ladd, D. Vashaee, M. D. Dickey and M. C. Öztürk, Appl. Energy, 2017, 202, 736–745 CrossRef.
- M. I. Baskes, S. P. Chen and F. J. Cherne, Phys. Rev. B: Condens. Matter Mater. Phys., 2002, 66, 351–363 CrossRef.
- E. Betranhandy, S. F. Matar, C. El-Kfoury, R. Weihrich and J. Etourneau, Z. Anorg. Allg. Chem., 2004, 630, 2587–2598 CrossRef CAS.
- C. Lv, C. Chen, Y.-C. Chuang, F.-G. Tseng, Y. Yin, F. Grey and Q. Zheng, Phys. Rev. Lett., 2014, 113, 026101 CrossRef PubMed.
- T. W. Kwon, J. Jang, M. S. Ambrosia and M. Y. Ha, Colloids Surf., A, 2018, 559, 209–217 CrossRef CAS.
Footnote |
| † Electronic supplementary information (ESI) available: Adjusting wettability by simply changing the characteristic energy parameter; the calculation details of the contact angle; the details of the scenario of being blocked by the contractive cross-section; why the effect of the oxide layer was not considered; the details on the calculation of the interaction energy; the effect of the Concus–Finn criterion (PDF); movie about the motion process under different channel parameters (AVI). See https://doi.org/10.1039/d1na00832c |
| This journal is © The Royal Society of Chemistry 2022 |

